Experience Usermaven’s effortless dashboard
At Usermaven, we believe in keeping things simple and fast. No more struggling with complex reports or getting lost in a sea of metrics you don't need. Say goodbye to complex navigation menus and the need for additional sub-menus. Our goal is to give you a clear and efficient web analytics dashboard right from the start.
Don't just take our word for it—check out our live demo (opens in a new tab) to see real-time traffic data in action. See how Usermaven can change the way you understand and use website analytics.
Here's a quick look at what you'll find on your Usermaven dashboard:
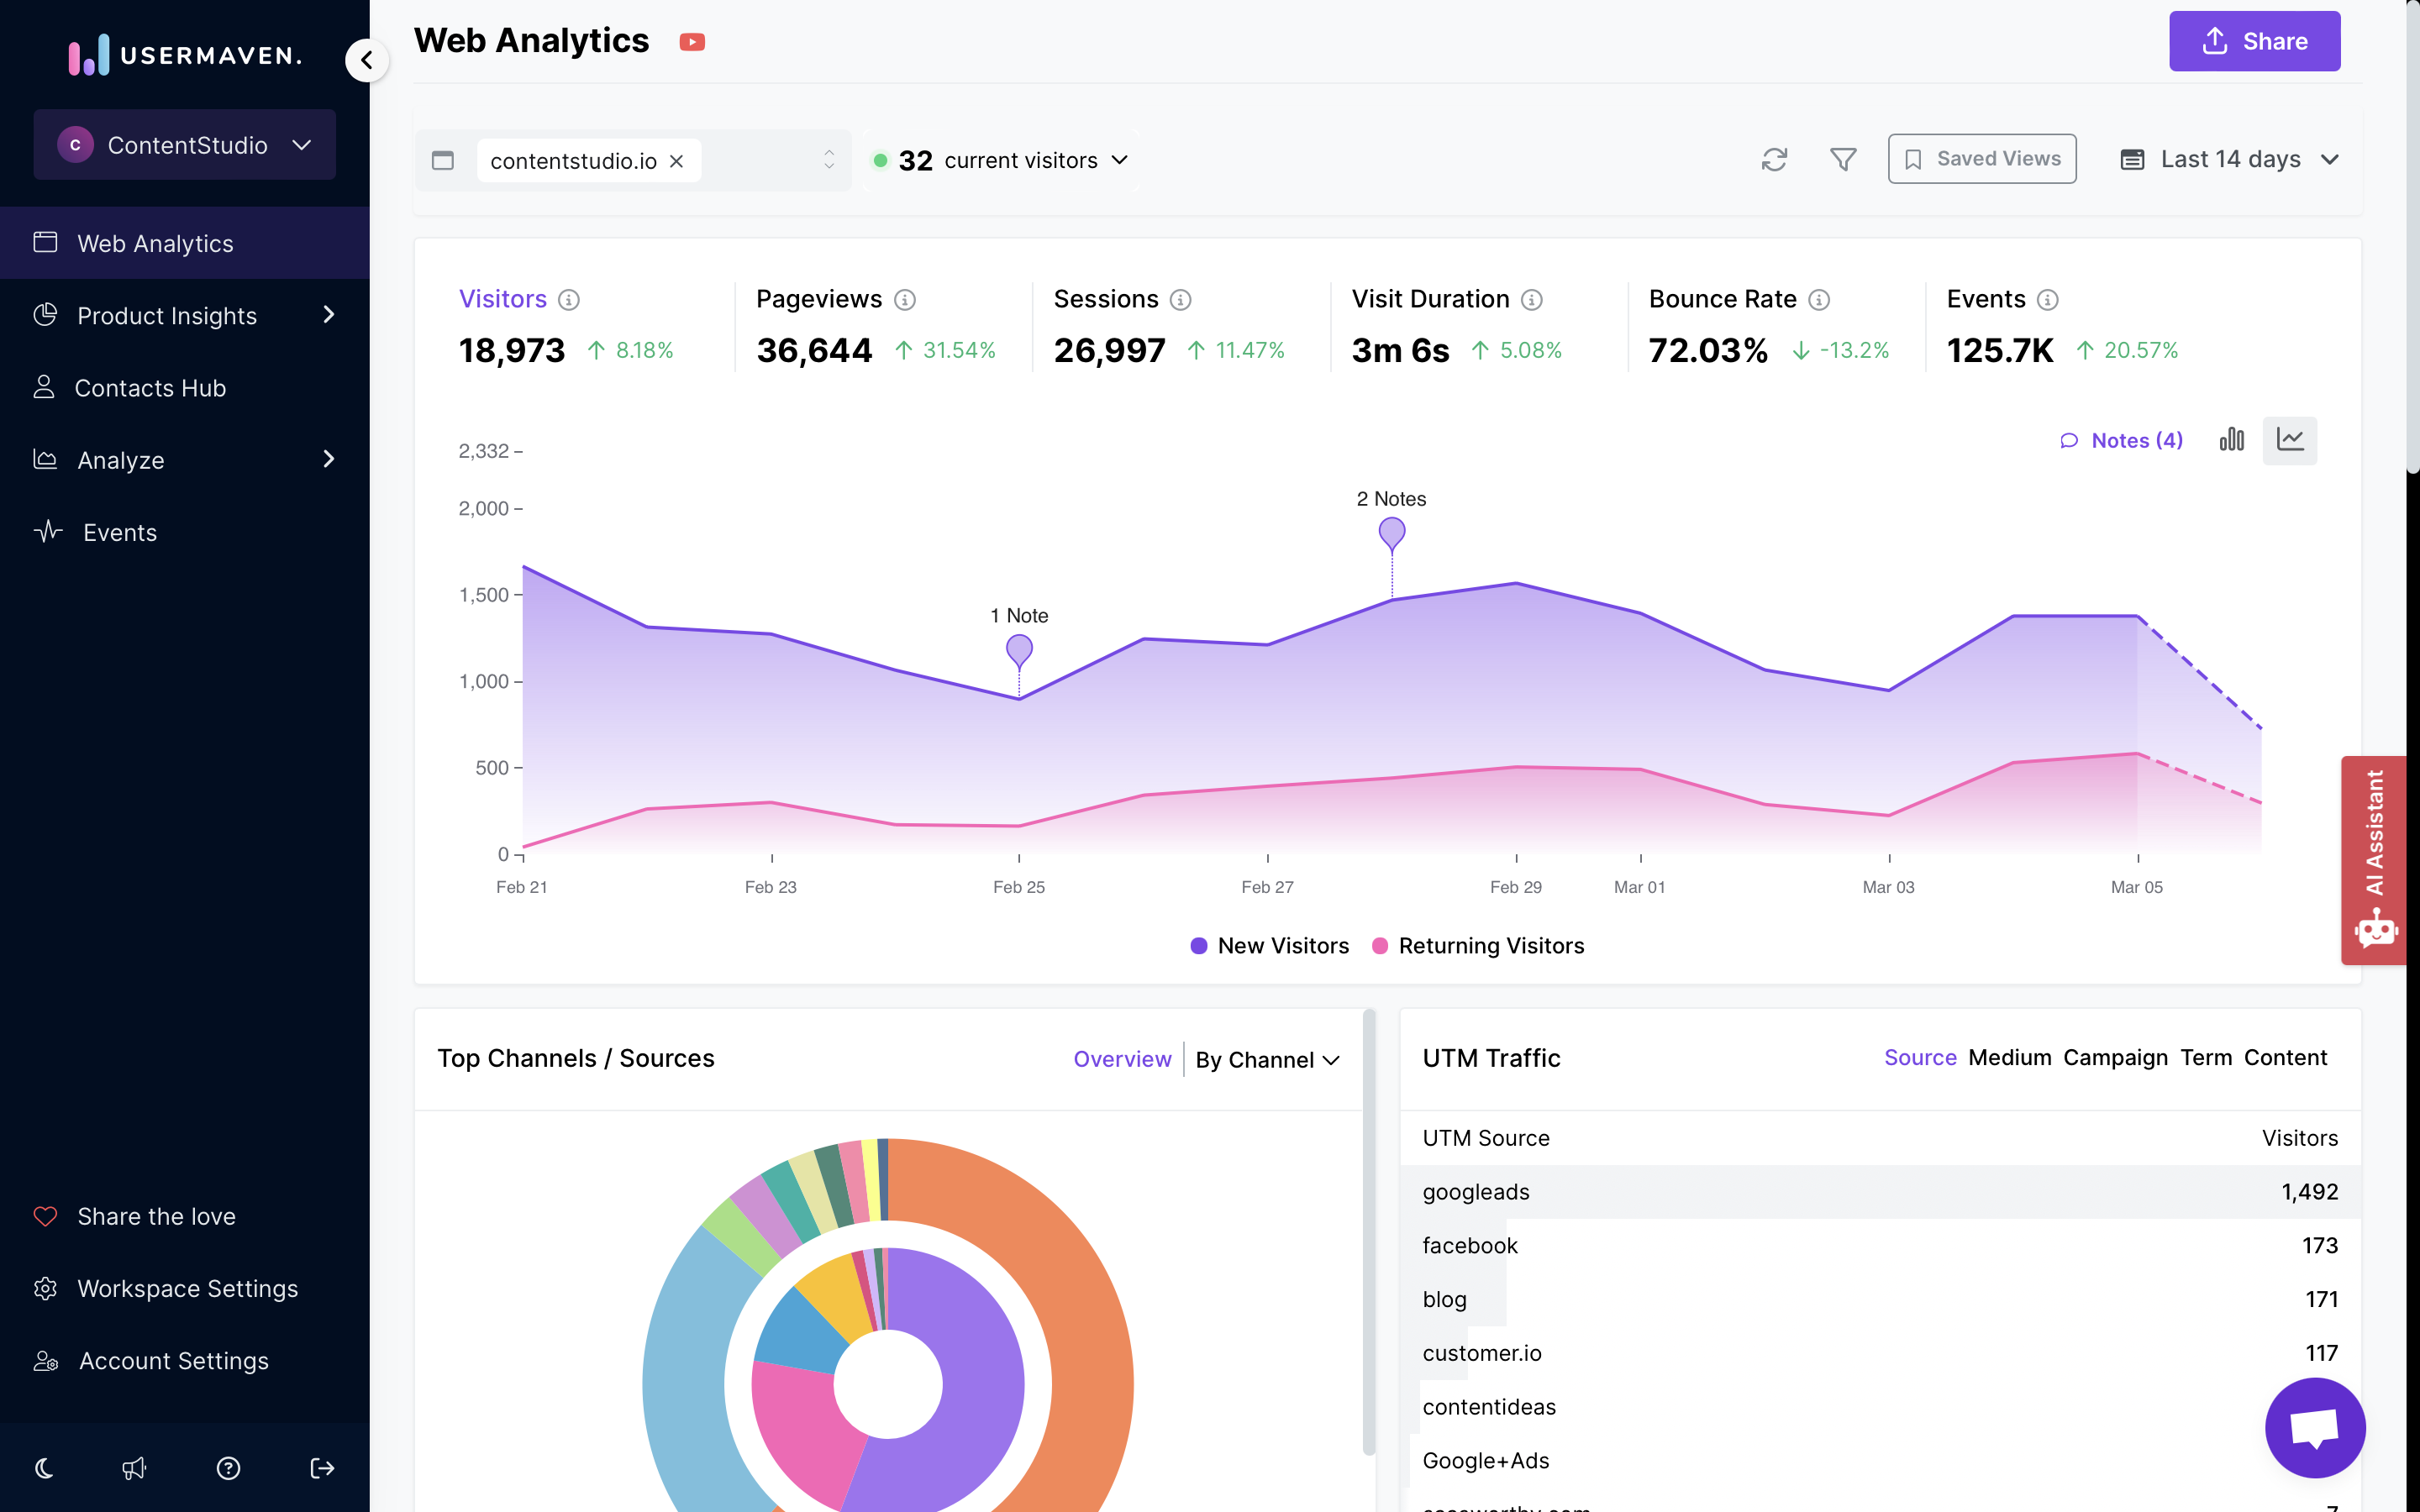
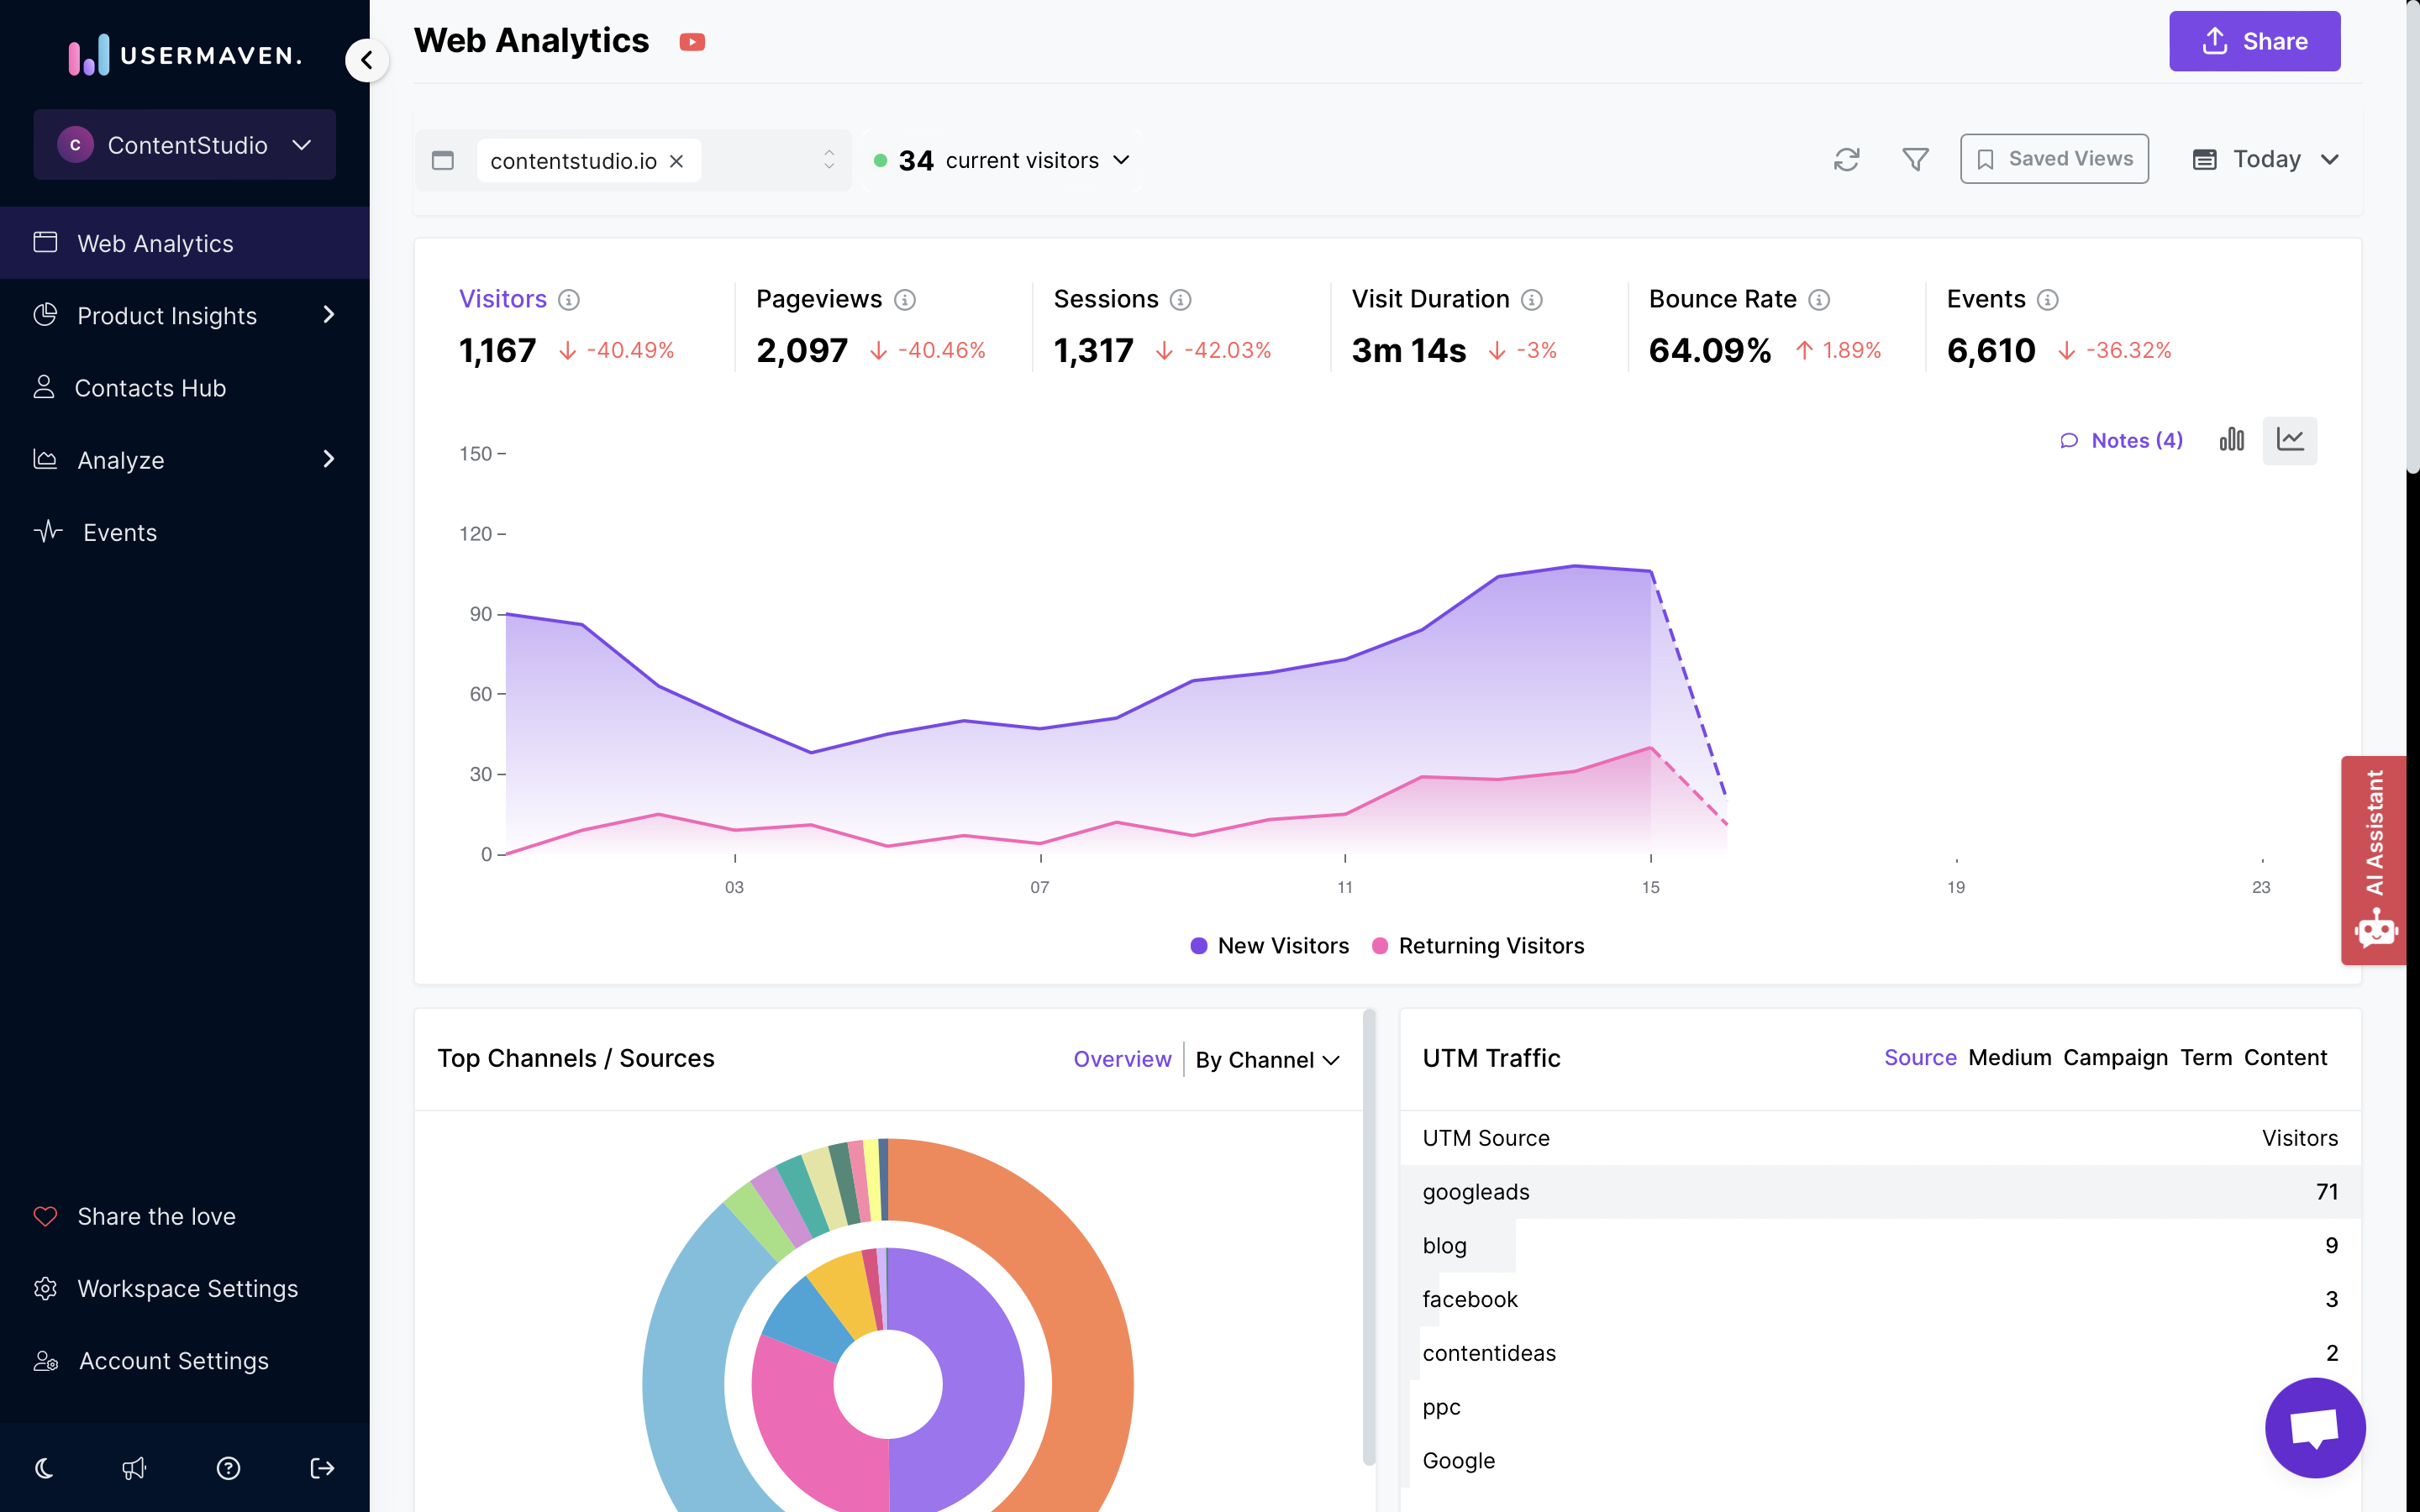
You can easily keep an eye on important website stats on your Usermaven dashboard. This includes monitoring the number of unique visitors, pageviews, sessions, visit duration, bounce rate (which shows the percentage of sessions with just one-page view), and events.
If you want a closer look at any of these stats, just click on the one you're interested in, and you'll see more details on the top graph.
The Notes/Annotations feature allows you to enhance your web analytics graph by directly documenting key observations. Click on any point to add a note, highlighting specific trends or observations. These notes show up next to the relevant point, giving you clear context. You can also choose to keep notes private or share them with others for collaborative analysis. Only Owners, Administrators, and Managers can create and edit notes to keep data reliable.
Moreover, you can customize your analysis by choosing a different time range using the date picker in the top right corner of your dashboard. You can also switch between seeing metrics in a bar graph or a line graph.
Lastly, managing your sites is simple within a workspace. Just click on the menu in the top left corner of your dashboard and pick the site you want to view.
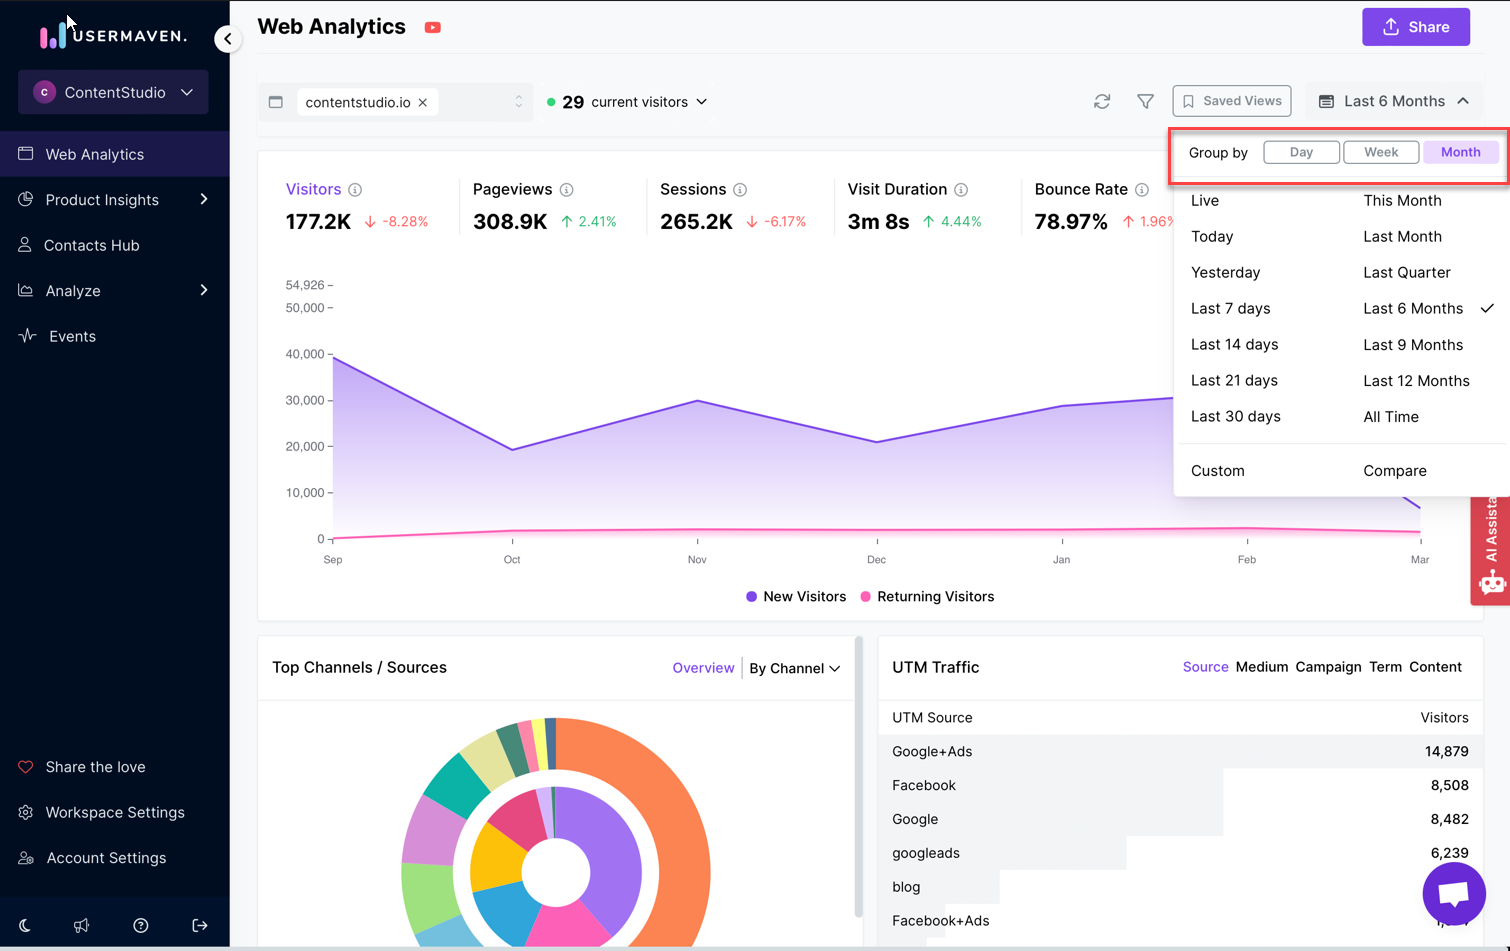
Set a different chart interval
Customizing the chart interval in Usermaven is a flexible feature. It enables you to group the statistics on the chart by a different unit of time, depending on the date range you've chosen. For instance, if you opt for the "Today" date range, you will see the statistics displayed on an hourly basis.
Conversely, when you select "Last 30 days," you can view the stats grouped by day. If you're working with a broader time-frame, such as several months, you have the flexibility to display the statistics by days, weeks, or months, whichever best suits your analysis needs. Usermaven's chart interval customization adapts to your selected date range, allowing you to gain insights at the level of granularity that matters most to you.
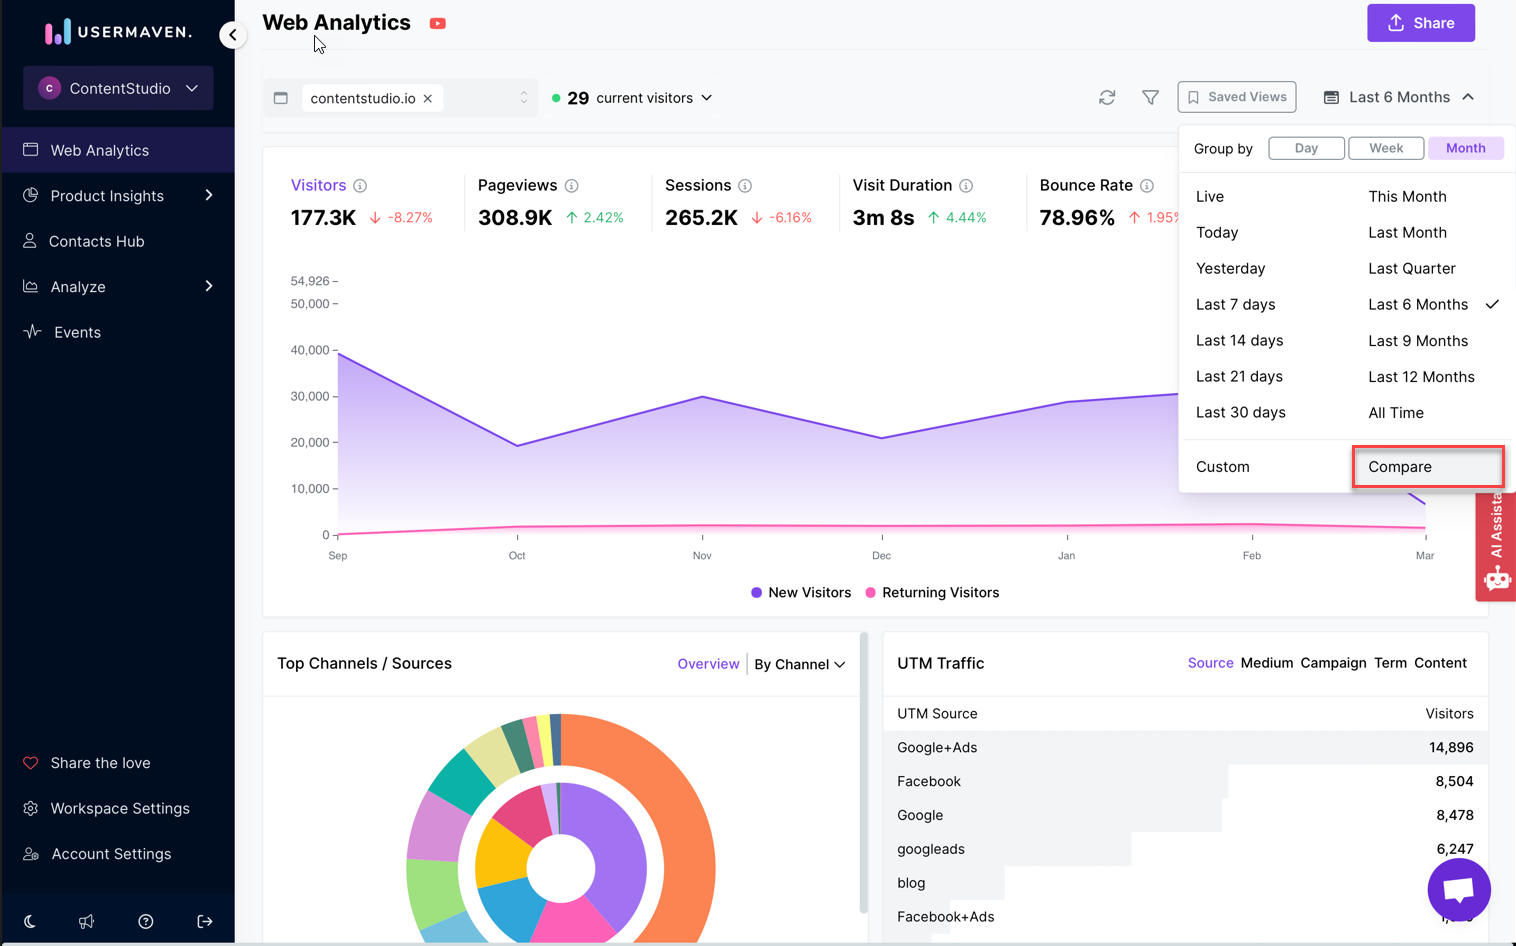
Compare your stats over time
Usermaven provides a robust capability to compare your statistics over time, offering valuable insights into your website's performance trends. Our comparison feature empowers you to analyze statistics for a specific date range and compare them to another period of your choosing. You have the flexibility to select from two comparison options: "Previous period" and "Custom period," both designed to suit your analytical needs. Additionally, for enhanced accuracy, you can match your comparisons by the day of the week, mitigating any variations caused by weekends.
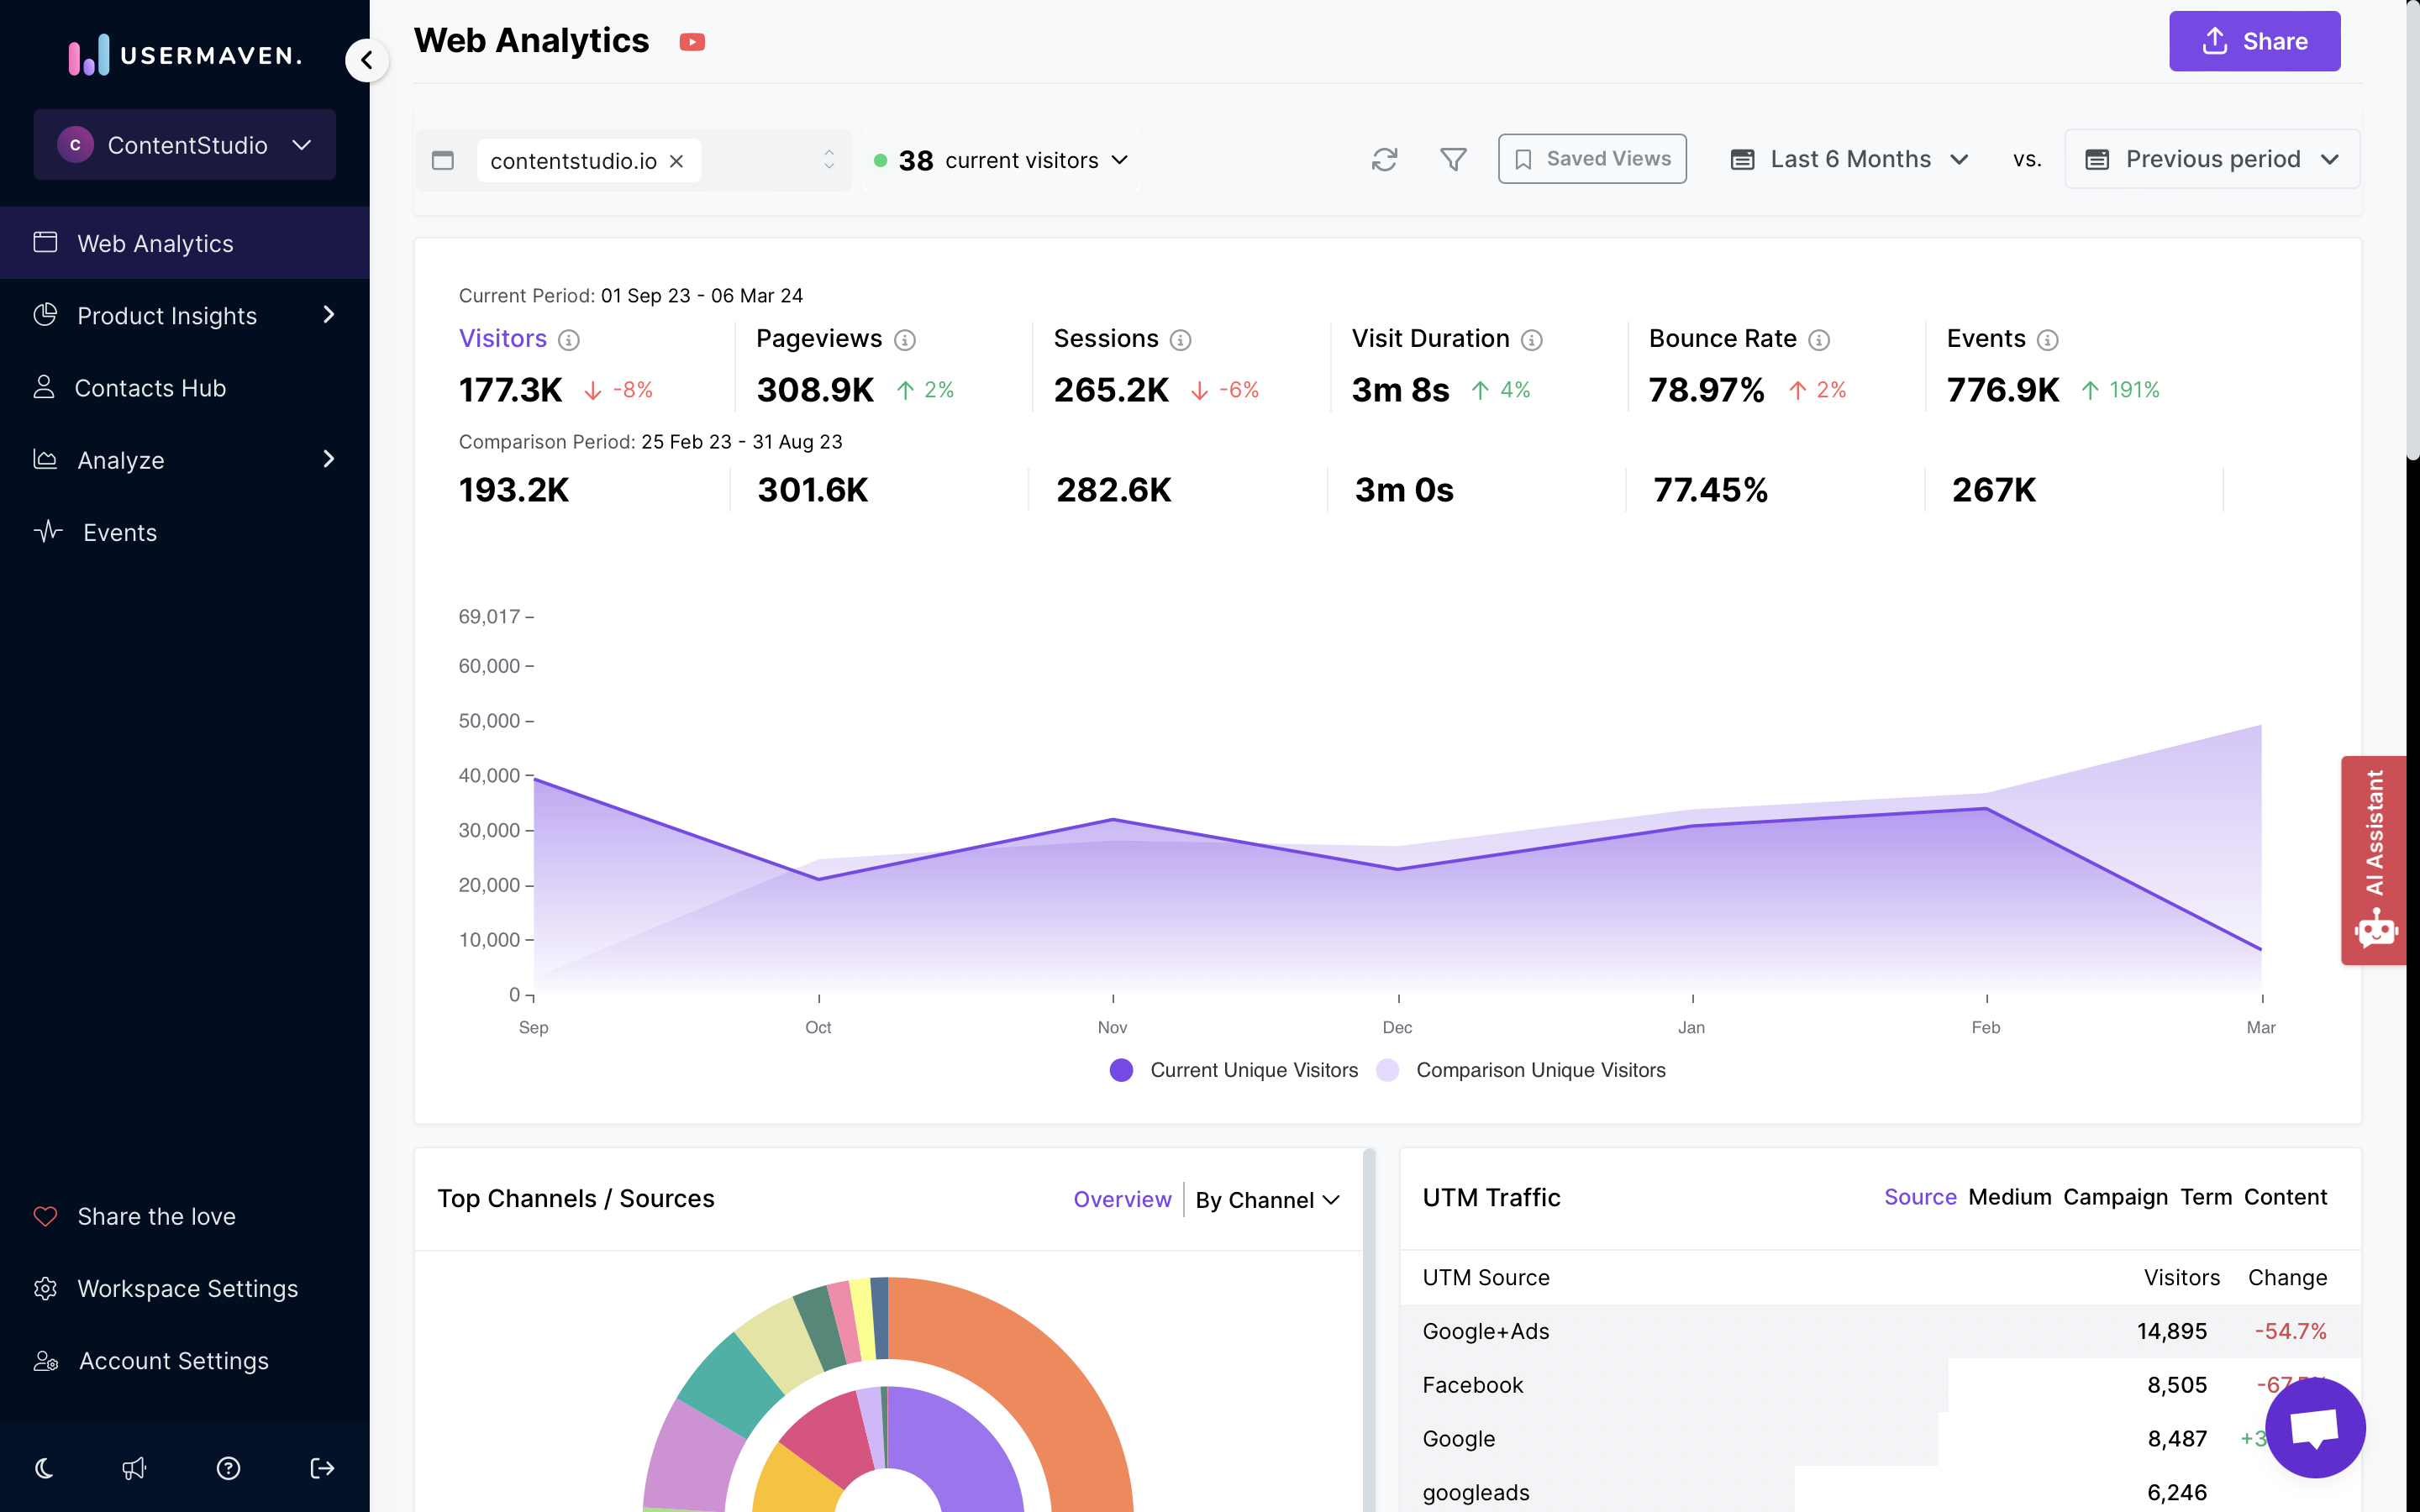 To activate the comparison feature, simply click on "Compare" in the date picker.
Real-time dashboard
Usermaven offers a real-time dashboard that provides you with up-to-the-minute insights into your website's performance. By clicking on the "visitors" metric, you can instantly view the number of individuals who have visited your site within your specified time frame. Notably, Usermaven employs a smart system that remembers visitors. If a visitor leaves your site and returns within 30 minutes, their second visit won't increase the count of unique visitors, ensuring accuracy in tracking.
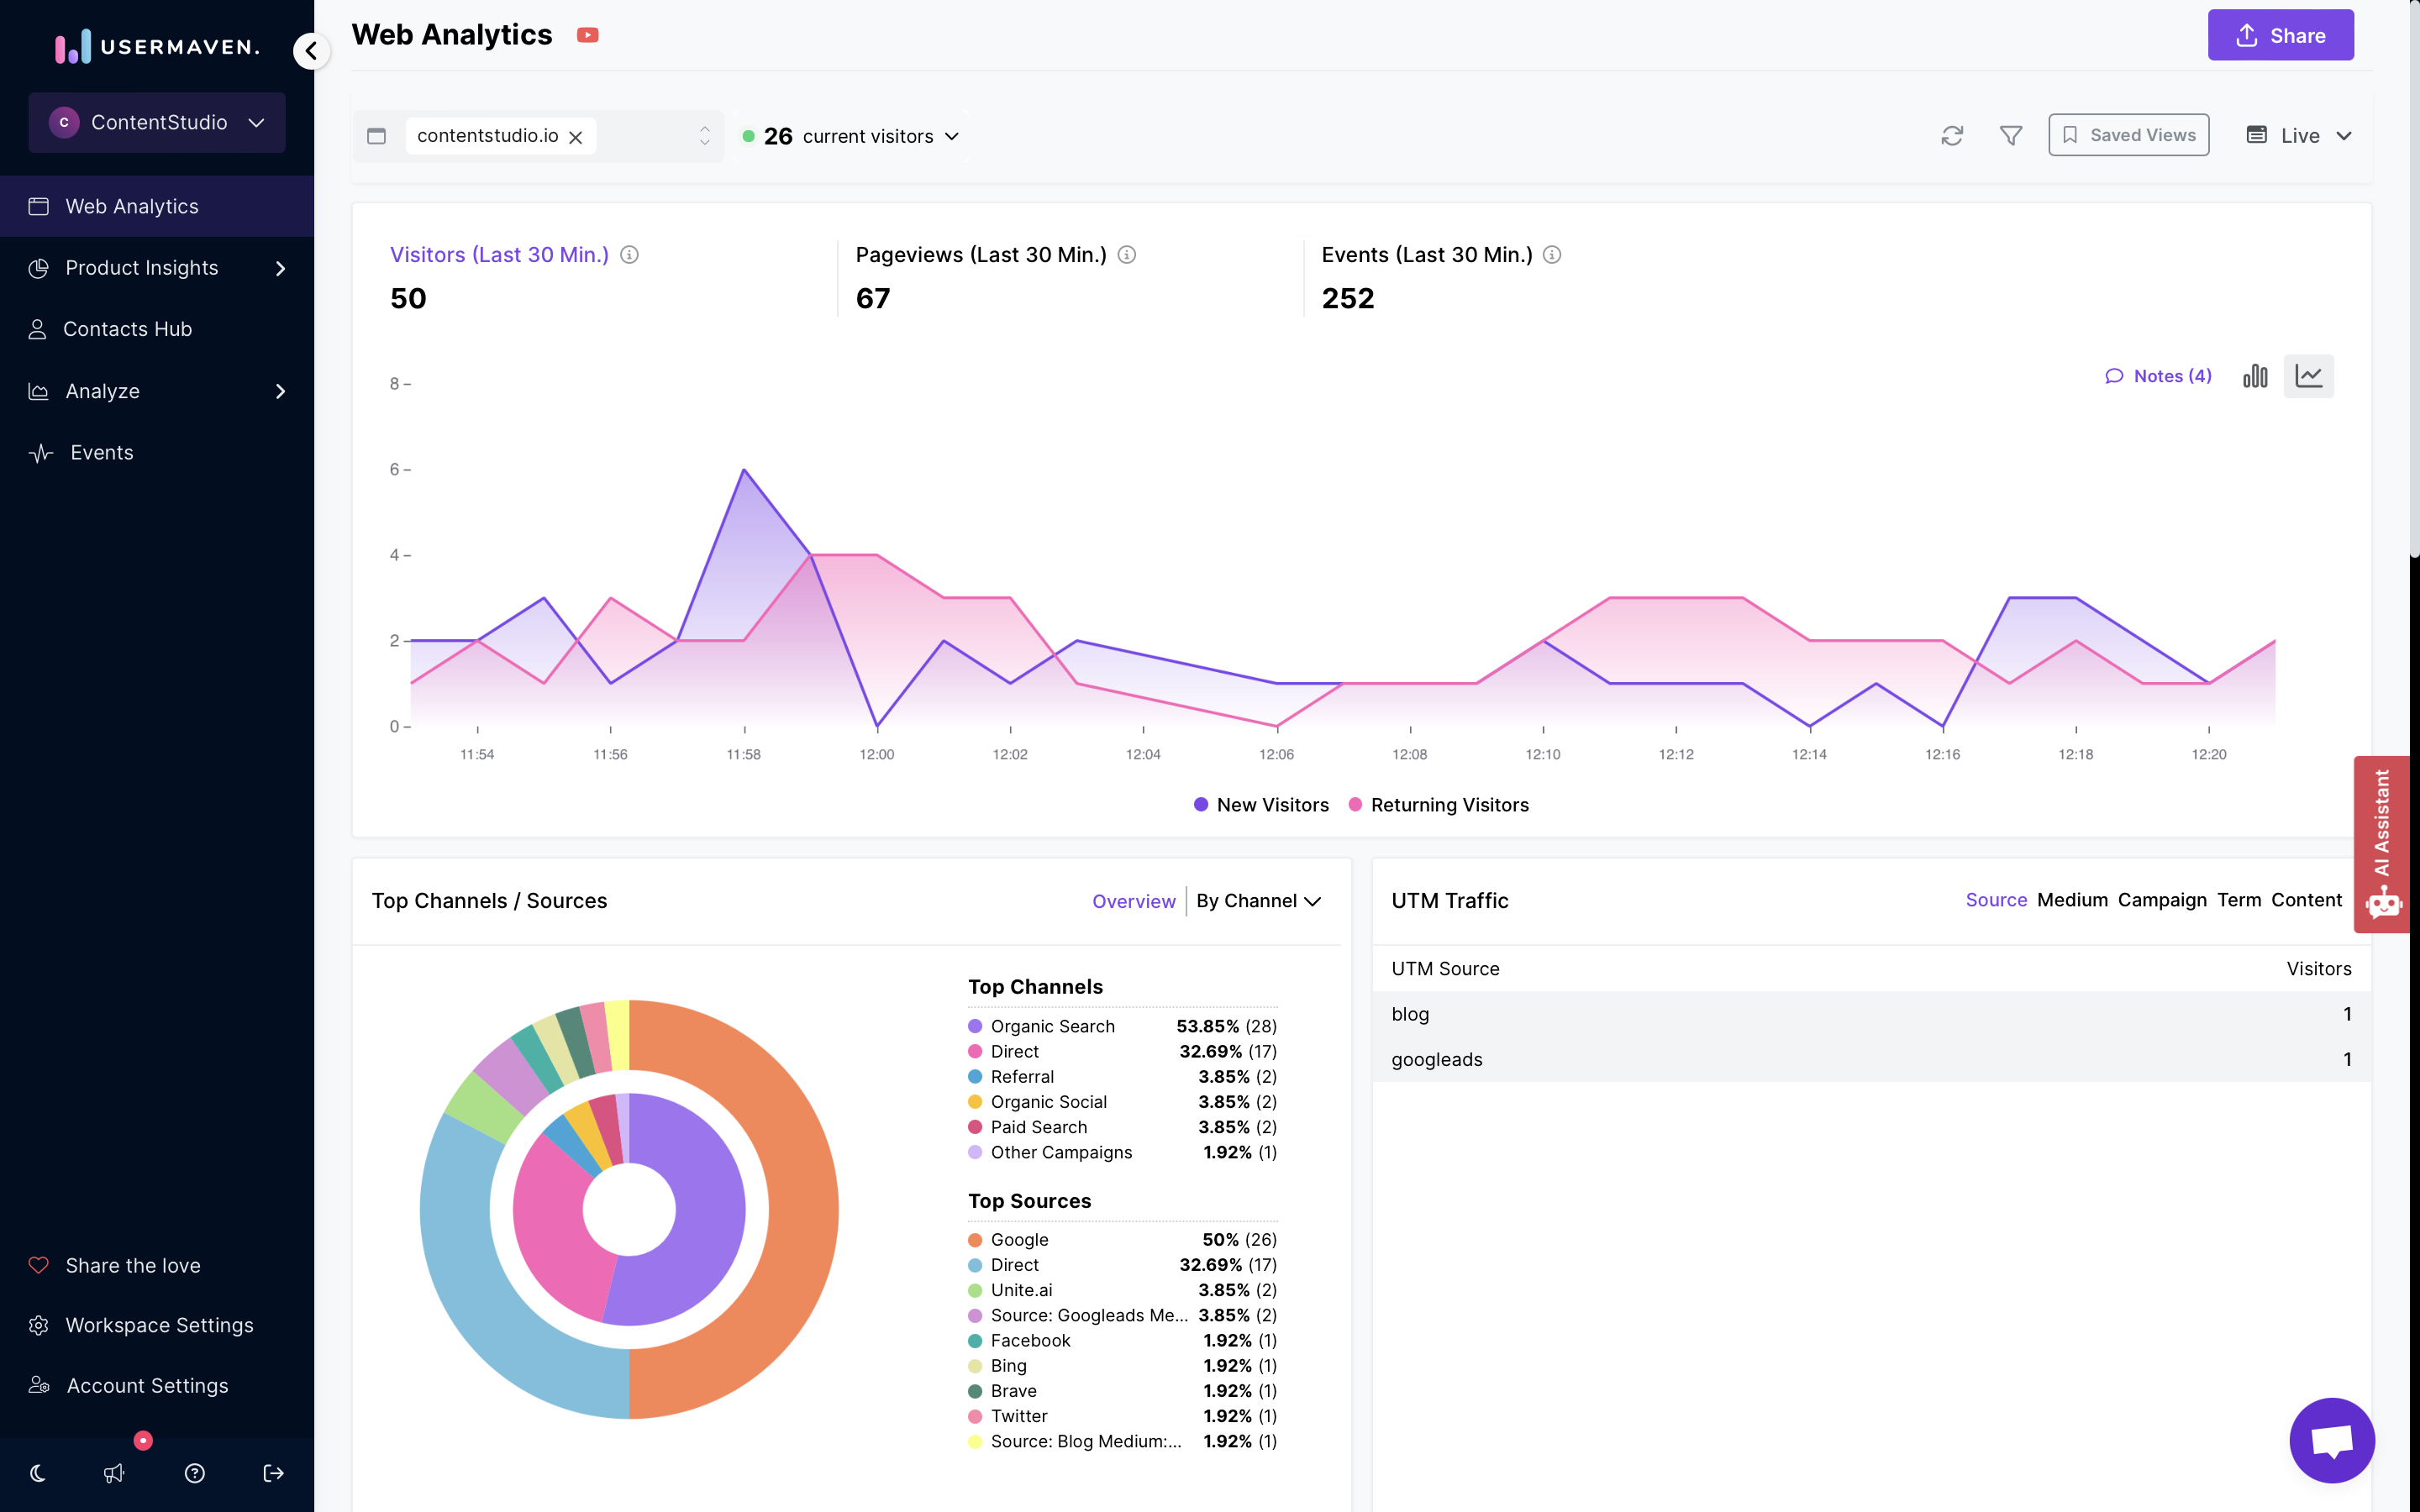
The real-time dashboard also includes a dynamic pageview graph, covering the activity of the past 30 minutes. This graph updates every 30 seconds, eliminating the need for manual refreshes to stay current. Page views are recorded each time a visitor loads a page on your website. Even if a visitor reloads a page, it is counted as an additional page view. Similarly, if a visitor navigates through multiple pages, with some of them being visited more than once, each visit contributes to another page view, allowing for comprehensive monitoring of visitor interactions with your site.
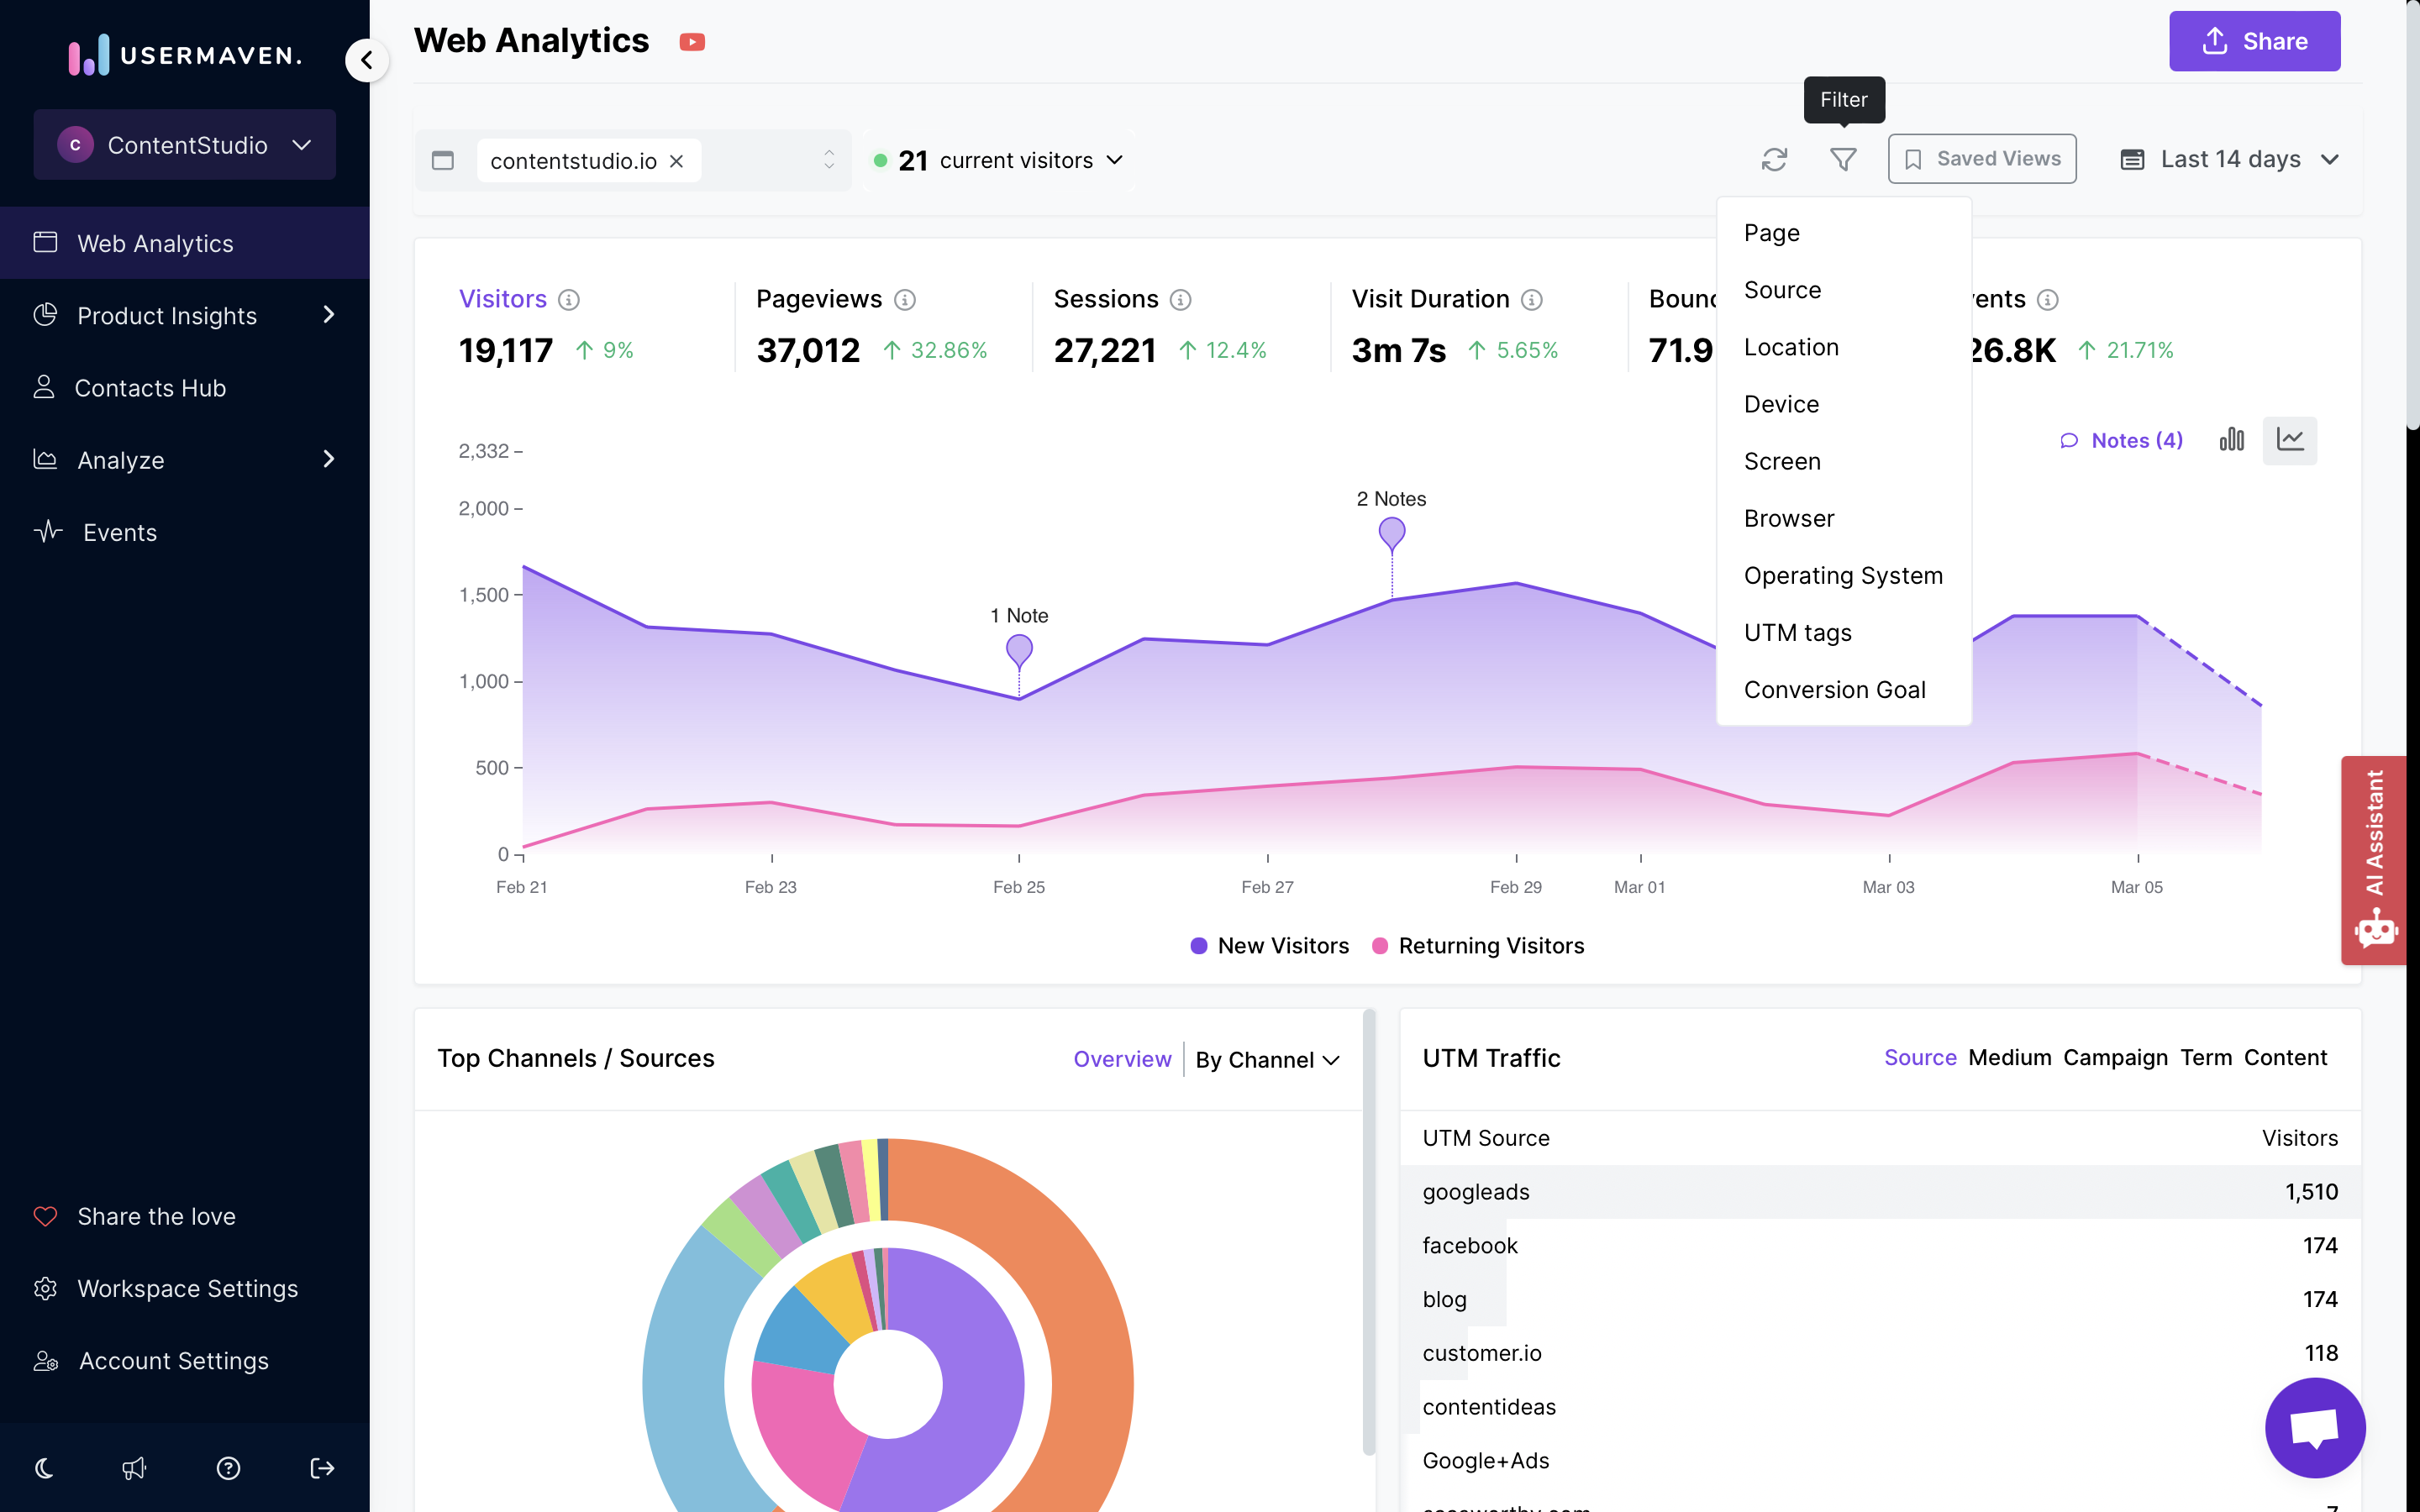
Filtering
You can easily click on any of the metrics displayed in your Usermaven dashboard to instantly filter the entire dashboard by that specific metric. What's more, you have the flexibility to mix and match filters, enabling you to segment your audience effortlessly.
For example, you can drill down to examine traffic originating from a particular marketing campaign directed to a specific landing page over a specified timeframe.
Additionally, Usermaven offers an advanced "Filter" button located at the top of your dashboard, providing extra functionality. With this feature, you can filter the dashboard by multiple criteria simultaneously. Whether you want to analyze data by sources, countries, specific pages, and more, the "Filter" option has you covered. This functionality also allows you to search for any metric, exclude segments of your audience, and group pages as needed, enhancing your ability to gain valuable insights and refine your analysis with precision.
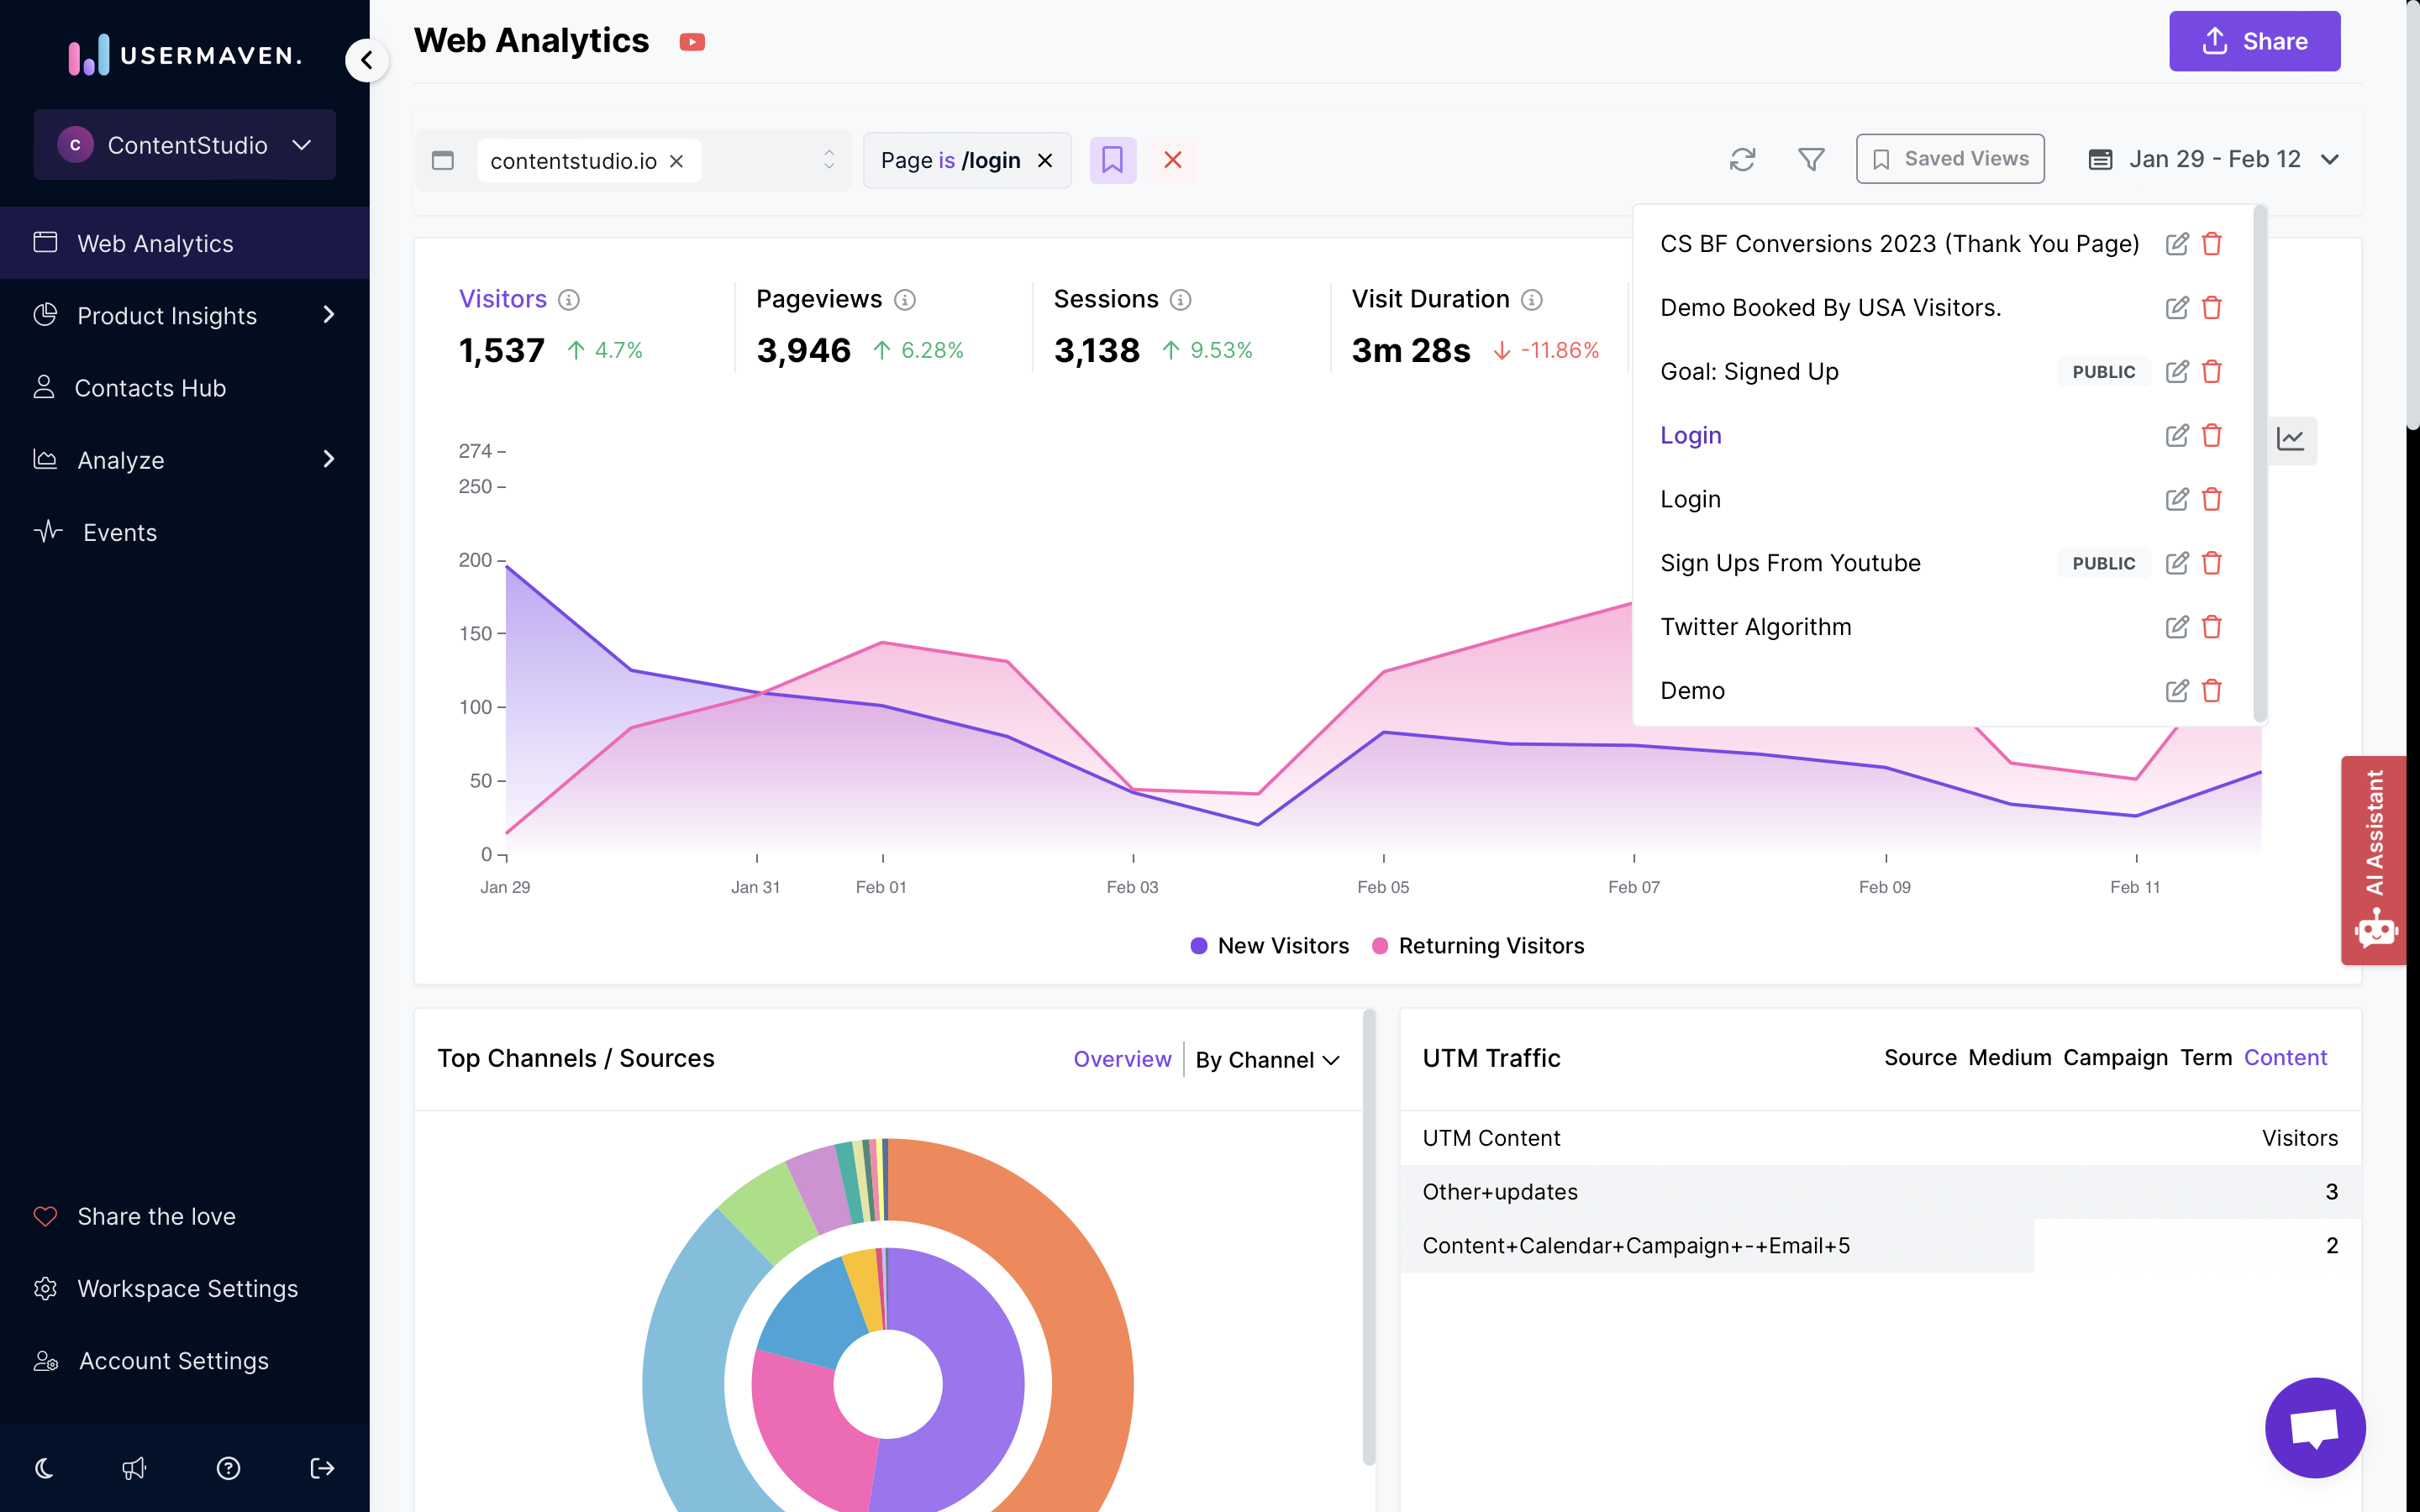
Saved views
In Usermaven, 'Saved Views' offer a convenient way to preserve specific filter settings. If you've tailored filters to your liking and anticipate using them again, simply utilize the 'Saved Views' feature to keep them at your fingertips for future reference.
You can access your saved views by clicking on the "Bookmark icon".
Top Channels/ Sources
The 'Overview' tab in the Top Channels/ Sources section provides a snapshot of the top channels and sources on your platform along with the numbers and percentage of the users coming from each Source or Channel. You'll also find an interactive pie chart that visually represents this data in an easy-to-understand format.
You can quickly discern whether your traffic predominantly comes from Direct Sources, Referrals, Organic Socials, Paid Searches, Organic Socials, Paid Socials, Emails, Display Ads or Other Campaigns.
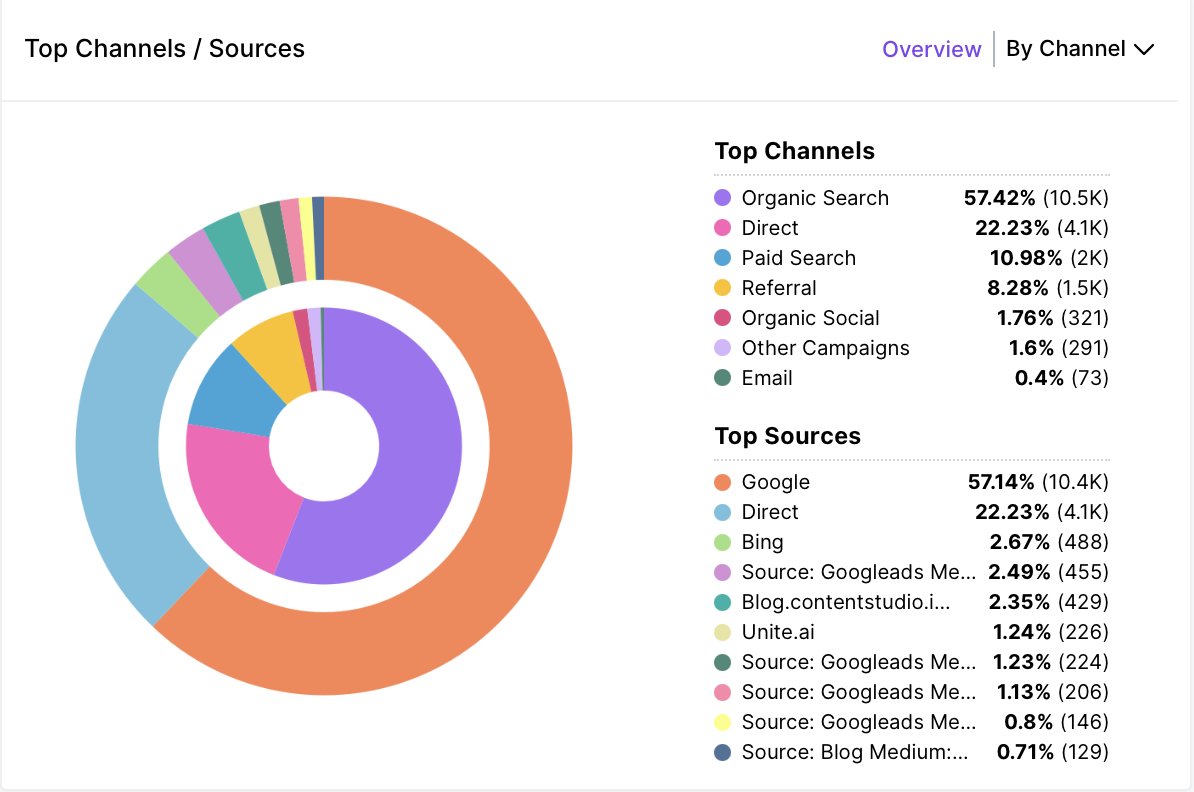
To delve deeper into specific traffic sources, simply click on "By Channels" for a drop-down menu.
For a comprehensive list of all traffic sources, just click on 'Detailed View'. Additionally, from this view, you have the option to export the list for your convenience.
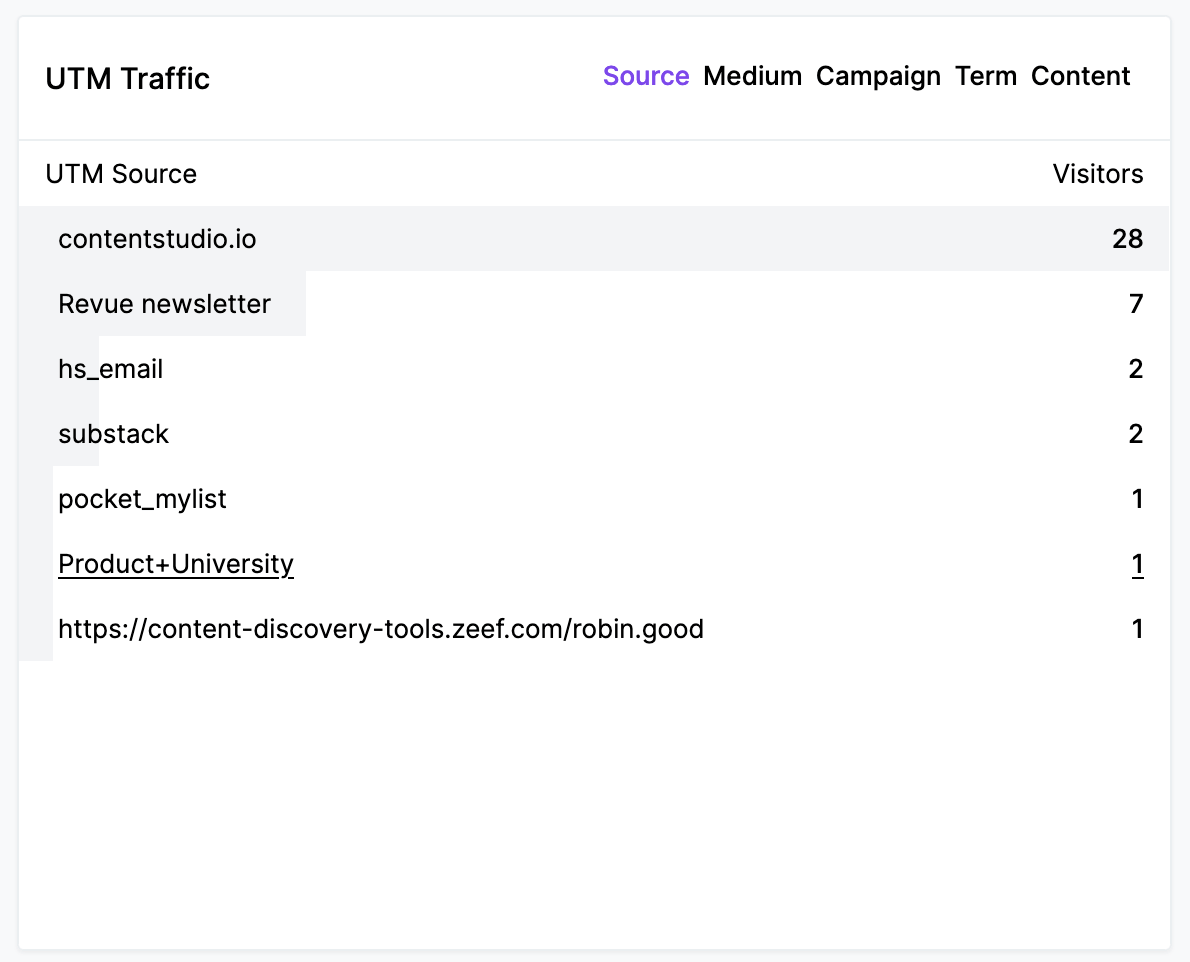
UTM Traffic
This section specifically focuses on visitors arriving via UTM tagged links, commonly found in emails, social media, or your paid advertising campaigns. You can delve deeper by clicking on "Medium," "Source," "Campaign," "Term," and "Content" to explore and analyze these campaign-driven traffic sources. Usermaven provides the tools you need to gain insights into the performance of your UTM-tagged links and understand how they contribute to your website's traffic.
Top Pages
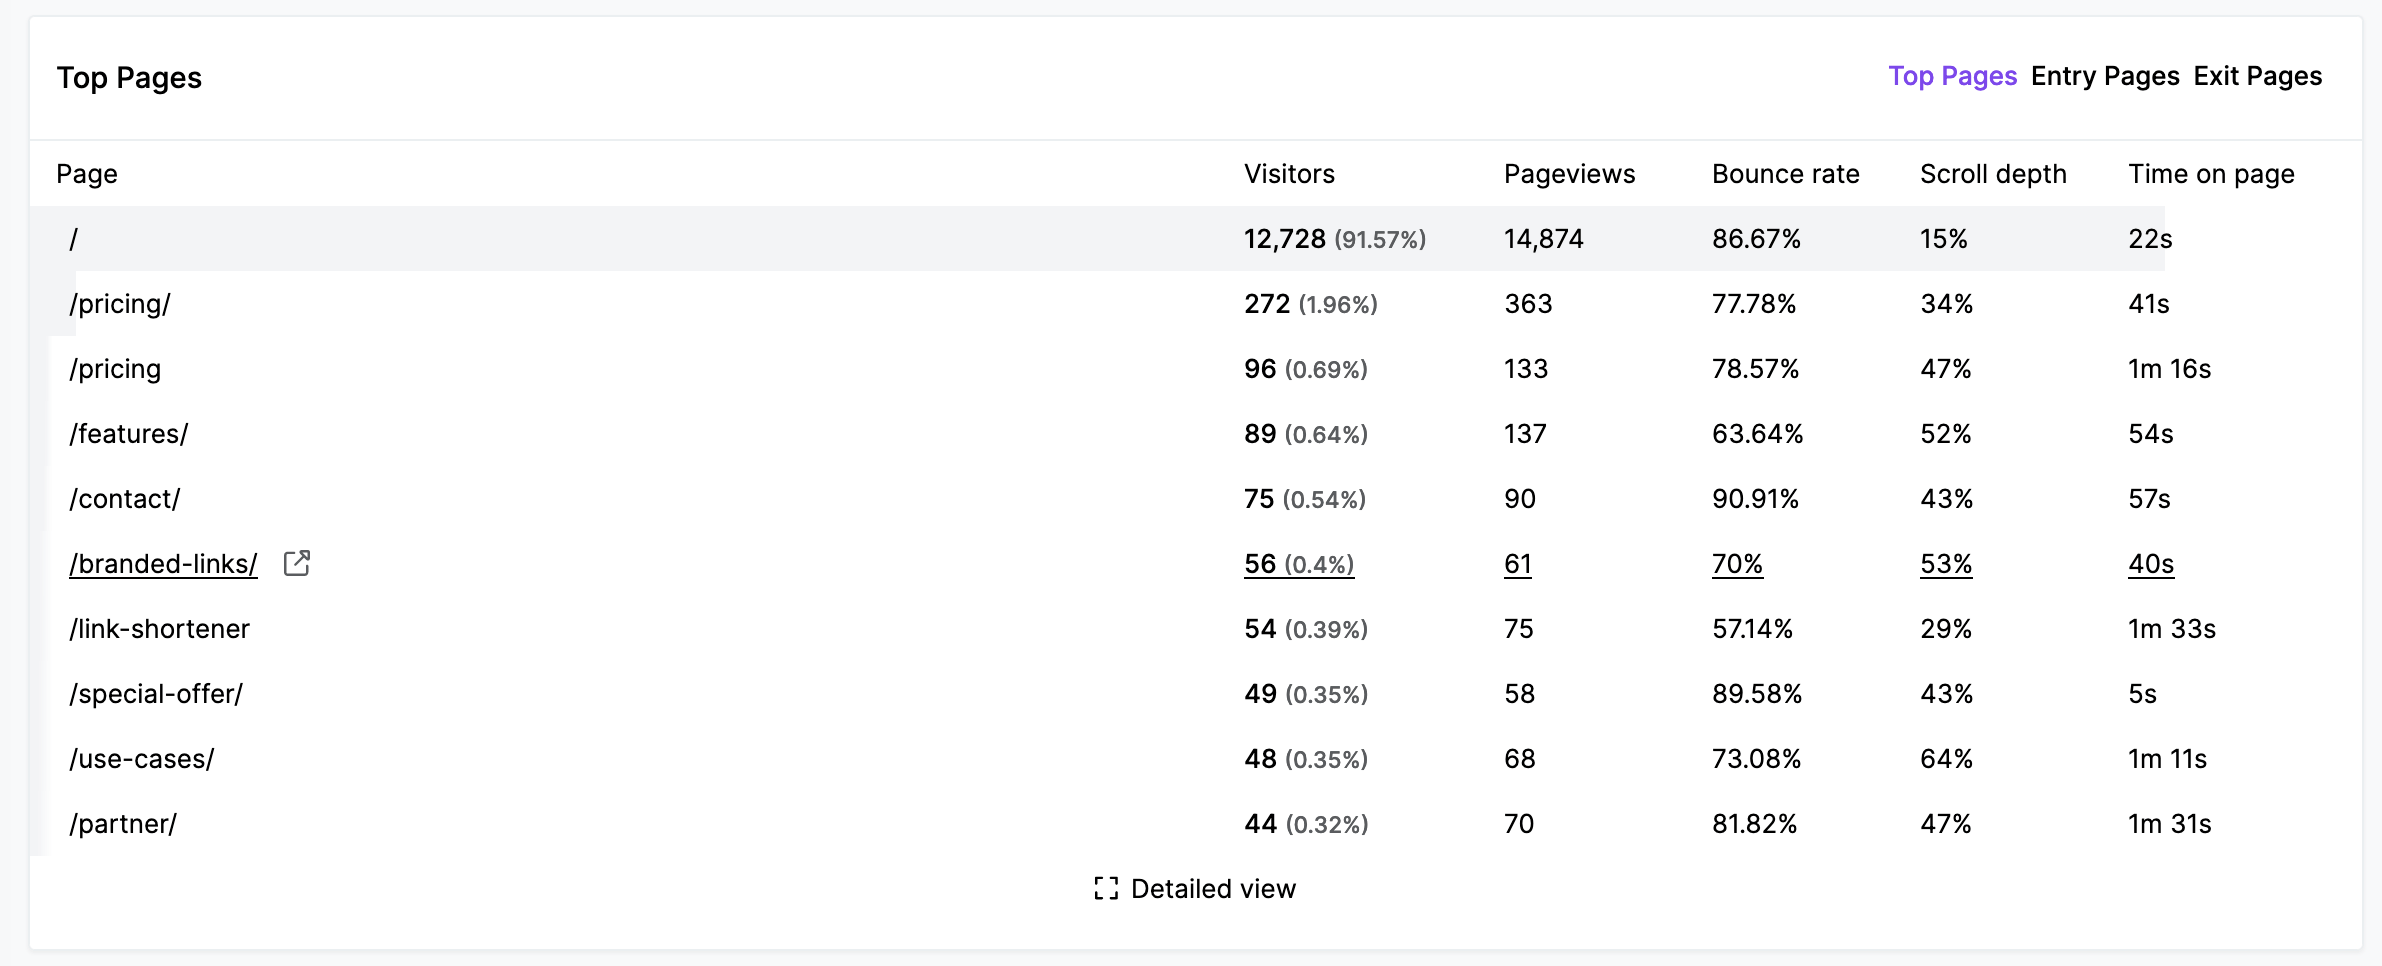
Usermaven provides a comprehensive overview of your most visited pages on your site, ranked by the number of unique visitors. For a deeper analysis, simply click on the "Detailed View" button to access the full list, complete with additional metrics. These metrics include the number of pageviews, bounce rate, and the time visitors spend on each individual page, giving you valuable insights into page performance.
The Top Pages tab also allows you to gain insights into how visitors navigate your site through the "Entry pages" and "Exit pages" sections. By clicking on these buttons, you can access a full list of entry and exit pages along with additional metrics.
For "Entry pages," the details include visit duration for visits that originated from a specific page, helping you understand user engagement. In the case of "Exit pages," the details include the exit rate percentage, shedding light on the pages where visitors are leaving your site. These insights enable you to optimize user flow and enhance the overall user experience on your website.
Conversion goals
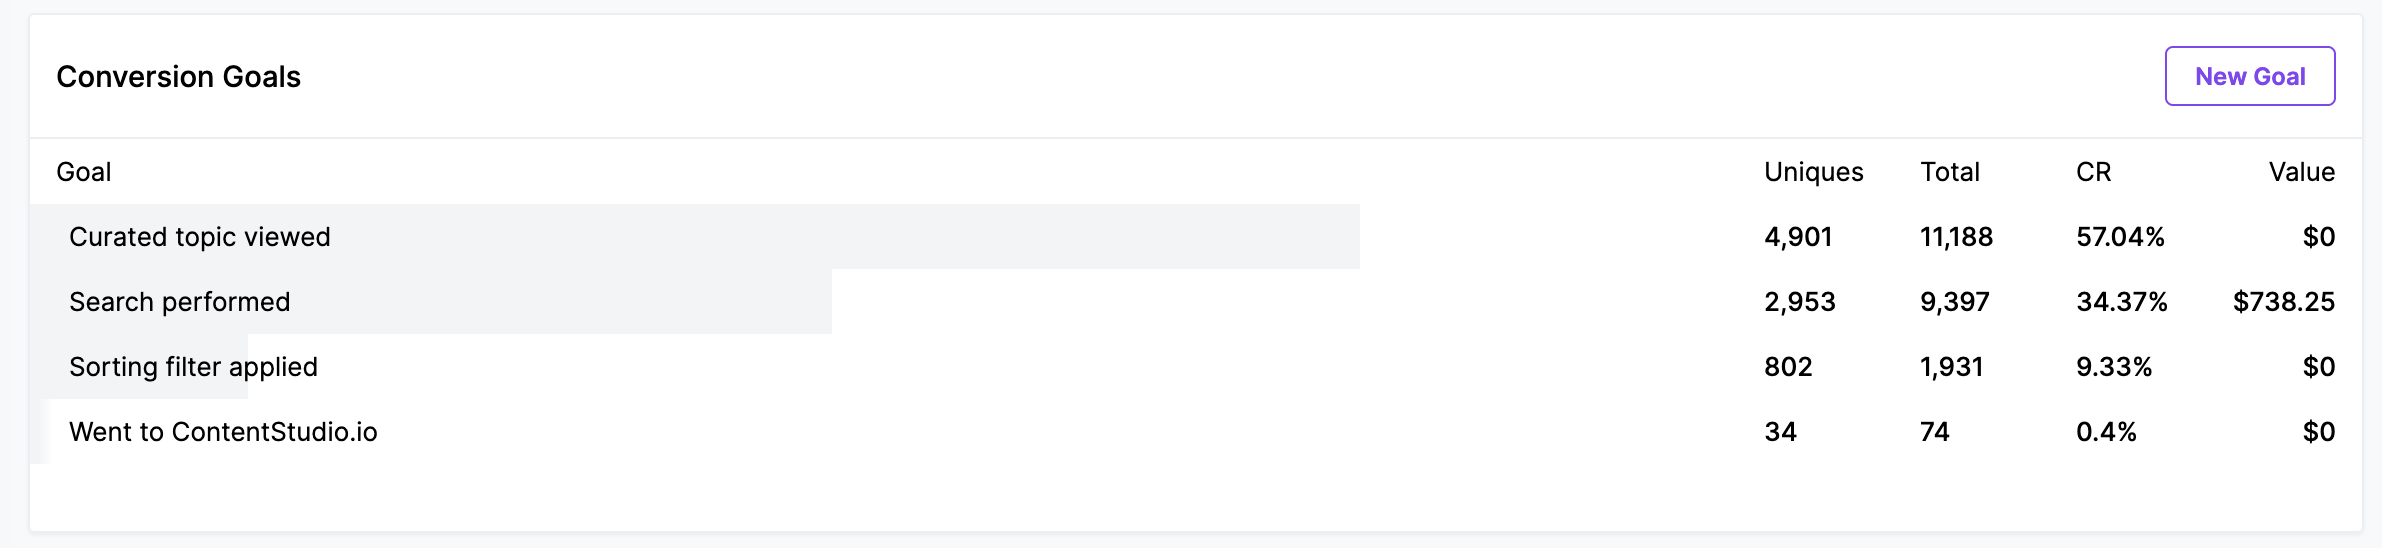
Usermaven offers robust event and goal tracking capabilities to help you identify and measure the success of your website's conversions. With Usermaven, you can easily track:
- Unique Converted Visitors: Determine the number of unique visitors who have successfully completed your defined conversion actions.
- Total Conversions: Keep track of the overall number of conversions that have taken place on your site.
- Conversion Rate: Calculate the percentage of visitors who have converted, providing valuable insights into your website's effectiveness in achieving goals.
- Conversion Value: When setting up a goal, you have the option to define a conversion value. As conversions occur, this value will be used to calculate your overall conversion worth.
- Referral Sites: Identify the referral sources that send traffic that converts at the highest rate.
Top devices
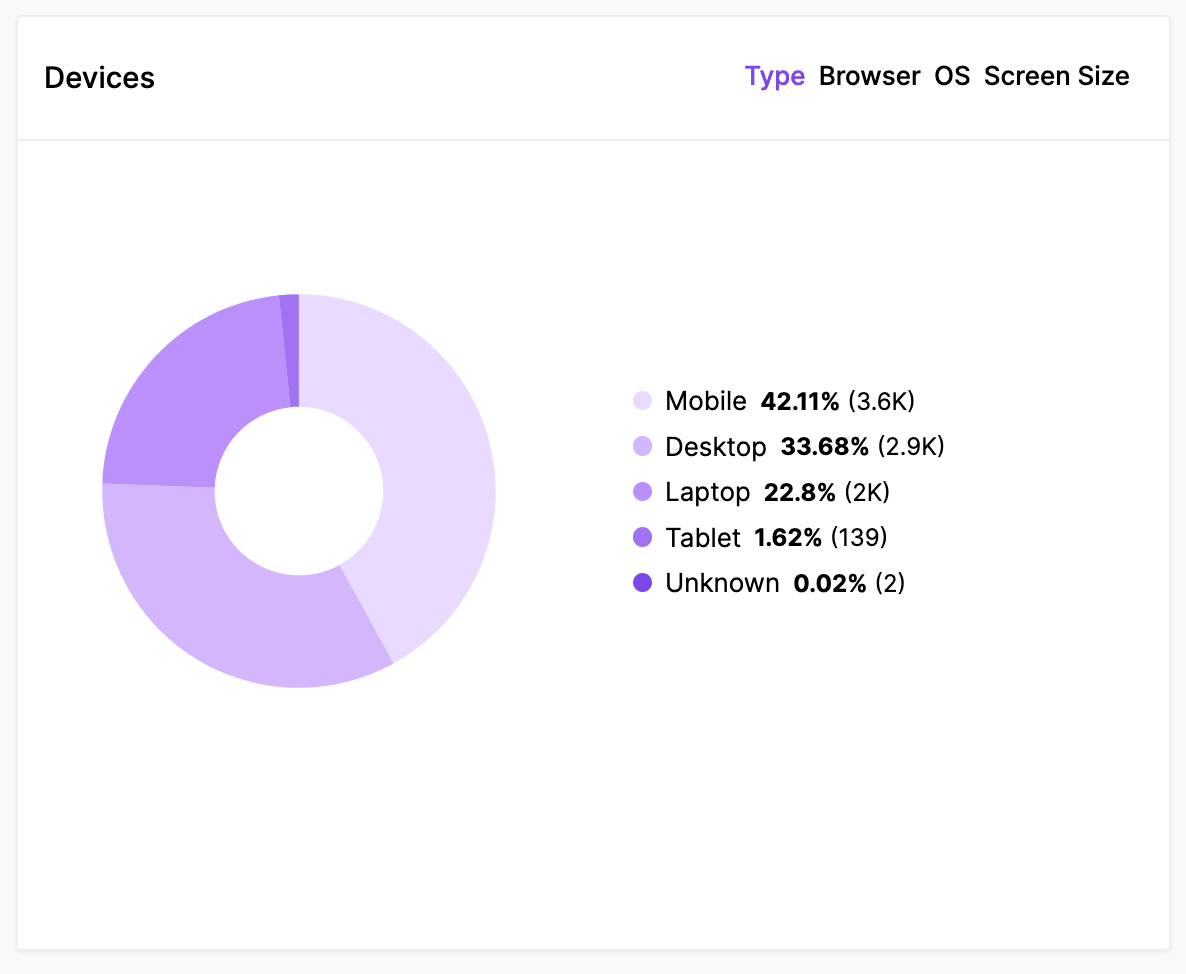
Usermaven also equips you with insights into the devices, browsers, and operating systems your website visitors are using. You can readily view this information to understand your audience's technology preferences. For more detailed analysis, simply click on individual browsers or operating systems to drill down further and access browser versions and OS versions. This in-depth data helps you tailor your website's compatibility and optimize the user experience for various device and browser configurations.
Top locations
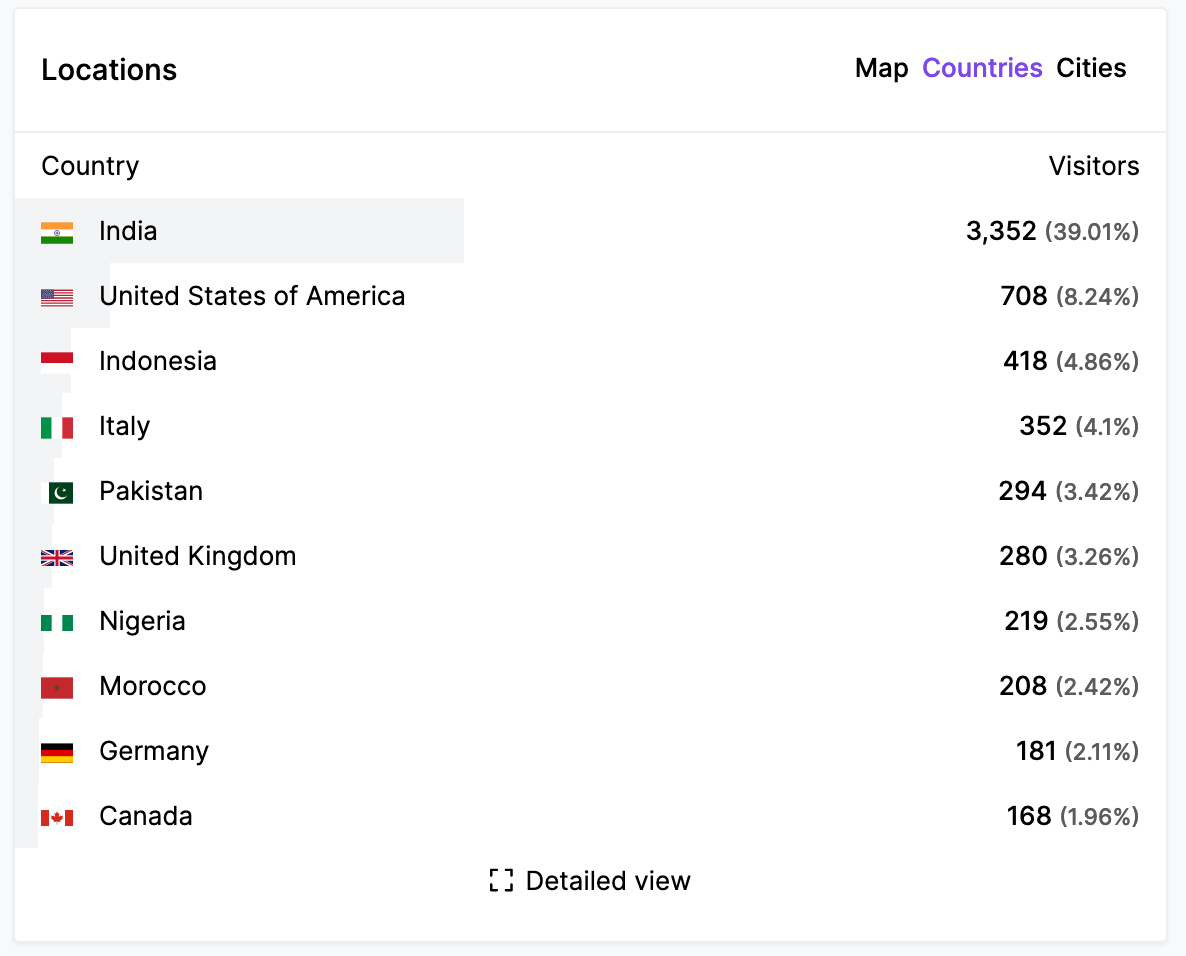
Users get detailed geographic insights into your website's traffic sources. You can access a list of countries, regions, and cities from which your traffic originates. To explore this data further, simply click on the "Counties" or “Cities” button to access the complete list, ranked by the number of visitors. This information allows you to understand the geographical distribution of your audience and tailor your strategies to target specific regions or cities more effectively.
Search keywords
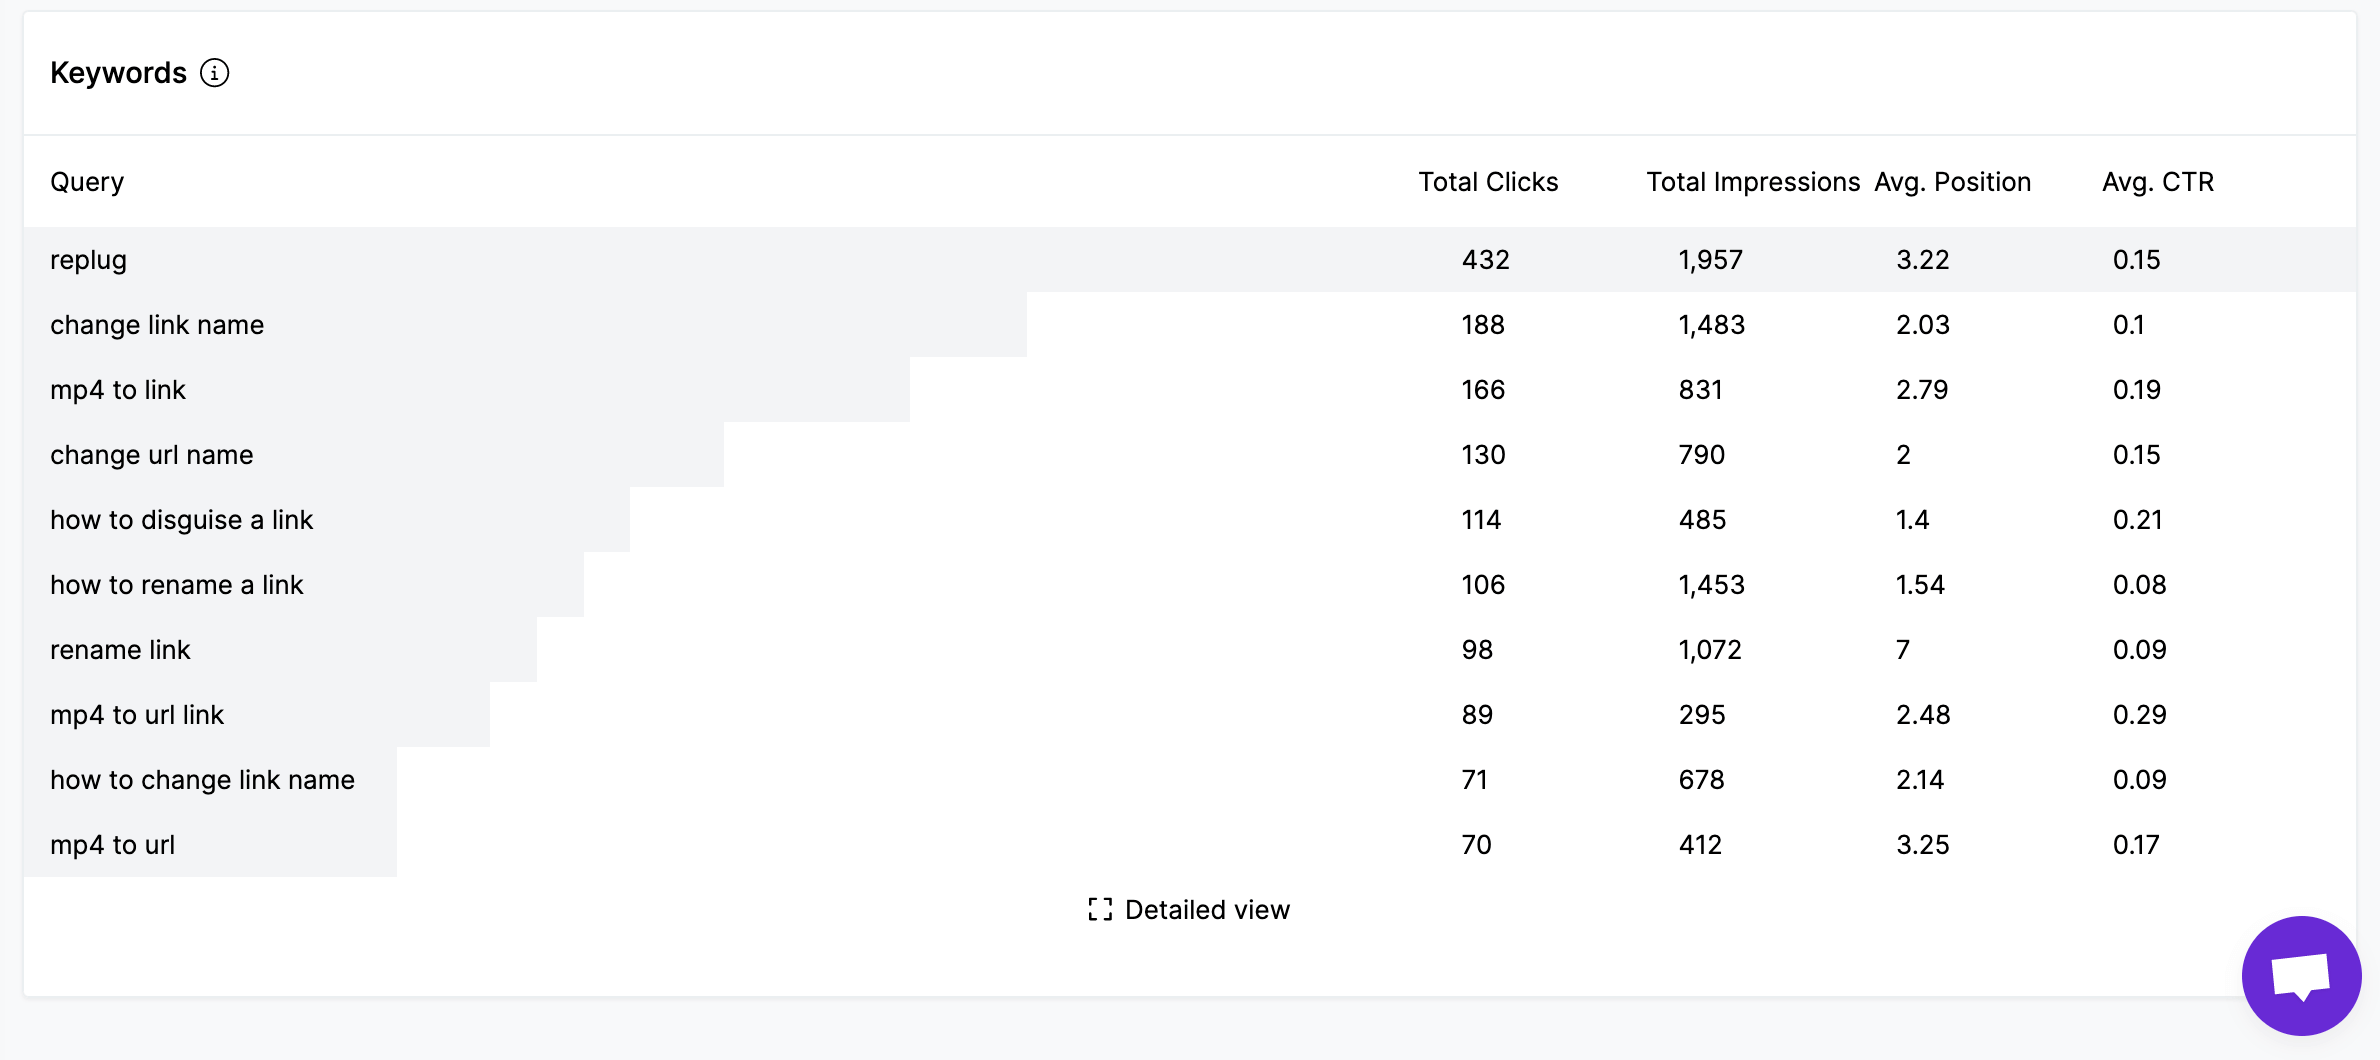
Usermaven goes a step further by providing users with detailed information about the specific Google search keywords that visitors use to find your website. This feature allows you to gain valuable insights into the search terms that lead users to your site, enabling you to better understand the behavior and interests of your audience.
To get the search keywords appear in the Usermaven Website Analytics dashboard, you will need to connect Google Search Console account in Usermaven.
Maven AI: AI Assistant
Introducing Maven AI, an innovative concept that's as straightforward as it gets. If you have a query about your data in Usermaven, all you have to do is ask it — using everyday language.
Sample queries you can pose to Maven AI:
- "What was the total traffic to our website last month?"
- "Which webpage has the highest bounce rate this week?"
- "What are the top three sources of referral traffic?"
- "What is the average session duration for users from social media?"
- "How many unique visitors did we have last quarter?"
- "Which is the most visited page on our website?"
- "What is the conversion rate for our latest marketing campaign?"
- "How many returning users did we have last week versus this week?"
- "From which country do we receive the most traffic?"