How to find power users of the product or specific features?
In the world of user analytics, the true champions are your ‘Power Users’ – those dedicated individuals who not only engage with your product but also become its most ardent advocates. Discovering and nurturing these power users is a pivotal milestone for any business, and this is precisely where Usermaven excels. Let’s delve into how Usermaven can assist you in identifying and cultivating your power users for sustained growth and success.
What is a power user?
Power Users represent the lifeblood of your product’s success. They are the driving force behind the success of many companies, whether they’re fervent shoppers in e-commerce marketplaces, frequent riders on ridesharing platforms, or influential figures in social networks. Every company aspires to attract and retain more power users, but the first step is to effectively measure and understand their engagement.
These individuals are the most active users of your product are unique in several ways:
- Value-Driven Adoption: Power users don’t demand perfection; they grasp your product’s value proposition right from the start. Their minimal need for guidance makes them early adopters, ready to harness your platform’s potential.
- Loyal and Persistent: They don’t just visit once and vanish; power users are consistent visitors. Your product offers something they can’t find elsewhere, keeping them engaged and coming back for more.
- Champions of Your Brand: Engaged and satisfied, power users become your best advocates. They readily share their positive experiences with peers, recommending Usermaven to anyone in search of valuable insights.
In essence, while DAU/MAU provides a singular metric, the Power User Curve empowers entrepreneurs with diverse analytical avenues to evaluate their product’s engagement, focusing on their most devoted users.
The power user curve
A Power User Curve, also known as the activity histogram or “L30” (coined by the Facebook growth team), is a more comprehensive and nuanced approach to gauge user engagement. This curve represents users’ engagement by counting the total number of days they were active in a month, ranging from 1 day to every day of the month. Moreover, it can be customized to track any specific user action crucial for your product.
The Power User Smile Curve: A Grin of Success
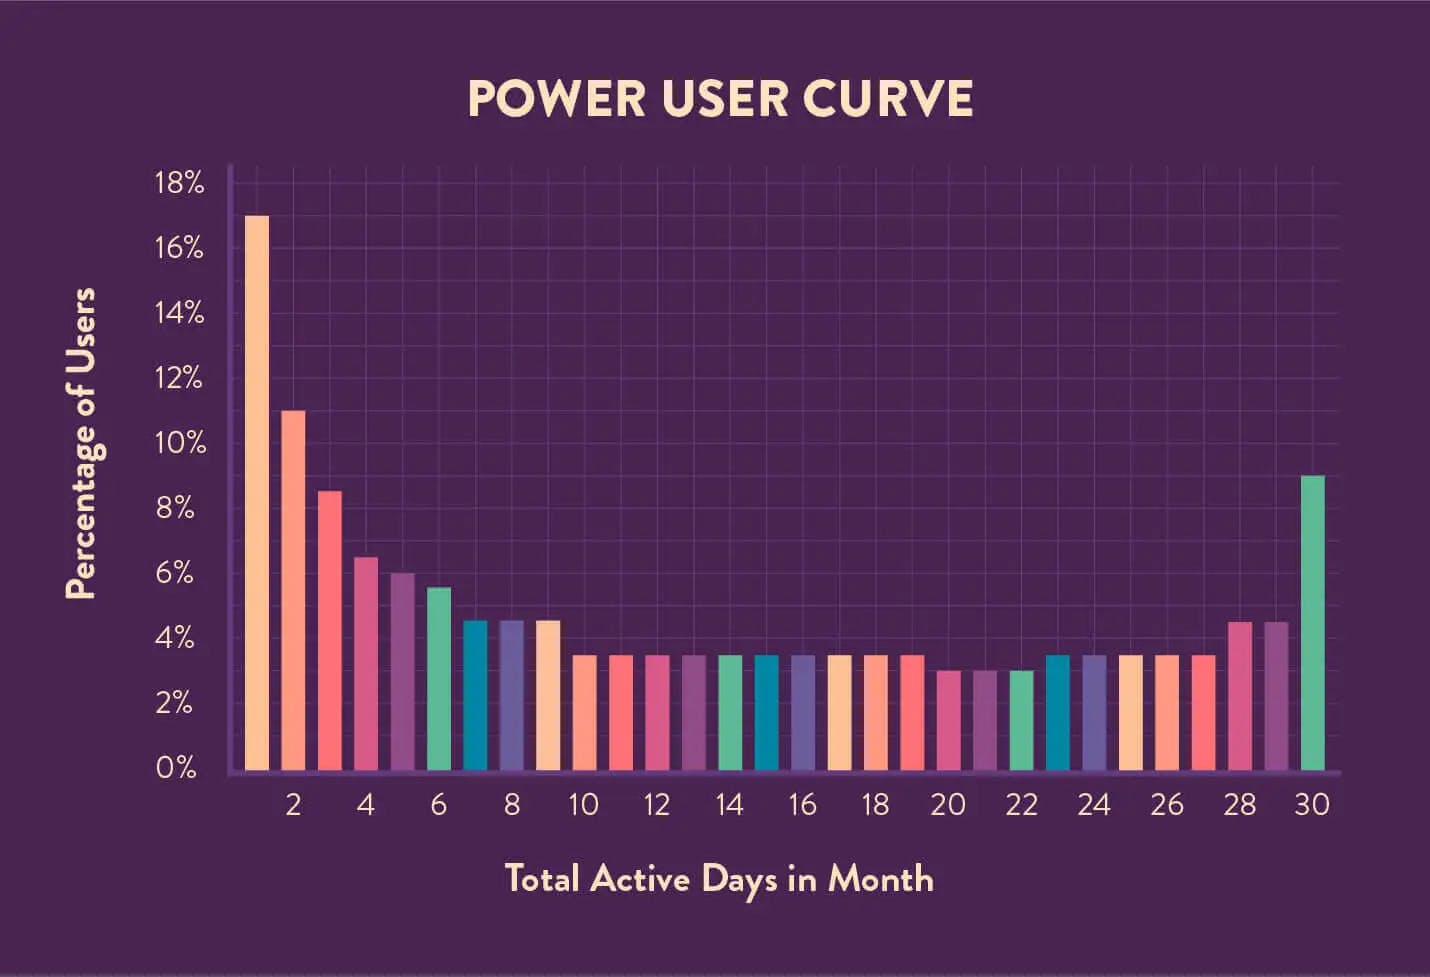
The shape of the Power User Curve can take on various forms, including a characteristic smile, each signifying distinct user engagement patterns.
Conversely, when the curve leans left, it signifies that most users engage with the app only once a month, resulting in a scarcity of power users based on this activity metric. However, it’s important to note that not all products rely on daily returning users. For example, SaaS products catering to businesses often focus on weekly actives, aligning with the workweek’s cycle. This tailored approach is especially pertinent for B2B SaaS products striving to boost usage during the business week.
How to leverage power users?
-
Feedback and reviews on platforms From the Power Users who are using your product, you can ask for feedback or a review on platforms like G2, Capterra, etc.
-
Personalized surveys for module-specific power users Find out the power users for a specific module and send a personalised survey for future feature improvement to those users.
-
Beta testing new features Identify Power Users to test new features or product updates before a full release. Their extensive experience with the product makes them ideal candidates for feedback on potential bugs, usability issues, or improvements.
-
User testimonials and case studies Approach Power Users to share their stories, turning them into testimonials or detailed case studies. This provides social proof and strengthens the relationship with the Power User.
-
Ambassador or affiliate programs Invite Power Users to join ambassador or affiliate programs, promoting the product to a wider audience and earning rewards for referrals.
-
Product training and webinars Invite Power Users to lead product training sessions or webinars, sharing their firsthand experience and expertise.
-
Feedback panels Organize feedback panels where Power Users discuss experiences, challenges, and suggestions, providing in-depth insights for the product team.
-
Exclusive events Host exclusive events or workshops for Power Users, allowing them to network and learn from each other.
-
Early access to promotions Reward Power Users with early access to promotions, incentivizing loyalty and driving early sales.
-
User-generated content Encourage Power Users to create content around your product, such as blog posts, videos, or social media posts, driving organic reach for your brand.
-
Custom support Provide Power Users with a dedicated support channel or account manager to address their unique needs efficiently.
By engaging with Power Users in these ways, companies can foster a loyal and engaged user community while improving their products and services.
Setting up power users insights in Usermaven
To employ a data-driven approach for a comprehensive analysis of your product’s power users within Usermaven, follow these steps on the product engagement page:
- Click on the “Product Insights” from left menu and then go to the “Product Engagement” section.
- Go to the “Manage Insights” section and click on the “Power Users Insights” button.
- In the “Name” field, provide a descriptive name for your insight report. This name should help you identify and remember the purpose of your analysis.
- Choose the specific events or actions that define a power user in your context. You can select one or more events based on the functionalities of your product. For example, you might select events like “user_identify” or “task created.”
- Determine the percentage of power users you want to focus on. You can choose from various percentages ranging from 5% to 30% in the dropdown menu.
- Click on the “Save” button.
Analyzing power users in Usermaven
Usermaven’s Power Users Dashboard provides graphical representations of the Power Users Curve at various time intervals:
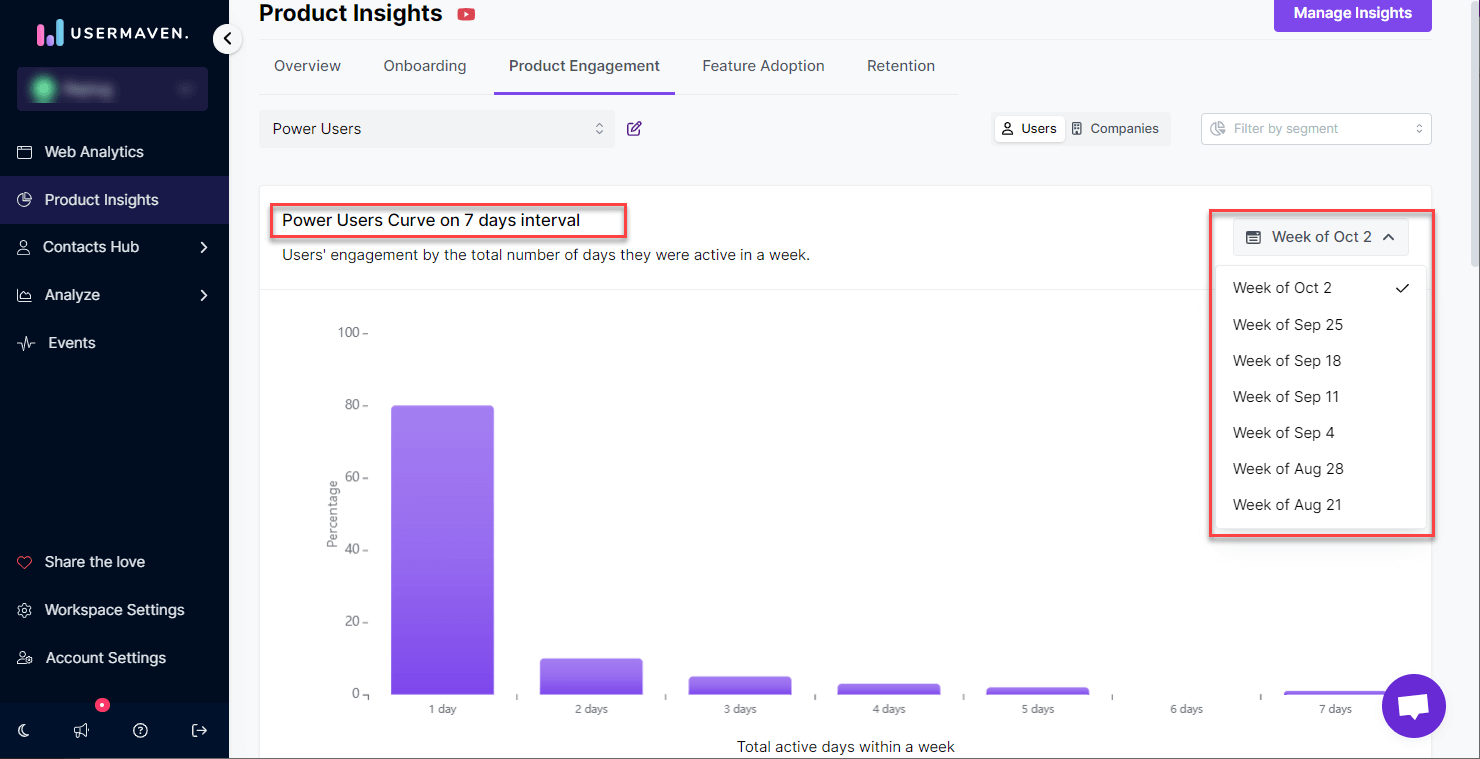
7 Days Interval Power Users Curve
This curve illustrates users’ engagement based on the total number of days they were active in a week. You can select a specific week for detailed insights using the date picker located on the right side of this curve.
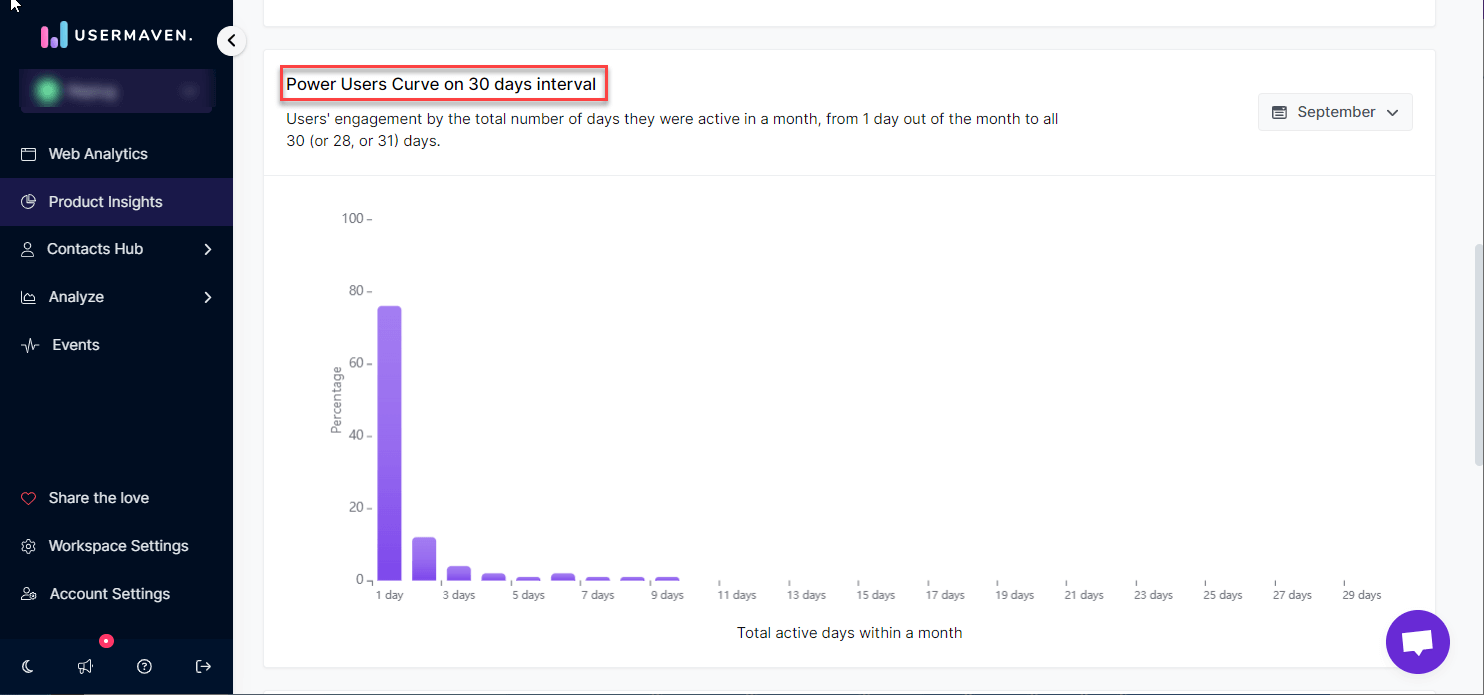
30 Days Interval Power Users Curve
This graph displays users’ engagement by showing the total number of days they were active in a month, ranging from 1 day to all 30 (or 28, or 31) days. Similar to the 7-day interval curve, you can choose a specific month for analysis using the date picker.
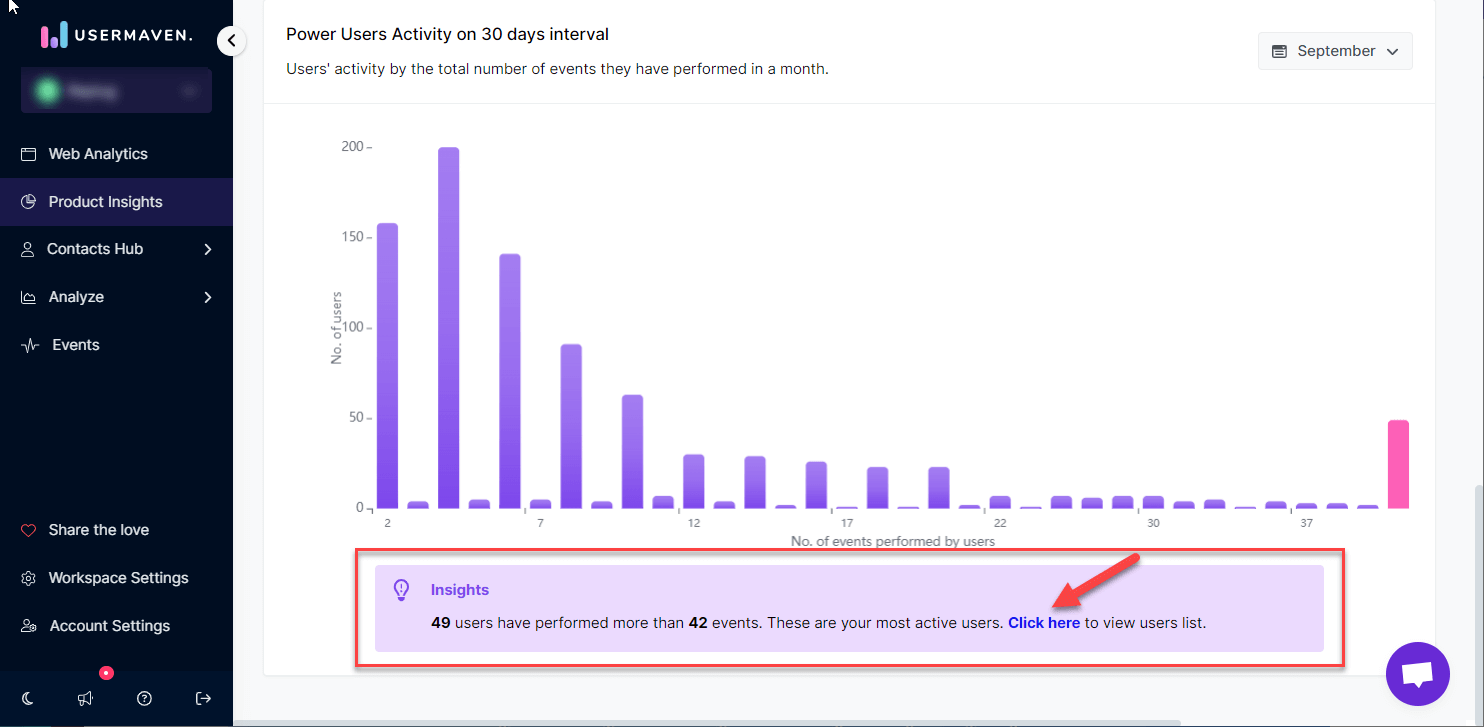
30 Days Interval Power Users Activity
This graph provides insights into users’ activity by showcasing the total number of events they have performed in a month. You can also select the particular month you want to analyze with the date picker.
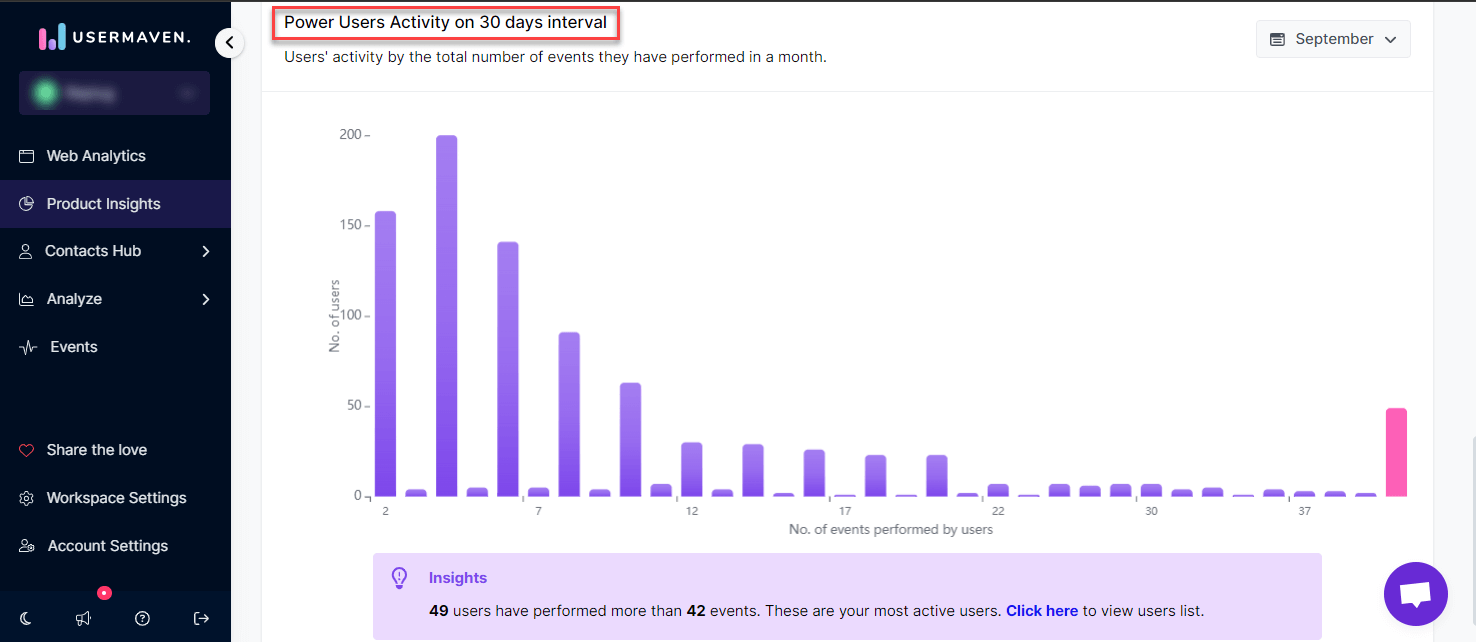
Getting Power Users List
At the bottom of the page, you’ll find a description of the insights available. If you wish to access the list of power users with the highest activity levels, simply click on “click here.” This will redirect you to a page where you can view the names, email addresses, and total events for each of these highly active users.
User Vs company level power users
User-Level Power User Metrics: This metric enables you to view other metrics on the power users dashboard from a user level perspective.It provides insights into users who actively and extensively engage with your product, often making the most out of its features and functionalities. By evaluating user-specific metrics, you can identify and understand your product’s power users more comprehensively. Company-Level Power User Metrics: In the context of businesses or products catering to organizations, this metric enables you to view other metrics on the power users dashboard from a company level perspective. This perspective is crucial for understanding how different companies utilize your product and the extent to which they have embraced power user features.
The ability to analyze power user metrics from both individual and organizational levels is a key feature in Usermaven. It provides users with a comprehensive understanding of how power users interact with their product, ultimately helping tailor strategies to better serve these highly engaged users.