How to measure retention through cohort analysis?
In today’s data-driven landscape, measuring user retention has evolved into a pivotal practice for businesses across various industries. The ability to track and understand user behavior, engagement, and long-term loyalty is instrumental for fostering sustainable growth and product success.
As a leading solution in the realm of user analytics, Usermaven offers a comprehensive framework for measuring and optimizing user retention. This document will delve into the multifaceted dimensions of user retention within Usermaven, providing insights, strategies, and best practices to help you harness the full potential of your product’s user base.
Whether you’re operating in the realm of SaaS, on-premise software, or any other domain, Usermaven’s retention metrics can empower your journey towards data-driven excellence.
What is user retention?
User retention, in its essence, signifies the continued engagement and utilization of a product, feature, or application by its user base. While assessing feature retention often involves a straightforward check to determine if a feature has been accessed within a specified time frame, gauging retention at the product or app level necessitates more precise parameters. Defining the criteria for what qualifies as meaningful product usage is a pivotal step in retention measurement.
It’s essential to delineate whether actions such as simply opening the app or accessing the website constitute usage or if more stringent criteria apply, such as the duration of interaction or the extent to which key features are employed. This distinction serves as the foundation for effective retention analysis.
How to measure user retention?
Once you’ve established the appropriate time frame for your retention analysis, the calculation process becomes relatively straightforward. It involves taking the initial count of active users at the beginning of that defined period and subtracting from it the count of users who are still actively engaging with your app at the end of the same period. To arrive at the equivalent retention rate, you can simply divide the remaining number by the initial count, providing you with a clear and quantifiable measure of your product’s retention performance.
This method can be seamlessly applied within Usermaven, allowing you to gauge user retention with precision and accuracy.
Setting up retention in Usermaven
To access Usermaven’s user retention dashboard, follow these simple steps:
- Click on the “Product Insights” tab located on the left side of your screen.
- Within the Product Insights section, navigate to the “Retention” tab positioned at the top of your screen.
- Click on the “Manage Insights”. After that click on the “User Retention” insight.
- Enter the name for your Retention insight.
- In the “Sign Up Events” tab, select the event that users trigger when they sign up for your product.
- Next, select the specific events you want to measure retention for. These should represent user activities in your product.
- Determine the frequency of product usage. Is your product something people use daily, weekly, or monthly?
- Finally, click on “Save Insight”.
Analyzing retention in Usermaven
Overall retention curve
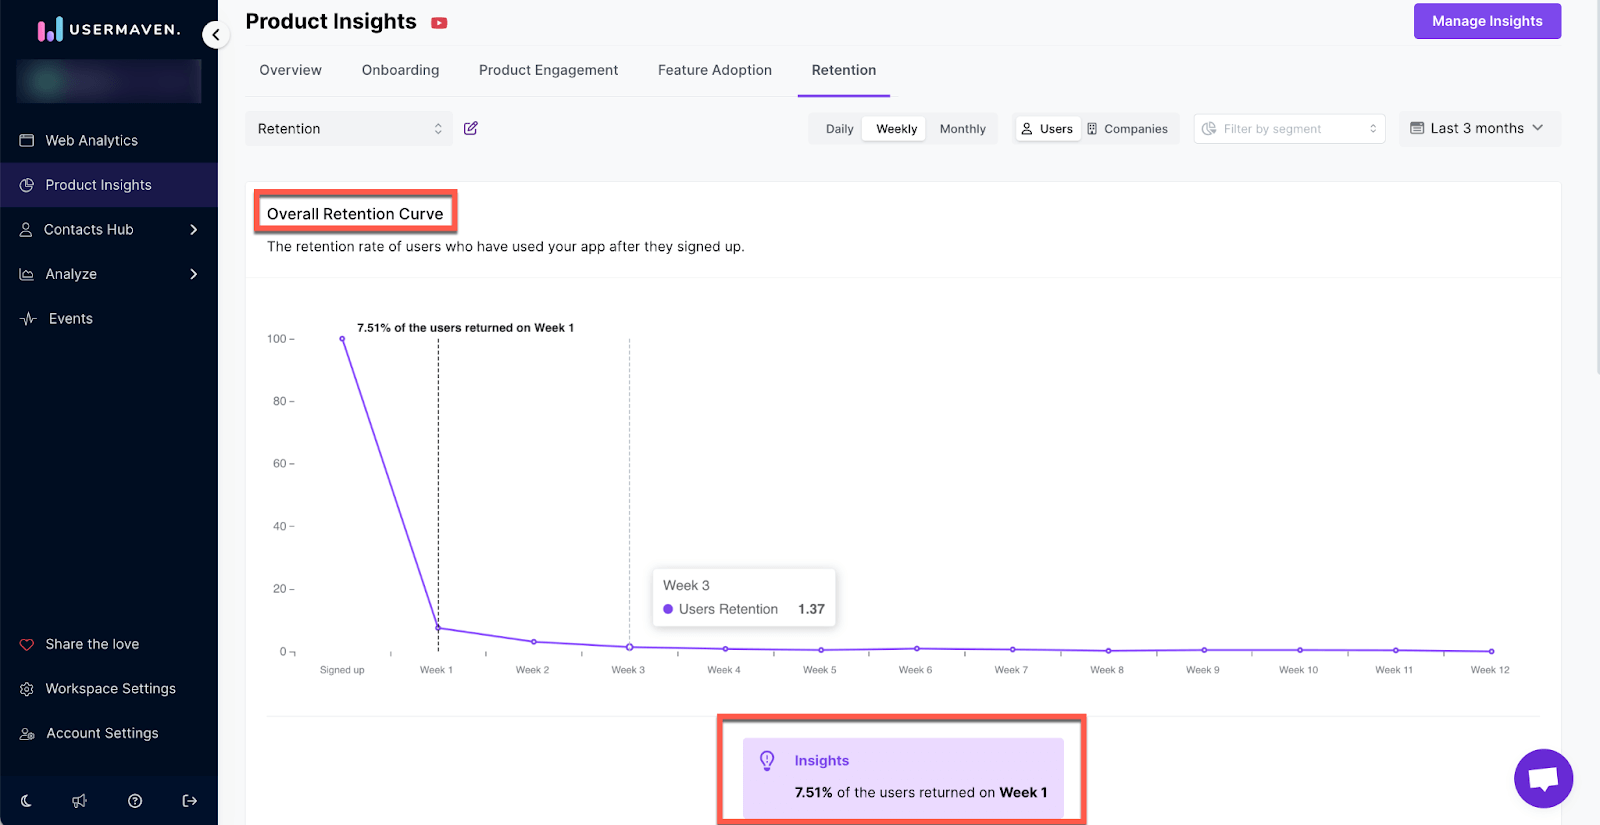
The Usermaven Retention Curve is a powerful visualization that depicts the retention rate of users who continue to engage with your app after their initial sign-up. This curve dynamically displays data based on the filters you’ve applied at the top of the dashboard. If you wish to obtain specific retention rate values at any point along the curve, simply hover your cursor over that particular spot, and the relevant data will be readily available.
This feature makes it easy to extract valuable insights from the retention curve. Additionally, the insights tab located below the graph offers an overall retention overview, providing users with a comprehensive understanding of their product’s retention performance.
Cohort analysis
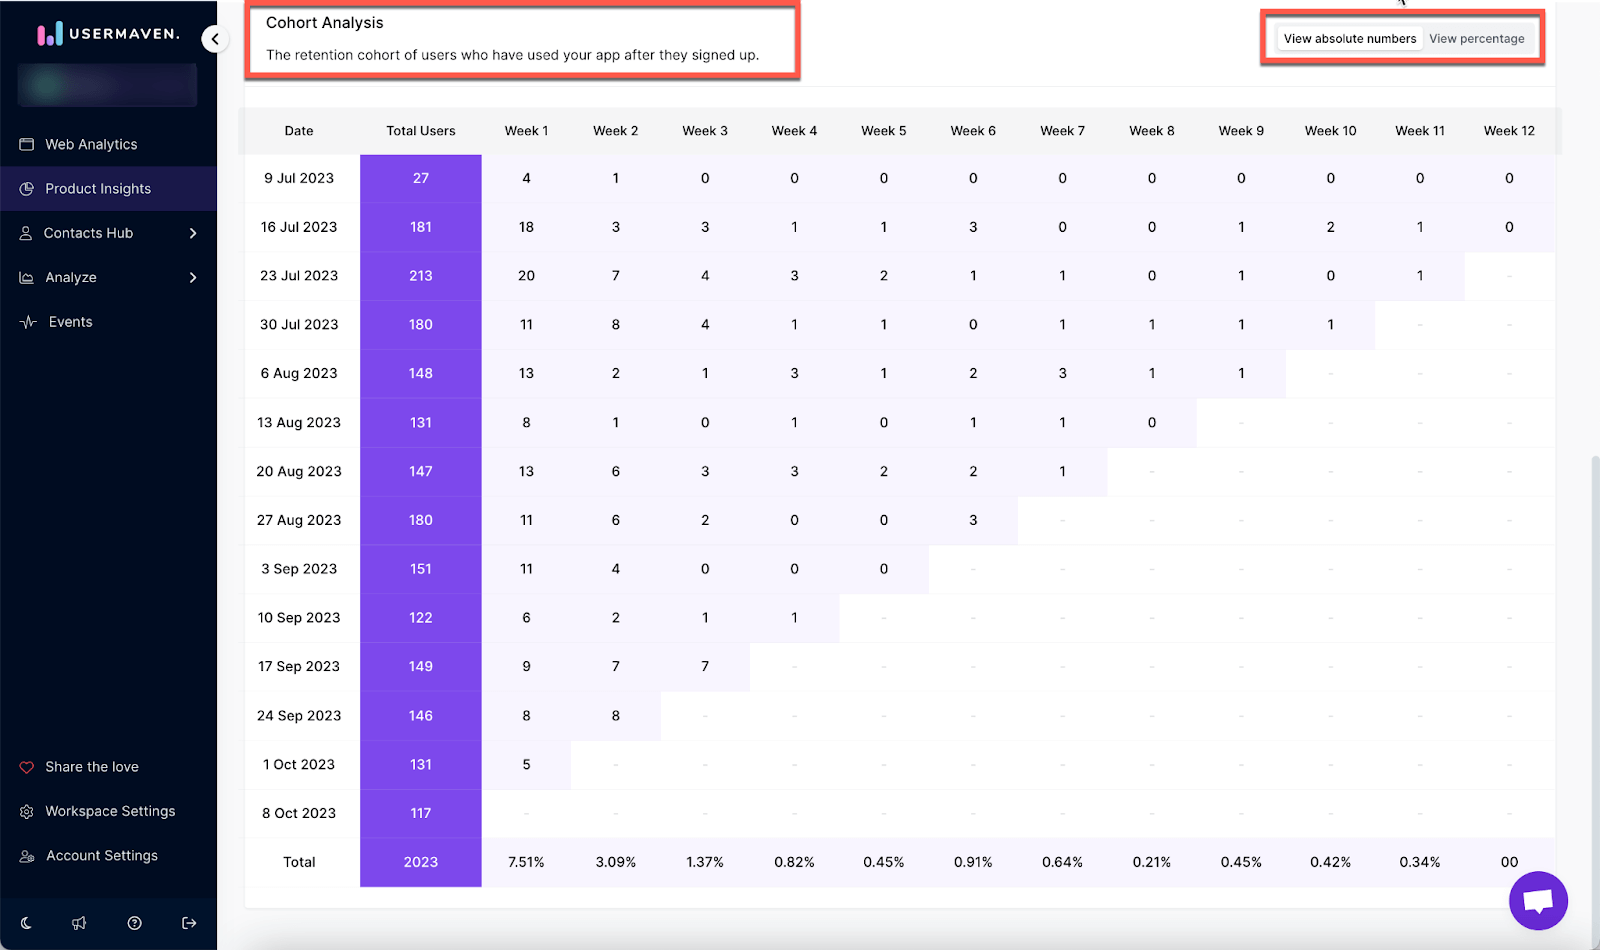
The cohort analysis tab at the bottom of the Usermaven retention dashboard provides a comprehensive retention cohort analysis of users who have engaged with your app following their initial sign-up.
For any specific date range, this analysis furnishes essential information, including the total number of users who initially signed up for your product and the number of users who continued using your product during subsequent time frames that you’ve selected.
This approach to data representation is not only detailed but also user-friendly, offering valuable insights into user behavior, allowing you to understand who actively uses your product and who may be discontinuing their engagement after the initial interaction.
By delving into these retention cohorts, you gain the power to make informed decisions about product enhancements, customer support, and tailored strategies to keep your users engaged.
The dynamic nature of the data allows you to adapt and evolve with your users, ultimately driving better retention rates and the sustained success of your product. Whether you’re aiming to strengthen your user retention strategy or uncover insights that lead to product improvements, Usermaven’s cohort analysis equips you with the tools you need to meet your goals effectively.
How to read a cohort analysis table
Cohort charts may appear complex at first glance, but understanding their components makes them surprisingly straightforward. Let’s break down a cohort chart step by step:
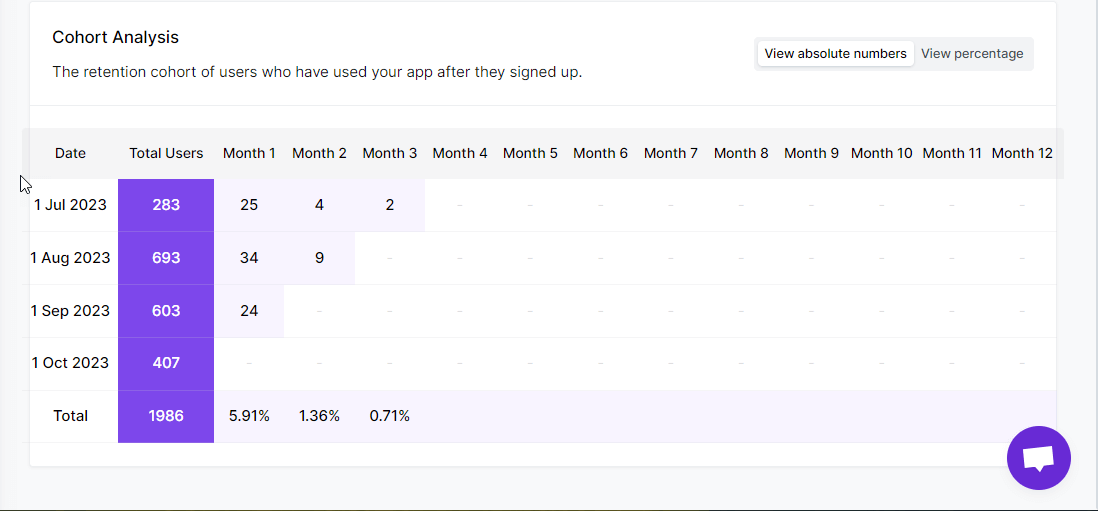
- Cohort Month: This is the initial month, representing the group of users who signed up during that period. For instance, “July 2023” signifies the users who joined your product in that specific month.
- Initial Count: The number next to the cohort month (e.g., “283”) is the count of customers who became part of this cohort. In this case, it means 283 customers signed up in July 2023.
- First Month Retention: The number/percentage (“25”) indicates how many customers from the initial cohort are still active after the first month. In this example, 25 of July 2023 signups remained engaged during their first month.
- Subsequent Months: Each column following the first represents the retention rate for that cohort over subsequent months. For instance, under the “1” column, it shows that 25 of the initial signups from July 2023 were active after their first month, and the pattern continues for each subsequent month.
- Absolute Percentages: Instead of numbers, you can opt for absolute percentages, which show the exact percentage of remaining customers after each month. This can be helpful when you need precise figures.
Cohort analysis provides invaluable insights into customer retention or revenue, depending on your goals. The real value of cohort analysis emerges when you use this data to make informed decisions and optimize your strategies.