Every business runs on decisions. The quality of those decisions depends entirely on the quality of the data behind them.
Performance analytics is the discipline that closes the gap between raw data and reliable decisions. It transforms numbers scattered across dashboards, spreadsheets, and platform reports into one coherent picture of how a business is actually performing.
This guide covers everything: the performance analytics definition, the key metrics that matter across business functions, how dashboards work, real performance analytics examples by industry, and how marketing teams can use marketing analytics to connect ad spend to revenue without relying on platform-reported numbers.
Key takeaways
Performance analytics is the practice of collecting, measuring, and analysing data to evaluate how well a business, team, or campaign is performing against defined goals
It spans marketing, sales, e-commerce, and operations, each with its own metrics, dashboards, and decision frameworks
The most effective performance analytics setup connects raw data to actionable decisions rather than just producing reports that nobody acts on
Marketing performance analytics specifically tracks how campaigns, channels, and content contribute to revenue and pipeline across the full customer journey
Usermaven delivers marketing performance analytics with independent attribution, AI-powered insights, and a unified dashboard that non-technical teams can use without developer support
What is performance analytics?
Performance analytics is the systematic process of collecting, measuring, and analysing data to evaluate how well a business, team, campaign, or channel is performing against defined objectives.
It answers the fundamental business question: are we hitting our goals, and if not, why not?
The performance analytics definition in practice looks different across business functions:
A marketing team uses it to determine which campaigns generated pipeline and which ones drained budget without producing results
A sales team uses it to identify which reps are performing above quota and what behaviours drive that performance
An e-commerce brand uses it to track conversion rates, average order value, and repeat purchase patterns
An executive team uses it to monitor revenue, churn, and growth against quarterly targets
Performance analytics is not a single tool or dashboard. It is a practice that combines data collection, metric definition, visualisation, and decision-making into one continuous cycle.
What performance analytics is not
Not vanity metrics tracking: Page views and follower counts without connection to business outcomes are not performance analytics. See the guide to vanity metrics for the distinction between surface metrics and meaningful KPIs.
Not isolated platform reporting: Each tool reporting its own numbers without reconciliation is fragmented data, not performance analytics.
Not retrospective-only analysis: Effective performance analytics informs future action. A report that explains the past without changing future behaviour is a history lesson, not a performance system.
Performance analytics also connects closely to data-driven marketing as the operational framework that turns measurement into a competitive advantage.
Why performance analytics matters for business teams
Performance analytics changes the quality of decisions teams make at every level of the business.
Faster decisions with less guesswork
Teams with structured performance analytics answer questions in minutes that previously required hours of manual data pulls. When every metric traces back to one consistent data source, decision speed increases, and confidence in those decisions increases with it.
According to McKinsey research on data-driven enterprises, companies that embed data and analytics across their decision-making processes outperform peers by a significant margin in terms of profitability and revenue growth. Performance analytics is the operational mechanism that makes this possible.
Budget accountability across every function
Performance analytics creates a direct line between investment and outcome. Marketing spend connects to the pipeline generated. Sales activity connects to revenue closed. E-commerce ad spend connects to repeat purchase rate.
Without this connection, budget allocation decisions are based on assumptions rather than evidence. The result is that the loudest voice in the room determines where money goes rather than the data.
Early warning before problems become expensive
Structured performance analytics catches declining metrics before they become crises. A drop in the conversion rate, as visible in a weekly performance review, is a minor optimisation problem. The same drop discovered at the end of a quarter is an expensive missed target.
According to Statista analytics market data, the global data analytics market is projected to exceed $650 billion by 2029 as businesses recognise that reactive measurement is no longer sufficient in competitive markets.
Alignment across teams
When marketing, sales, finance, and product all read from the same performance analytics data, planning conversations move away from disputed numbers and toward agreed actions.
The difference between reporting vs analytics is precisely this: reporting describes what happened, while performance analytics creates shared understanding that changes future behaviour.
Teams that invest in digital marketing metrics and KPIs frameworks consistently report shorter planning cycles and higher confidence in strategic decisions.
Key performance analytics metrics
The right performance analytics metrics depend on the business model and the questions the team needs to answer. Choosing too many creates noise. Choosing too few creates blind spots.
Marketing performance metrics
Conversion rate: percentage of visitors or leads who complete a defined goal action
Customer acquisition cost (CAC): total marketing and sales spend divided by new customers acquired in a defined period
Return on ad spend (ROAS): revenue attributed to ads divided by ad spend. See how to calculate ROAS for the formula and worked examples
Attribution by channel: which channels contribute to pipeline and revenue across the full customer journey
Cost per lead (CPL): total spend divided by leads generated in a defined period
Marketing-qualified leads (MQLs): leads that meet the criteria your team has defined as ready for sales engagement
Sales performance metrics
Win rate: percentage of opportunities that close as won
Average deal size: average revenue per closed deal
Sales cycle length: average days from first contact to closed deal
Pipeline coverage ratio: total pipeline value relative to revenue target
Rep activity metrics: calls, meetings, demos, and proposals per rep per period
E-commerce performance metrics
Conversion rate: visitors to purchases
Average order value (AOV): average transaction value per order
Customer lifetime value (CLV): total revenue a customer generates over their relationship with the brand
Cart abandonment rate: percentage of users who add to cart but do not complete purchase
Performance analytics takes different forms depending on which business function is being measured. Each type has its own data sources, metrics, and decision frameworks.
Marketing performance analytics
Marketing performance analytics is the practice of measuring how campaigns, channels, content, and attribution contribute to pipeline and revenue. It goes beyond platform-reported metrics like clicks and impressions to connect marketing activity to actual business outcomes.
Which channels are genuinely driving revenue, not just claiming credit for conversions that other channels influenced?
How does each touchpoint in the customer journey contribute to a closed deal?
Where is the budget being wasted on channels with poor conversion rates and misleading platform dashboards?
This is where independent attribution becomes critical. Each ad platform reports its own version of marketing performance. An independent analytics layer, like Usermaven, sits above all platforms and produces one accurate picture.
E-commerce performance analytics
Ecommerce performance analytics focuses on the metrics that drive online store profitability: traffic quality, conversion efficiency, cart behaviour, product performance, and customer retention.
Which traffic sources bring customers with the highest average order value?
Where in the checkout flow do customers drop off?
Which products drive the most repeat purchases and the highest lifetime value?
For ecommerce brands, performance analytics connects ad spend to actual profitability after accounting for product costs, returns, and fulfilment. Platform-reported ROAS is a starting point, not a conclusion.
Sales performance analytics
Sales performance analytics track team and individual performance against revenue targets, pipeline health, and sales cycle efficiency.
Which reps are consistently closing above quota, and what behaviours explain that performance?
Where are deals stalling in the pipeline and why?
How does sales cycle length vary by lead source, deal size, or product line?
Sales performance analytics connects marketing pipeline data to closed revenue, creating a full-funnel view from first ad impression to signed contract.
Operational performance analytics
Operational analytics tracks the efficiency of internal processes: production throughput, supply chain performance, customer support resolution times, and employee productivity. This is the primary domain of enterprise platforms like ServiceNow and Salesforce.
Product performance analytics
For SaaS and digital product companies, product performance analytics tracks feature adoption, user retention, activation rates, and the path from trial to paid conversion. It connects product usage to revenue outcomes in the same way marketing analytics connects campaign activity to pipeline.
For marketing teams, cross-channel marketing attribution is the bridge between marketing performance data and product performance data, connecting the acquisition journey to the activation and retention journey.
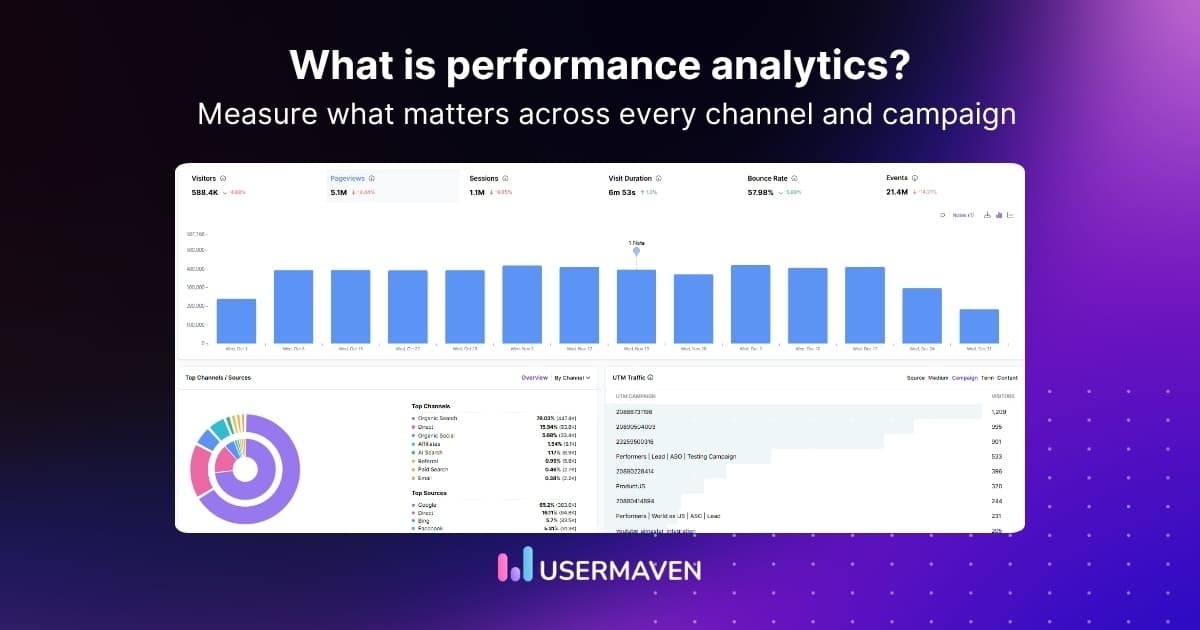
Performance analytics dashboard explained
A performance analytics dashboard is a visual interface that consolidates key metrics from multiple data sources into one real-time view. A well-designed dashboard makes performance visible without requiring manual data pulls or spreadsheet reconciliation.
What a performance analytics dashboard should include
For marketing teams:
Channel attribution breakdown, which sources drive pipeline and revenue across the full funnel
Campaign-level conversion rates and cost per acquisition by channel
Conversion funnel with drop-off rates at each stage
Product performance and repeat purchase data
Ad spend versus revenue by channel after product costs
What separates a good dashboard from a bad one
A poor performance analytics dashboard shows everything. A good one shows the right things for the right audience. Executives need trend lines and exceptions. Marketers need channel-level attribution. Operations teams need process efficiency metrics.
The biggest failure mode in dashboard design is tracking activity metrics, clicks, impressions, and sessions without connecting them to outcome metrics like pipeline, revenue, and profit. A dashboard that cannot answer “Is the business growing?” is a reporting tool, not a performance analytics tool.
Knowing how to use performance analytics effectively requires more than installing a tool. It requires a structured process that connects goals to metrics to decisions.
Step 1: Define what success looks like before measuring anything
Establish clear, measurable goals for each business function before selecting metrics or tools. A metric without a goal is just a number. A goal without a metric is just an aspiration. Performance analytics requires both to produce value.
Step 2: Identify the right metrics for each goal
Map each business goal to one primary metric and one or two supporting metrics. Too many metrics create noise. The discipline of limiting metrics forces clarity about what actually matters and prevents teams from optimising toward numbers that do not move the business.
Step 3: Connect your data sources
Performance analytics breaks down when data lives in disconnected tools. Connect your CRM, ad platforms, analytics tool, and revenue system to one centralised reporting layer.
For organizations managing large volumes of operational and marketing data, data warehouse consulting services can help establish the centralized infrastructure that performance analytics depends on. By consolidating information from CRM platforms, advertising channels, financial systems, and product analytics into a unified data warehouse, businesses can improve data quality, eliminate reporting inconsistencies, and provide decision-makers with a single, reliable source of truth for performance measurement.
Where performance analysis also relies on search visibility data, Oxylabs’ fast search API can supply organic search results with sub-second average response times for integration into the reporting pipeline.
This is where most teams underinvest and where most performance gaps originate. See data governance best practices for the framework to connect data sources without creating new inconsistencies.
Step 4: Establish a reporting cadence
Define how often each metric gets reviewed and by whom. Daily for real-time campaign optimisation. Weekly for performance trend analysis. Monthly for budget allocation decisions. Quarterly for strategic planning.
Mismatched cadences, reviewing monthly metrics daily or strategic metrics weekly, produce noise and decision fatigue without improving outcomes.
Step 5: Build decision rules into the process
Performance analytics is only valuable when it changes behaviour. For each metric, define the threshold that triggers an action. A conversion rate below 2% triggers a landing page audit. A CAC above target for two consecutive weeks triggers a channel review.
Pre-defined decision rules remove the subjectivity from performance reviews and ensure data actually drives action. See setting up conversion goals for how to build these thresholds into your analytics setup from the start.
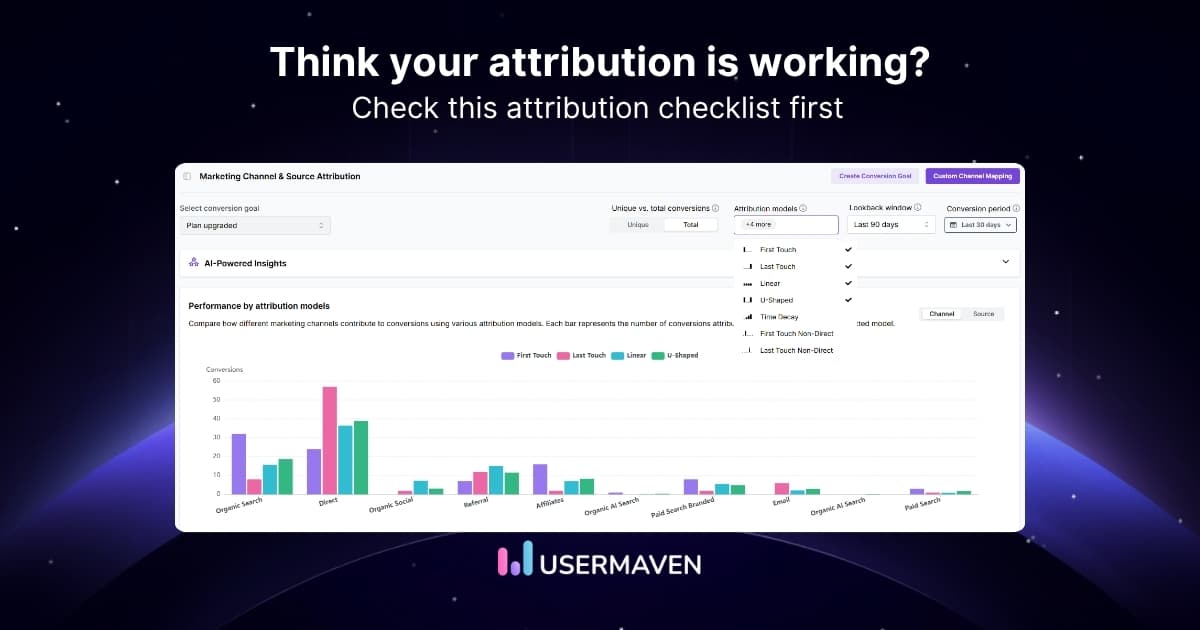
Step 6: Close the loop with attribution
The final step is connecting performance data to actual revenue. This requires marketing attribution models that count each conversion once across all channels.
Without attribution that reconciles with CRM data, performance looks better in dashboards than it does in the bank account. This gap between reported performance and actual results is the most expensive information asymmetry in marketing.
Performance analytics examples by industry
Real-world performance analytics examples illustrate how the same principles produce different insights across different business contexts.
Example 1: B2B SaaS company using marketing performance analytics
A B2B SaaS company running Google Ads, LinkedIn campaigns, and content marketing sets up performance analytics to answer one question: which channel produces the most pipeline per dollar spent?
Using an independent attribution layer, they discover:
Google Ads drives 45% of first-touch conversions, but only 22% of closed revenue
LinkedIn campaigns appear expensive on a CPL basis, but drive 38% of closed revenue
Content marketing assists 60% of all conversions, but rarely receives last-click credit
Without marketing performance analytics connecting ad spend to closed revenue through the CRM, the team was about to cut LinkedIn and double Google Ads based on CPL alone. Full-funnel attribution through paid search attribution and content analytics reverses that decision and saves significant misallocated budget.
Example 2: E-commerce brand using performance analytics to reduce wasted spend
A DTC ecommerce brand selling across Meta, Google, and TikTok sets up ecommerce performance analytics to track revenue by channel after accounting for product costs and returns.
They discover:
Meta drives the highest ROAS on the platform dashboard, but the lowest profit margin after returns are factored in
Google Shopping drives lower ROAS but higher average order value and repeat purchase rate
TikTok drives strong new customer acquisition at a sustainable CAC for high-margin products
Platform-reported ROAS led to overinvestment in Meta. Full-funnel ecommerce performance analytics connected through revenue attribution and revenue analytics shift budget toward Google and TikTok, where actual profitability is stronger.
Example 3: Sales team using performance analytics to improve win rate
A mid-market sales team uses sales performance analytics to identify why win rates have declined over two quarters.
They discover:
Deals sourced from paid social convert at an 18% win rate
Deals sourced from organic content convert at a 34% win rate
The average sales cycle for content-sourced deals is 12 days shorter
The analysis leads to a shift in lead scoring, prioritising content-sourced inbound leads and adjusting commission structures to reflect actual close probability by source. The conversion funnel data reveals exactly where paid social leads stall, enabling targeted sales enablement rather than blanket process changes.
Unlock insights that drive growth
*No credit card required
Best performance analytics software and tools
The right performance analytics software depends on which business function you are measuring and how technical your team is. Here are the strongest options across different use cases.
1. Usermaven: Best for marketing performance analytics
Usermaven combines website analytics, multi-touch attribution, campaign tracking, and AI-powered insights in one platform. No-code setup, GDPR compliant, starts at $84/month.
The website analytics software layer captures every session, while the marketing attribution software connects paid touchpoints to revenue outcomes. Maven AI delivers self-service performance insights without SQL or developer dependency.
Best for: Marketing and growth teams that need independent attribution, channel performance analytics, and AI-driven insights without data engineering support.
2. Google Analytics 4: Best for website traffic analytics
Free with Google products. Strong for website behaviour and basic traffic source reporting. Limited attribution capability and significant data sampling at scale. Requires technical setup for custom conversion events.
Best for: Teams needing basic web performance analytics who are primarily in the Google ecosystem. See Google Analytics limitations for where GA4 falls short as a standalone performance analytics solution.
3. HubSpot: Best for combined CRM and marketing performance
Strong pipeline and sales performance tracking with native CRM integration. Higher cost at enterprise tiers. Limited capability for multi-platform paid media attribution across Google, Meta, and LinkedIn simultaneously.
Best for: Teams that manage marketing and sales performance within one platform and prioritise pipeline visibility over paid media attribution accuracy.
4. Tableau: Best for operational and business intelligence analytics
Highly customisable visualisation and analysis platform. Requires data engineering support for setup and maintenance. Best suited for organisations with dedicated analytics teams that need cross-functional business performance reporting.
Best for: Large organisations with analytics teams needing flexible, custom performance dashboards across multiple business functions simultaneously.
For larger organizations with complex data environments, multiple business units, and advanced governance needs, dedicated enterprise performance analytics tools provide the scalability, security, and cross-departmental visibility required at scale.
How Usermaven delivers performance analytics for marketing teams
Usermaven is an AI-powered marketing attribution platform that connects ad platforms, CRM, and website data to track the full customer journey in real time using first-party and server-side tracking across every paid channel you run.
Instead of inheriting each platform’s self-reported numbers, Usermaven applies one consistent measurement layer above Google, Meta, LinkedIn, TikTok, and organic simultaneously.
One unified performance analytics dashboard
Usermaven combines website traffic, campaign attribution, conversion tracking, and product analytics in one workspace. Marketing teams see every performance metric from first anonymous visit to closed revenue without switching between GA4, Meta Ads Manager, HubSpot, and spreadsheets.
The analytics dashboard surfaces the metrics that matter for marketing performance without requiring custom reports or SQL queries.
Independent attribution for accurate marketing performance
Platform-reported performance metrics inflate results because every platform claims more credit than it deserves. This is the core problem documented in the guide to ad platform discrepancies.
Usermaven tracks conversions independently using first-party data and applies one consistent multi-touch attribution model across all channels. The result is performance data that matches CRM revenue rather than platform claims.
Maven AI for self-service performance analytics
Maven AI lets marketing teams ask performance questions in plain language and receive instant answers. “Which campaigns drove the most revenue last month?” “What is my cost per acquisition from LinkedIn vs Google?”
Teams get performance analytics insights without writing SQL or waiting for a data analyst. See the complete guide to ad tracking for how Usermaven connects campaign tracking to performance measurement in one flow.
Privacy-first tracking for complete performance data
Usermaven’s ad-blocker bypass and cookieless tracking capture near-complete session data even in privacy-restricted browser environments. This means performance metrics reflect the full audience rather than only the portion that does not use tracking protection.
Built for non-technical marketing teams
No-code setup in minutes. No developer dependency for reports, attribution changes, or new campaign tracking. Marketing performance analytics that teams can own and operate independently from day one.
Drive business growth with AI-powered analytics
*No credit card required
Conclusion
Performance analytics is not a software category. It is a discipline that connects data to decisions across every function in a business.
The teams that do it well make faster, more confident choices. The teams that skip it optimise based on assumptions that their competitors are already disproving.
For marketing teams specifically, performance analytics means having one trusted number for every channel, every campaign, and every conversion — a number that reconciles with CRM revenue rather than inflating it.
Data without performance analytics is just noise. Performance analytics without attribution is just reporting. Attribution without independence is just each platform marking its own homework.
Not sure where to start? Usermaven’s guided analytics setup walks you through connecting your ad platforms, defining conversion events, and configuring attribution step by step, so your performance analytics is accurate from day one.
Try Usermaven free with no credit card required. Or book a free demo to see how accurate performance analytics changes every decision your team makes.
FAQs
1. What is performance analytics?
Performance analytics is the systematic process of collecting, measuring, and analysing data to evaluate how well a business, team, campaign, or channel is performing against defined objectives. It combines data collection, metric definition, and decision-making into one continuous cycle that turns raw data into actionable business intelligence.
2. What is the difference between performance analytics and business analytics?
Business analytics is a broader discipline that includes historical analysis, predictive modelling, and strategic planning. Performance analytics is a subset focused specifically on measuring actual performance against defined goals. All performance analytics is a form of business analytics, but not all business analytics is performance analytics. The key distinction is that performance analytics always connects measurement to a specific goal and triggers a decision.
3. What are the most important performance analytics metrics?
The most important metrics depend on the business function. For marketing: conversion rate, CAC, ROAS, and attribution by channel. For sales: win rate, pipeline coverage, and average deal size. For e-commerce: conversion rate, AOV, and customer lifetime value. For all functions, the most important metrics are the ones that directly connect activity to revenue outcomes and trigger decisions when they move outside acceptable ranges. See ad performance metrics for the complete marketing performance measurement framework.
4. What is a performance analytics dashboard?
A performance analytics dashboard is a visual interface that consolidates key metrics from multiple data sources into one real-time view. A good dashboard shows the right metrics for the right audience and connects activity metrics to outcome metrics so teams can see whether performance is improving or declining without manual data pulls.
5. How is performance analytics used in marketing?
Marketing performance analytics tracks how campaigns, channels, and content contribute to pipeline and revenue. It uses attribution models to distribute credit across touchpoints, compares performance against benchmarks, and surfaces insights about which channels deserve more budget and which ones are underperforming. The most accurate marketing performance analytics setup uses independent attribution that counts each conversion once across all platforms rather than accepting each platform’s self-reported numbers. Usermaven is built specifically for this, combining first-party tracking, seven attribution models, and Maven AI to give marketing teams one trusted performance number across Google, Meta, LinkedIn, and every other channel they run.
6. What is the best performance analytics software?
The best performance analytics software depends on the use case. For marketing performance analytics, Usermaven is the strongest choice for teams needing independent attribution, AI-powered insights, and a unified multi-channel dashboard without developer dependency. For general business intelligence, Tableau and Power BI serve broader organisational analytics needs. For a full comparison, see the dedicated guides to performance analytics software and performance analytics tools. Links will be added when child blogs are published.
A single conversion can involve several Google Ads interactions before it happens. A non-brand search click, a YouTube view, a remarketing ad, and a branded search click might all occur before someone buys, and the account still needs a rule for deciding which of those interactions gets credit. Attribution is not the same thing as […]
You’ve been there. It’s Monday morning. Campaign dashboards are open, ad platforms show glowing results, but when you try to piece it all together, the story doesn’t quite add up. Which channel did it? Was it your retargeting ad? The influencer campaign? Or that new email series you launched last week? That’s the moment every […]
Marketing attribution becomes commercially useful when campaign data reaches the CRM and closed revenue flows back into the attribution model. Advertising platforms and analytics tools can report clicks, sessions, form submissions, and signups. But those metrics do not show whether a campaign produced qualified accounts, sales opportunities, pipeline, or closed revenue. A marketing attribution platform […]