Do you know the top 10% of websites have a conversion rate of 11% and above? While converting at 2-3 % is fair for businesses in the early stages, you can always aim for higher conversion rates.
But whether your website falls under the fair-performing websites or is a top player depends on your conversion optimization strategy. In the ever-changing digital marketing landscape, understanding the intricacies of conversion metrics is crucial for effective decision-making.
Whether you’re a seasoned marketer or navigating the digital realm for the first time, unlocking the potential of these conversion metrics is key to achieving optimal results.
This article explores the significance of conversion metrics for digital marketers. It also delves into 15 specific conversion metrics, from website conversion rates to return on ad spend (ROAS). Let’s explore what they are!
Key takeaways
This article aims to provide marketers with a comprehensive toolkit for gauging success and refining their digital endeavors. Below are the key takeaways:
Conversion metrics are quantitative measures used to assess the effectiveness of digital marketing strategies in converting users from one stage to another in the customer journey.
They offer insights into user behavior, allowing marketers to refine strategies and improve the overall customer experience.
15 must-track conversion metrics include revenue, ROAS, lifetime value, CPA, media mentions, NPS, and more.
Use Usermaven to track conversion metrics, analyze customer journeys, and understand which channels and actions contribute to revenue.
By analyzing conversion metrics, marketers can identify friction points or drop-offs in the conversion funnel and address them.
Data from conversion metrics inform marketers about the performance of different marketing channels, allowing them to allocate resources to the most effective channels.
Insights from conversion metrics enable marketers to personalize content and experiences, resonating more effectively with the target audience and increasing the likelihood of conversion.
Understanding conversion metrics
Conversion metrics refer to the key performance indicators (KPIs) used to measure the success of a specific action or goal in a business context. These metrics help companies evaluate how well they convert potential customers into actual customers or power users. Conversion metrics are crucial for assessing the effectiveness of marketing and sales efforts and overall business strategies.
Conversion metrics in digital marketing are instrumental in the following:
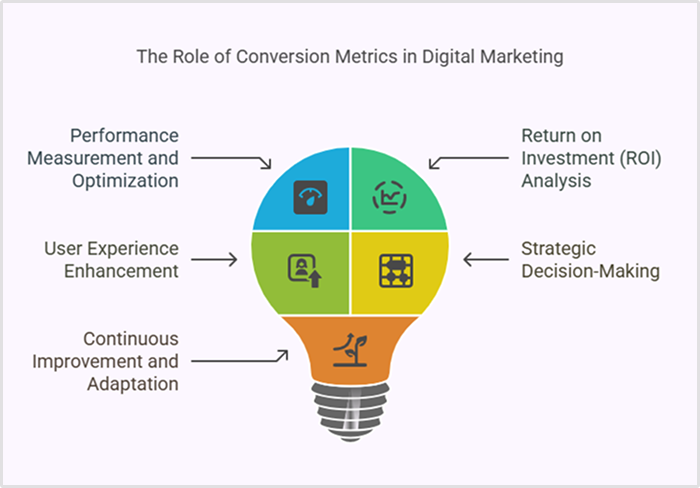
Importance of conversion metrics in digital marketing
Conversion metrics play a crucial role in digital marketing by providing valuable insights. The points below highlight the importance of conversion metrics in digital marketing
1. Performance measurement and optimization
Conversion metrics serve as benchmarks to assess the performance of digital marketing campaigns. Marketers can identify which strategies and channels deliver the best results by tracking metrics like conversion rates. These conversion metrics enable you to optimize campaigns in real time. You can better reallocate resources to the most effective channels and refine strategies to improve overall performance.
2. Return on investment (ROI) analysis
These conversion metrics help quantify the ROI for digital marketing efforts. Marketers can evaluate the cost-effectiveness of different campaigns by comparing the costs incurred to the revenue generated through conversions. Understanding the ROI allows you to allocate budgets more efficiently. You can focus resources on campaigns and channels that deliver the highest returns.
3. User experience enhancement
Conversion metrics provide insights into user behavior throughout the customer journey. They highlight areas where users may encounter obstacles or drop off. By analyzing conversion funnel metrics, you can identify pain points. Consequently, making data-driven decisions enhances the user experience, streamlines processes, and increases conversions.
4. Strategic decision-making
Digital marketing strategies can be complex, involving multiple channels and tactics. Conversion metrics provide data to support strategic decision-making. They help marketers understand which elements of their strategy are working and which need adjustment.
Marketers can use conversion data to refine targeting, messaging, and creative elements. It ensures that their digital marketing efforts align with the preferences and behaviors of their target audience.
5. Continuous improvement and adaptation
The digital landscape is dynamic, and consumer behaviors can change rapidly. Conversion metrics allow you to stay agile and adapt your strategies based on real-time data.
Through continuous monitoring and analysis of conversion metrics, you can identify emerging trends, capitalize on new opportunities, and stay ahead of the competition in the ever-evolving digital marketing space.
In short, businesses can refine their digital marketing strategies by leveraging these metrics to achieve better results and drive meaningful outcomes.
15 Conversion metrics that you need to analyze
After developing an understanding of the conversion metrics and their importance, below, we discuss the essential conversion metrics that digital marketers must analyze.
1. Revenue
The “revenue” is a fundamental conversion metric representing the total income generated from a business’s sale of goods or services. It is crucial because it directly reflects the financial performance of the company and its ability to generate income.
Consistent and high revenue levels typically signal a healthy and sustainable business. They enable companies to make informed decisions about expansion, investment, or cost management. Furthermore, businesses analyze revenue trends over time, comparing current figures to previous periods and industry benchmarks to assess their performance relative to competitors. The revenue formula is straightforward.
Formula
Revenue = Quantity of Goods or Services Sold× Price per Unit
It calculates the total income generated by multiplying the quantity of goods or services sold by the price per unit.
Tip: You can track revenue against your SaaS subscriptions with Usermaven’s conversion goals features.
Conversion rate measures the percentage of website visitors or users in a specific marketing channel who take a desired action. Action could be purchasing, filling out a form, subscribing to a service, and more. It is a crucial metric for assessing the effectiveness of a website or marketing campaign in converting potential customers into actual customers.
By analyzing the conversion data, businesses can identify areas for improvement, optimize their website or marketing campaigns, and ultimately increase the ROI.
Formula
Conversion Rate = (Number of Conversions/Total Visitors or Users)×100
It calculates the percentage of visitors who completed the desired action out of the total number of visitors or users multiplied by 100.
Tip: When you set a conversion goal with Usermaven, it automatically calculates its associated conversion rate. The same is displayed in the “Conversion Goals” tab on the website analytics dashboard in Usermaven.
The “leads generated” metric quantifies the number of potential customers interested in a business’s product or service. A lead is typically an individual or organization that has expressed interest by taking some action, such as filling out a form, downloading a whitepaper, or subscribing to a newsletter.
Amongst many other scenarios where businesses can use lead data, one is to optimize their sales funnel. Understanding how leads move through sales enables companies to tailor their strategies. They can nurture leads effectively and increase the likelihood of conversion.
Formula
Leads Generated = Number of Individuals or Organizations Expressing Interest
Tip: You can create goals with product analytics in Usermaven to identify and track leads.
4. Cost per acquisition
The “cost per acquisition” metric measures the average cost incurred by a business to acquire a new customer. It is a KPI that helps assess the efficiency and cost-effectiveness of marketing and advertising campaigns in acquiring paying customers.
Businesses can use CPA to identify profitable customer segments and optimize advertising campaigns. They can set realistic budgets based on the cost of acquiring a customer and ensure that marketing expenses align with revenue goals.
Formula
Cost per Acquisition (CPA) = Total Cost of Acquisition/Number of New Customers
5. Order value
The “order value” represents the average monetary value of each order placed by a customer. It provides insights into the average amount customers spend in a single transaction. This metric helps businesses understand their purchasing behavior and overall revenue generation.
By analyzing order value, you can identify which products or services contribute most to the overall revenue. Such information aids in adjusting offerings or promoting high-value items to maximize sales. You can also identify cross-selling and upselling opportunities and make recommendations during the purchasing to increase the overall order size.
Formula
Order Value = Total Revenue/Number of Orders
Tip: Usermaven allows you to track certain metrics by creating custom events such as order value. Relevant data will be visible for you to analyze in the “Conversion Goals” tab on your website analytics dashboard.
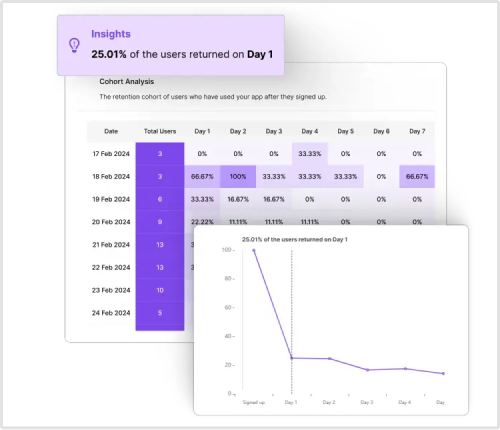
6. Retention
Retention measures the ability of a business to keep existing customers over a specific period. It involves tracking the percentage of customers who continue to engage with or purchase from the business over time.
Retention metrics assess the loyalty of existing customers. High retention rates indicate satisfied customers who continue to choose the business over competitors. A stable and predictable customer base is essential for business sustainability. Businesses can better anticipate future revenue and plan for growth by tracking retention.
Formula
Retention Rate = [(Number of Customers at End of Period − New Customers Acquired)/ During Period Number of Customers at Start of Period]×100
Tip: Usermaven offers a comprehensive “Retention” dashboard under your product insights. You can view your customer retention on a daily, weekly, or monthly basis. Segregation of individual users and companies is also possible. Moreover, there is a complete retention cohort analysis for businesses interested in gaining deeper insights into their retention strategies’ performance.
The “lifetime value” metric represents the predicted total revenue a customer is expected to generate for a business throughout their entire relationship. It is a key metric that helps businesses understand the long-term financial value of acquiring and retaining a customer.
By tracking LTV, you can identify patterns that may lead to customer churn. You can proactively address underlying issues, improve customer experience, and increase the likelihood of retaining high-value customers. A high LTV can be a competitive advantage. Businesses that effectively maximize customer LTV are often better positioned in the market. Also, they are more likely to invest in customer experience and acquisition rather than worrying about retaining them.
Formula
Lifetime Value (LTV) = Average Purchase Value×Average Purchase Frequency×Average Customer Lifespan
8. Return on investment (ROI)
Return on investment (ROI) is a crucial metric that assesses the profitability of an investment relative to its cost. In the context of digital marketing, ROI helps businesses evaluate the effectiveness of their online marketing campaigns and initiatives.
ROI informs budgeting decisions by providing insights into the profitability of digital marketing efforts. It aids in setting realistic budgets, ensuring that marketing expenditures align with business goals and deliver positive returns. Moreover, it helps in attribution modeling. You can better understand the contribution of each touchpoint in the customer journey to the overall return. This insight is valuable for adjusting marketing strategies to focus on high-impact touchpoints.
Formula
ROI = (Cost of Digital Marketing/Net Profit from Digital Marketing)×100
9. Return on ad spend (ROAS)
Return on ad spend (ROAS) is a marketing metric that measures the revenue generated for every dollar spent on advertising. It evaluates the effectiveness of advertising campaigns by quantifying the ROI of advertising efforts.
In practice, strong ad performance tracking makes ROAS more meaningful because it shows whether your ad spend is driving real conversions instead of surface-level clicks.
Businesses can assess which advertising platforms or channels deliver the best returns. ROAS data over time also helps analyze seasonality and trends in advertising performance. It is valuable for adjusting strategies in response to changing market conditions or consumer behavior.
Formula
ROAS = Revenue from Ads / Cost of Ads
10. Media mentions
Media mentions are the number of times a brand, product, or service is mentioned or featured in various media outlets. These might include news articles, blogs, social media, and other online or offline publications. It is a measure of a brand’s visibility and public relations impact.
Beyond counting mentions, businesses can perform sentiment analysis on media mentions. This way, they can understand the overall tone and perception of the brand in the media. Media mentions can be tied to influencer collaborations and partnerships. They peak during product launches and marketing campaigns.
Formula
There isn’t a specific formula for media mentions, as it’s more of a qualitative metric. Instead, businesses often use media monitoring tools to track and count the number of times their brand is mentioned across different media channels.
There isn’t a specific formula for calculating branded searches, as it is typically a count-based metric. This metric is typically obtained from search engine analytics tools or website analytics feature of Usermaven that provide data on the number of searches containing the brand name.
11. Total traffic
Total traffic is one of the conversion metrics that represent the overall volume of visitors a website or online platform receives over a specific period. It includes new and returning users and provides a comprehensive view of the audience’s engagement with the site.
Trends in total traffic over time reveal patterns in user behavior. Businesses can identify peak periods, seasonality, or emerging trends. SEO efforts influence this metric. A well-optimized site is likely to attract more organic traffic. Moreover, businesses can attribute total traffic to specific user acquisition channels, such as organic search, social media, or paid advertising. Enhancing local SEO practices can also improve total traffic by attracting nearby users actively searching for relevant services or products.
Formula
Total Traffic = Number of Visitors (New + Returning)
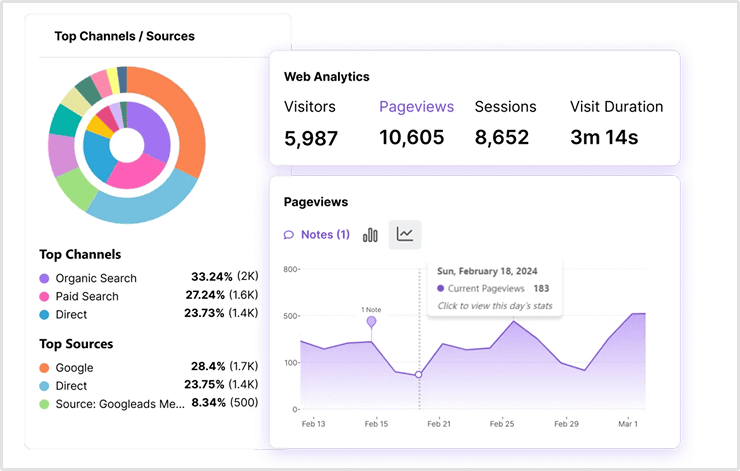
Tip: Usermaven calculates the total visitors for each domain you track with it. You can visualize total traffic data in the form of visitors (both new and returning). Moreover, it also breaks down your website traffic into separate website traffic sources, such as direct, social, search, email, and more.
12. Email subscribers
The “email subscribers” metric quantifies the number of individuals who have opted to receive emails from a business. It represents the size of the email subscriber base and is a key indicator of the audience interested in receiving communication, updates, or promotional content via email.
Email subscribers are often leads in different stages of the sales funnel. Email marketing allows businesses to nurture these leads by providing valuable content, offers, and information, moving them closer to conversion.
Formula
Email Subscribers = Total Number of Individuals Subscribed to Emails
There isn’t a specific formula for calculating email subscribers. The count is typically obtained directly from the email marketing platform. It represents the total number of individuals who have subscribed to receive emails.
Tip: As performance attribution software, Usermaven helps you create custom events, track conversion actions like email subscribers, and connect those actions to broader marketing performance.
13. Branded searches
Branded Searches refer to the number of searches conducted on search engines using the specific brand name of a business or product. It measures the volume of users actively seeking information about a particular brand.
Branded searches are a direct indicator of brand visibility. The more frequently users search for a brand, the more visible and top-of-mind it is within its target audience. Additionally, an increase in branded searches suggests growing brand recognition. These searches also contribute to a brand’s overall SEO performance.
Formula
There isn’t a specific formula for calculating branded searches, as it is typically a count-based metric. This metric is typically obtained from search engine analytics tools or website analytics tools that provide data on the number of searches containing the brand name.
You can track the keywords users use to search for your brand. You can find relevant details regarding keywords like click-through rate, impressions, average position, etc.
14. Reviews
Reviews metric quantifies the number of reviews, ratings, or testimonials a business receives from customers or users. It encompasses feedback on various platforms, including review websites, social media, and the business’s own website.
Reviews provide direct feedback from customers, offering insights into their experiences with products, services, or the overall brand. Such feedback is valuable for understanding customer satisfaction and identifying areas for improvement. Reviews serve as valuable user-generated content. Businesses can repurpose positive reviews in marketing materials, on their website, or in promotional campaigns to showcase their customer’s positive experiences.
Formula
There isn’t a specific formula for calculating the reviews metric. The count is typically obtained by aggregating the total number of customer reviews or ratings across different platforms.
15. Net promoter score (NPS)
Net Promoter Score (NPS) is a customer satisfaction metric. It measures the likelihood of customers recommending a company’s products or services to others. It is based on a single-question survey and provides a numerical score categorizing respondents into promoters, passives, and detractors.
NPS provides a concise measure of customer loyalty. By focusing on the likelihood of recommendations, businesses gain insights into how satisfied and loyal their customer base is.
Formula
NPS is determined by asking customers: “On a scale of 0 to 10, how likely are you to recommend our product/service to a friend or colleague?”
Based on their response, customers are categorized as
Promoters (score 9-10): Loyal customers who are likely to recommend.
Passives (score 7-8): Satisfied but not enthusiastic customers.
Detractors (score 0-6): Unhappy customers who may not recommend.
The NPS is calculated by subtracting the percentage of detractors from the percentage of promoters:
NPS = Percentage of Promoters−Percentage of Detractors
Conclusion
Conversion metrics provide invaluable insights into the effectiveness of marketing strategies and campaigns. Therefore, digital marketers should focus on measuring them. They help marketers understand how well they convert potential customers into actual customers.
By analyzing conversion metrics, marketers can identify strengths and weaknesses in their funnel, pinpoint areas for improvement, and make better decisions across campaigns and channels. This approach not only enhances ROI but also supports long-term growth in a competitive digital landscape.
FAQs
1. What are the different types of conversion rates?
The following are the different types of conversion rates. Website conversion rate measures the percentage of website visitors who complete a desired action. Click-through rate (CTR) indicates the percentage of people who click on a link in a marketing message or advertisement. The lead conversion rate calculates the percentage of leads generated that turn into actual customers or clients.
2. What are the seven stages of conversion?
The seven conversion stages typically include awareness, interest, consideration, intent, evaluation, purchase, and post-purchase. These stages represent the customer journey from initial awareness of a product or service to the ultimate conversion into a customer, with post-purchase reflecting ongoing engagement and potential advocacy.
3. What is the rule of conversion?
It refers to the principle of optimizing various elements such as website design, content, and user experience. It encourages visitors to take a desired action, typically leading to a measurable goal or conversion.
Wondering why each ad platform tells a different story about the same conversion? This guide breaks down cross platform marketing attribution in plain English, from models and data foundations to tools and setup steps, so you can finally connect campaigns to real pipeline and revenue.
A B2B deal may involve several contacts, months of research, paid campaigns, organic content, webinars, sales calls, product activity, and CRM updates. Last-click reporting usually gives all the credit to the final interaction, even when earlier touchpoints created demand and moved the account toward a purchase. A B2B marketing attribution platform connects marketing activity with […]
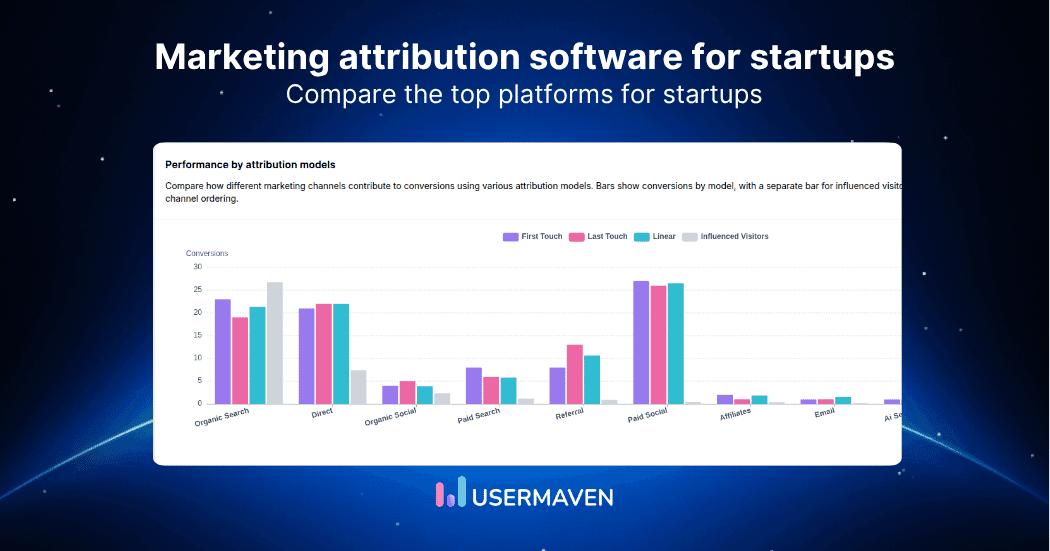
You are spending money on ads, content, and campaigns, but do you actually know which ones are driving revenue? For startups, where every dollar has to earn its keep, flying blind on marketing attribution is not just frustrating; it is expensive. Marketing attribution for startups has come a long way, but the sheer number of […]