On average, only one in three digital ads is accurately measured for performance.
That means two-thirds of your budget could be working or wasting without you even knowing it.
It’s not that marketers don’t care about measurement; it’s that most tools stop at surface-level data. They tell you how many people clicked, but not what happened next. They don’t show which channels, creatives, or audiences actually lead to conversions and long-term value.
So instead of chasing vanity metrics, let’s see how you can measure smarter. The right ad performance metrics give you clarity, control, and confidence in every dollar you spend, and they’re easier to track than you might think.
See what's working. Fix what's not. Grow faster.
Key takeaways
- Ad performance metrics help you understand what’s working. Metrics like CTR, CPC, conversion rate, and ROAS show how campaigns perform at different stages.
- More clicks don’t always mean better results. A campaign with higher costs may still be more valuable if it generates qualified leads, customers, or revenue.
- Choose metrics based on your campaign goals. Awareness campaigns need different KPIs than lead generation, ecommerce sales, or B2B revenue campaigns.
- Ad platform reports don’t always tell the full story. Different attribution settings and tracking limitations can affect reported conversions, making cross-channel measurement important.
- Connect advertising performance with business outcomes. Looking beyond clicks and leads to customer acquisition, pipeline, and revenue helps you make better budget decisions.
What are ad performance metrics?
Ad performance metrics are measurable indicators that show how well your advertising campaigns are achieving their goals. They help you evaluate everything from how many people interact with your ads to how many conversions and how much revenue those ads generate.
Common advertising KPIs include:
- Click-through rate (CTR): Measures how often people click an ad after seeing it.
- Cost per click (CPC): Shows how much you pay, on average, for each click.
- Conversion rate: Measures the percentage of visitors or interactions that result in a desired action.
- Cost per acquisition (CPA): Shows how much you spend to generate a defined conversion.
- Return on ad spend (ROAS): Compares attributed revenue with advertising spend.
Each metric answers a different question. CTR helps you assess engagement, while conversion rate and CPA help evaluate conversion efficiency. ROAS takes the analysis further by connecting advertising costs with attributed revenue.
For a more complete picture, evaluate these metrics alongside customer quality, acquisition costs, and actual business outcomes rather than relying on a single number.
1. Click-through rate (CTR)
CTR shows how many people clicked your ad after seeing it.
Formula:
CTR = (Clicks ÷ Impressions) × 100
A higher CTR usually means your message and creative are resonating. But it’s not just about getting clicks. You want the right kind of clicks from people likely to convert.
Here’s what’s considered a good CTR by platform:
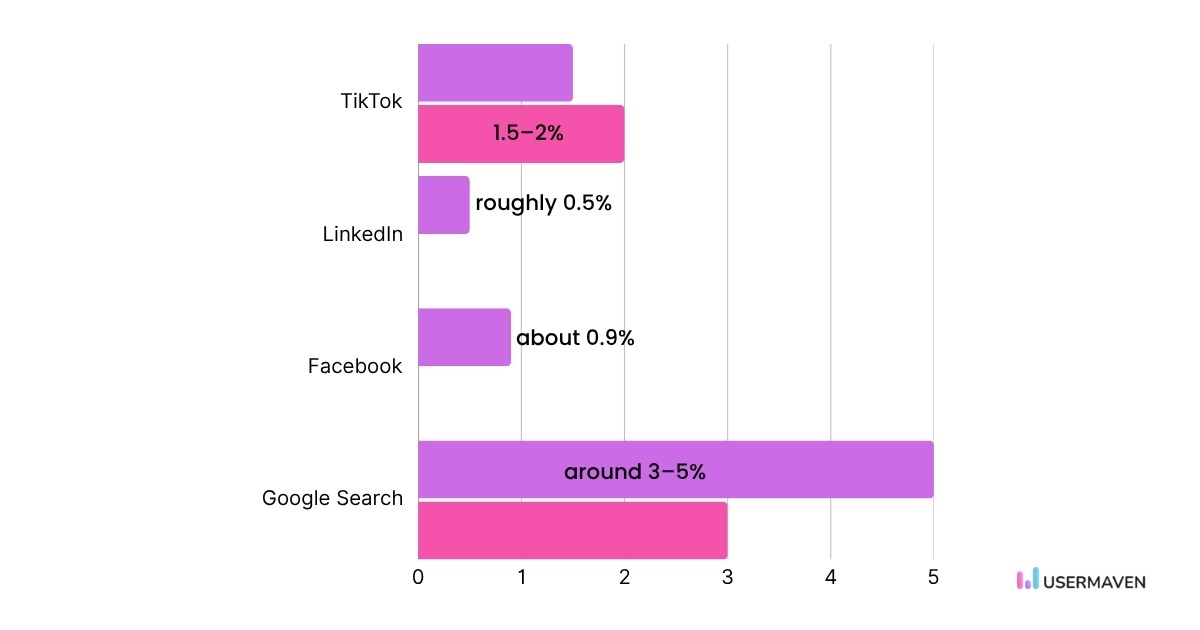
If your CTR drops, test new headlines, visuals, or audiences. Usermaven’s funnel tracking can show how different ad creatives influence each stage of your conversion path. Producing those fresh creatives quickly is where an AI ad maker helps, letting you generate new video and image ad variations in minutes without waiting on a design team.
2. Cost per click (CPC)
CPC tells you how much you pay every time someone clicks on your ad.
Formula:
CPC = Total Spend ÷ Clicks
CPC helps you understand how competitive your ad placements are. A lower CPC means you’re attracting traffic more efficiently.
But here’s the trap: low CPC doesn’t always mean better results. A cheap click that never converts is still wasted spend.
By using paid ad attribution in Usermaven, you can see which clicks turn into customers, not just visits, across all ad platforms.
3. Conversion rate (CVR)
Conversion rate measures how many people took your desired action after clicking an ad, like signing up or making a purchase.
Formula:
CVR = (Conversions ÷ Clicks) × 100
A low CVR might mean your landing page isn’t persuasive enough or your offer doesn’t match the ad’s promise.
4. Return on ad spend (ROAS)
Return on ad spend measures how much revenue you earn for every dollar spent on advertising. It shows the direct financial return of your ad campaigns and helps evaluate their profitability.
Formula:
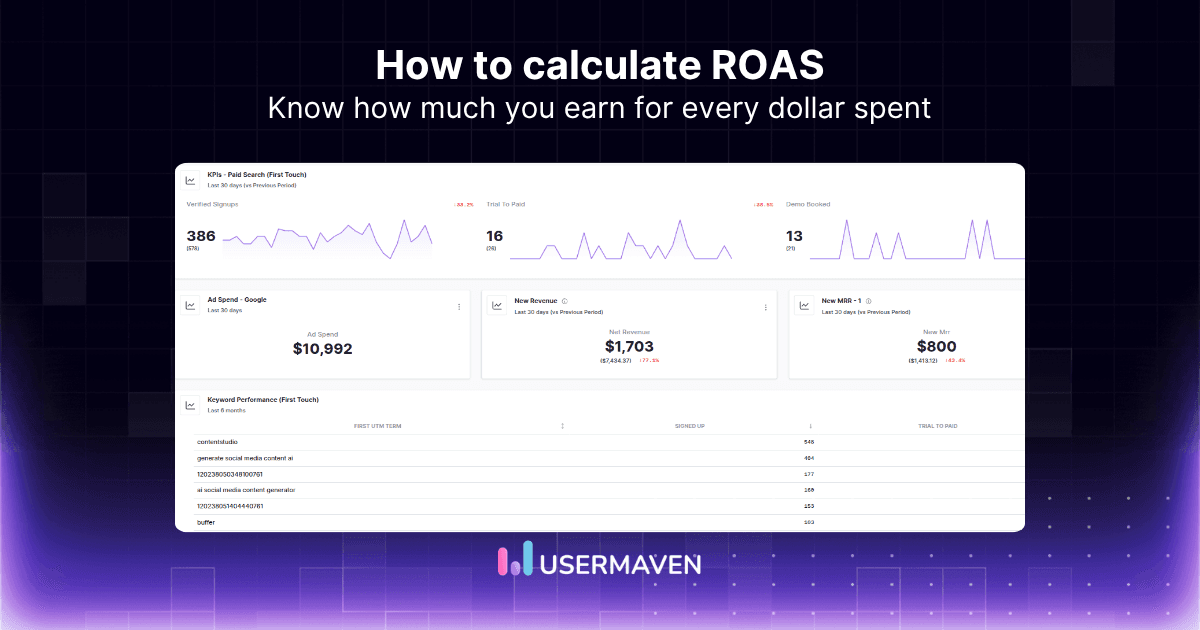
ROAS = Revenue ÷ Ad Spend
If you spend $1,000 and earn $4,000, your ROAS is 4x.
Good ROAS depends on your business type. Ecommerce brands often aim for 4–8x, while SaaS companies may focus on long-term LTV (lifetime value) instead.
With Usermaven’s ad attribution software, you can compare ROAS across all platforms in one dashboard and identify your highest-performing campaigns.
5. Cost per acquisition (CPA)
CPA tells you how much it costs to acquire one paying customer or lead.
Formula:
CPA = Total Spend ÷ Conversions
This is one of the most important performance metrics for ad campaigns. It directly connects your marketing cost to actual business growth.
For instance, if your Facebook ads bring new customers at $20 each, but your Google campaigns cost $50 per customer, you know where to invest more.
Pro tip: Don’t confuse cost per acquisition with customer acquisition cost. CPA shows what you spend to get a conversion from ads, while CAC includes all costs (marketing and sales) to get a paying customer.
6. Customer lifetime value (LTV)
LTV measures how much revenue a customer brings over time.
A simple rule:
If your LTV is much higher than your CPA, you’re on the right track.
For ecommerce, that might mean repeat purchases. For SaaS, it’s recurring subscriptions.
With Usermaven’s funnel and cohort tracking, you can see how ad-acquired customers behave months after they convert. This helps you adjust your average acquisition costs realistically.
7. Engagement rate
This metric shows how people interact with your ads, likes, comments, shares, or saves.
Formula:
Engagement rate = (Total Interactions ÷ Impressions) × 100
It’s especially useful for social media ad performance metrics like TikTok, Instagram, and LinkedIn.
A high engagement rate means your audience cares about your content. It doesn’t always drive immediate sales, but it improves brand recall and future conversions.
8. Impression share and reach
Impression share tells you how often your ads show compared to competitors bidding on the same audience.
Low impression share usually means you’re being outbid or limited by budget.
Reach helps you understand how many unique people actually saw your ad. Monitoring these numbers prevents overspending on the same audience and helps detect ad fatigue.
Platform-specific ad performance metrics
Every ad platform measures success a little differently.
Understanding how each one defines performance helps you spot hidden opportunities and compare results more accurately.
Here’s a breakdown of key metrics by platform, explained in the same detail as the earlier ones.
Facebook and Instagram ad metrics
9. Ad frequency
Ad frequency measures how often the same person sees your ad.
Formula:
Frequency = Impressions ÷ Reach
If the number is too high, people may start ignoring your ad, leading to lower engagement or even ad fatigue.
A frequency of 1.5 to 3 is usually healthy for most campaigns.
When it goes above 5, consider refreshing your creative or adjusting targeting.
10. Quality ranking
Meta assigns a quality ranking score to show how your ad compares with others targeting the same audience.
It factors in expected engagement, feedback, and click performance.
A high-quality ranking means your ad feels relevant and valuable to users, which can reduce CPC and improve ROAS.
If your ranking drops, review comments and hide negative feedback, then test new creative angles.
LinkedIn ad metrics
11. Lead generation form open rate
This shows how many people open your LinkedIn lead gen form after seeing your ad.
Formula:
Open rate = (Form opens ÷ Ad impressions) × 100
A low open rate might mean your headline or call-to-action isn’t strong enough to spark curiosity. Test new hooks or form intros to boost performance.
12. Lead generation form completion rate
Once someone opens your form, the completion rate shows how many actually fill it out and submit it.
Formula:
Completion rate = (Form submissions ÷ Form opens) × 100
A high drop-off between opens and submissions usually means the form is too long or the incentive isn’t clear.
Shorter forms tend to convert better, especially on mobile.
However, not every form submission is a qualified lead. For B2B campaigns, it’s important to look beyond lead volume and track how many leads become sales opportunities or paying customers. A campaign generating fewer but higher-quality leads may deliver better results.
13. Cost per lead (CPL)
CPL tells you how much it costs to acquire one qualified lead from your campaign.
Formula:
CPL = Total Spend ÷ Number of Leads
It’s important for SaaS and B2B marketers running LinkedIn campaigns. If your CPL is rising, look at targeting filters, bidding, or creative relevance.
Pair CPL with lead-to-customer conversion rates inside Usermaven to see which leads turn into paying users.
For a clearer picture of lead quality, also track cost per qualified lead (CPQL). Unlike CPL, which includes all leads generated, CPQL measures how much you spend to acquire leads that meet your qualification criteria.
CPQL = Total ad spend ÷ Number of qualified leads
This is particularly useful for B2B SaaS companies where generating qualified sales opportunities matters more than collecting form submissions.
Google Ads performance metrics
14. Quality score
Quality Score is a diagnostic metric in Google Ads that helps you evaluate the relevance and quality of your search ads compared with other advertisers.
It’s based on three components:
- Expected click-through rate: How likely your ad is to receive clicks.
- Ad relevance: How closely your ad matches the user’s search intent.
- Landing page experience: How relevant and useful your landing page is.
Quality Score is measured on a scale of 1 to 10. While it can help identify areas for improvement, it isn’t a direct input into Google’s ad auction and doesn’t guarantee lower CPC or better campaign results.
Tip: Use consistent messaging between your keywords, ad copy, and landing page content.
Usermaven helps connect this performance data to real conversions, so you can see whether high-quality scores actually lead to better return on investment (ROI).
15. Search impression share
This metric tells you how often your ad appeared compared to how often it could have appeared.
Formula:
Search impression share = (Impressions ÷ Total eligible impressions) × 100
A low number means competitors are outranking you. In that case, increase your bids or improve ad relevance to capture more impressions.
Tracking this alongside conversion rate in Usermaven shows whether increased visibility is translating to more paying customers.
16. Cost per conversion
Cost per conversion measures how much you spend, on average, to generate a conversion in Google Ads.
Cost per conversion = Total eligible ad cost ÷ Number of conversions
For example, if your campaign spends $1,000 and generates 50 conversions, your average cost per conversion is $20.
This measures how much you spend for each completed conversion, whether that’s a signup, sale, or download.
It’s one of the best ways to evaluate the efficiency of your Google Ads campaigns. If it’s too high, refine your keyword match types or improve your landing page quality.
Usermaven lets you trace these conversions beyond Google’s data, linking them through cross-channel attribution to reveal the full customer journey.
17. Top impression rate
This shows how often your ads appear at the top of search results.
Formula:
Top impression rate = (Top impressions ÷ Total impressions) × 100
Higher top impression rates usually mean better visibility and higher CTR. If your top impression rate is low, competitors may be outbidding you.
Adjust your budget or improve ad quality to compete.
See what's working. Fix what's not. Grow faster.
TikTok ad performance metrics
If you already have high-performing static creatives, image to video AI can help convert them into motion-based hooks for TikTok, Reels, or Shorts tests.
18. Watch time per view
Watch time per view shows how long people stay on your video ad before scrolling away.
The longer the average watch time, the more engaging your content is. TikTok’s algorithm favors ads that keep people watching.
For video ads specifically, using an auto-caption generator can significantly boost engagement by ensuring your message reaches the 80% of mobile users who browse social feeds with the sound turned off.
Tip: Hook viewers in the first three seconds with clear motion or storytelling.
19. Click-to-play ratio
This shows how many users clicked to play your video after seeing it in their feed.
Formula:
Click-to-play ratio = (Clicks to play ÷ Impressions) × 100
It helps measure how strong your thumbnail and opening visuals are. Low click-to-play often means your cover ima ge or headline needs improvement.
20. Retention rate
Retention rate tracks how many viewers watch your ad all the way through.
Formula:
Retention rate = (Full video views ÷ Total views) × 100
This is key for measuring storytelling quality.
A high retention rate means your message held attention until the end, great for brand awareness and algorithm performance.
Ecommerce ad performance metrics
21. Average Order Value (AOV)
Average order value measures how much customers spend on average per transaction.
Formula:
AOV = Total Revenue ÷ Number of Orders
It’s key to understanding the profitability of your ad campaigns. Sometimes, a campaign with fewer conversions but a higher AOV can generate more total revenue.
Usermaven attributes every order back to the originating ad, helping you identify which campaigns attract high-value customers.
22. Purchase Frequency
Purchase frequency shows how often customers return to buy again.
Formula:
Purchase Frequency = Total Orders ÷ Unique Customers
It’s an important metric for retention and long-term ROI. Ads that attract loyal, repeat customers often outperform those that bring in one-time buyers.
Usermaven’s cohort tracking reveals how ad-acquired customers behave over time, so you can invest more in campaigns that drive repeat purchases.
23. Cart Abandonment Rate
Cart abandonment rate measures how many users add items to their cart but leave before completing the purchase.
Formula:
Cart Abandonment Rate = [(Carts Created – Purchases Completed) ÷ Carts Created] × 100
A high abandonment rate could mean your checkout process is too long, shipping costs are too high, or your site isn’t mobile-friendly.
Usermaven tracks the full conversion funnel, so you can see where shoppers drop off and which ad sources bring users most likely to complete their purchase.
How Usermaven simplifies ad performance tracking
Tracking dozens of ad performance metrics across multiple platforms can quickly get messy. Each platform has its own dashboard, attribution logic, and reporting delay.
That’s where Usermaven makes things easier.
Usermaven is an AI-powered marketing attribution platform that helps you connect advertising performance with customer journeys, conversions, pipeline, and revenue.
Here’s how:
Direct integration with ad platforms
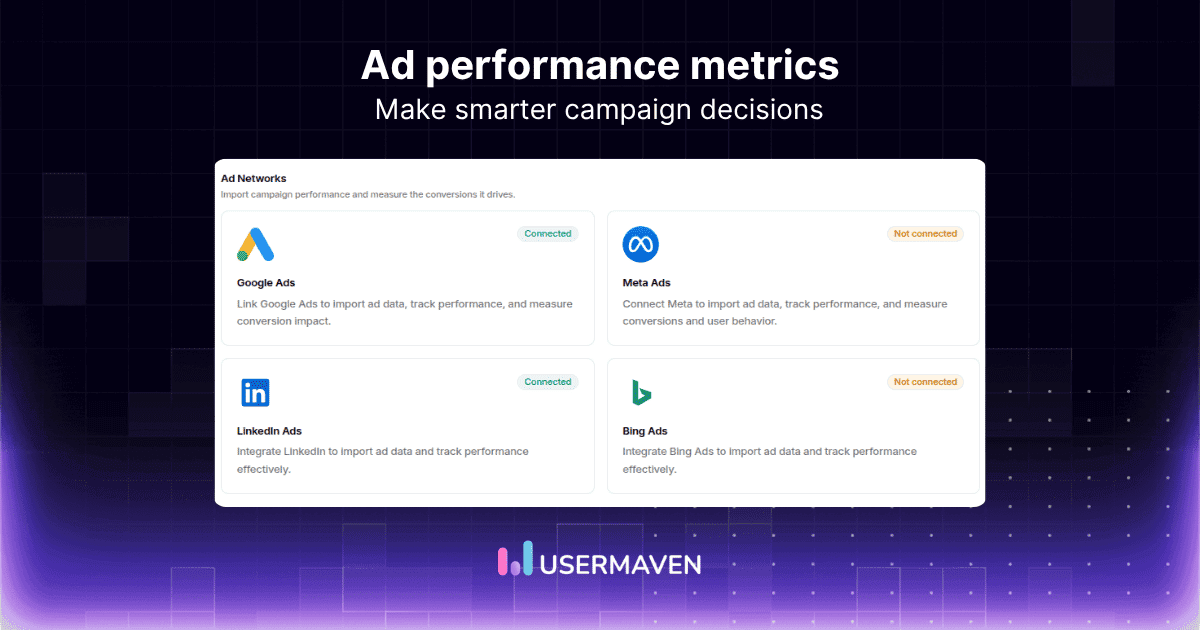
Usermaven directly integrates with all major ad platforms, including Meta (Facebook and Instagram), Google Ads, LinkedIn, and Microsoft Ads.
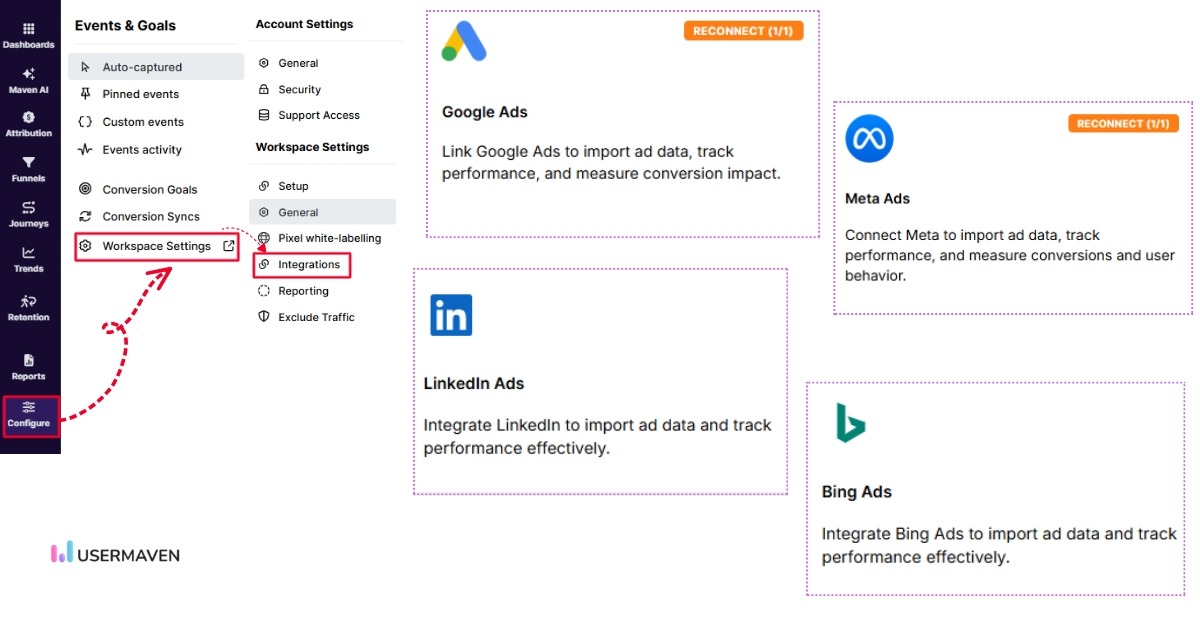
That means you don’t have to combine reports or switch between dashboards manually. Usermaven automatically imports your campaign data, ad spend, and click metrics into one unified analytics view.
The result:
- You can compare cross-platform performance side by side.
- Understand how your ads work together across paid, organic, and referral channels.
- Eliminate data silos between marketing teams and performance analysts.
These integrations make it easier to connect marketing efforts across platforms and view ad metrics in the context of your full customer journey.
Paid ads attribution
Most ad platforms credit the last click before a purchase. But real buyer journeys aren’t that simple; customers might see a Facebook ad, click a Google ad later, and finally convert through an email or a direct visit.
Usermaven’s paid ads attribution untangles that mess. It tracks all customer journey touchpoints from the first impression to the final conversion and assigns credit accurately.
This helps you understand which platforms and campaigns truly contribute to conversions instead of relying on misleading last-click data.
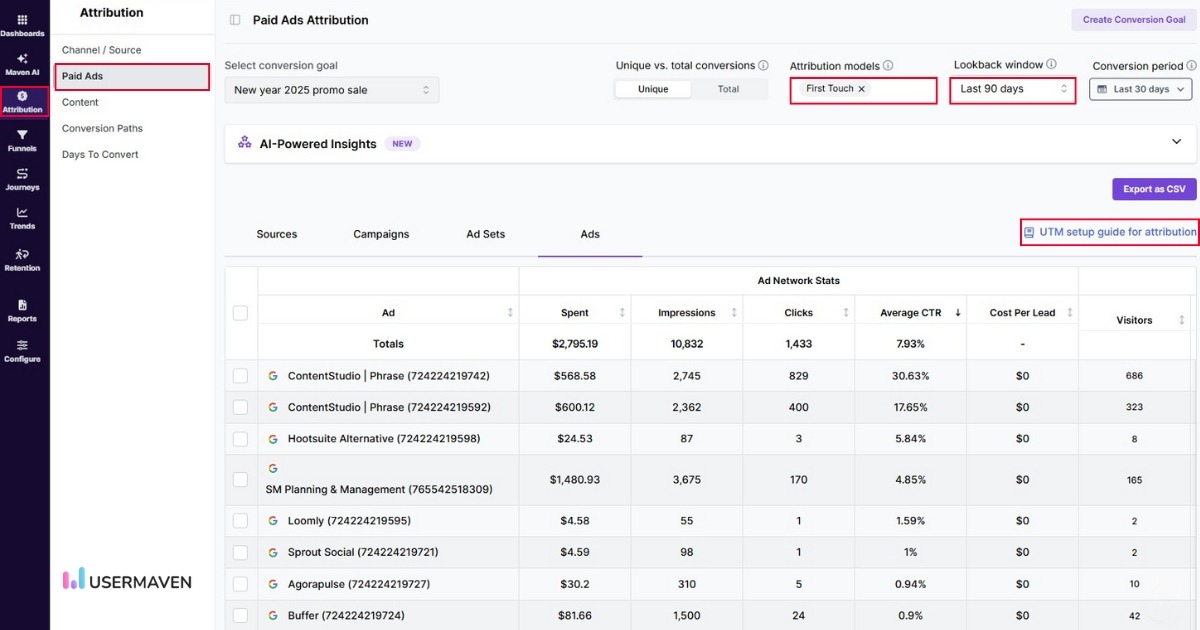
With multi-touch attribution models, you can see:
- Which channels generate awareness vs. drive conversions
- How each campaign contributes to the funnel
- Where your ad spend has the highest impact
Conversion syncs back to ad platforms
Most analytics tools stop at tracking conversions.
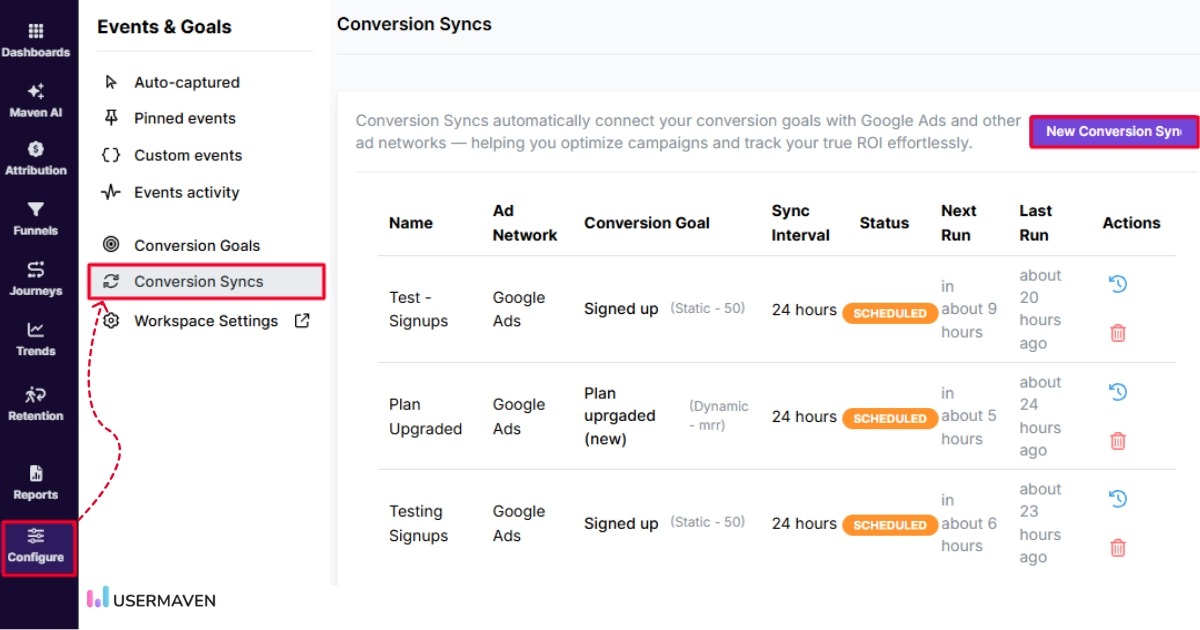
Usermaven’s conversion syncs take it a step further by automatically sending your conversion data back to ad platforms like Meta and Google.
This creates a powerful feedback loop that helps these platforms optimize campaign delivery in real time. When you sync conversions, their algorithms learn which users are most likely to convert, which in turn improves targeting precision and gradually lowers your CPA.
Conversion syncs improve ad performance if you are using it continuously. Every synced conversion helps your ad platforms get smarter, ensuring your campaigns reach the right audience at the right time.
Go to Configure → Conversion Syncs, then click Add New Conversion Sync. Choose the conversion event you want to send back to your ad platform and track its performance results inside Paid Ads Attribution.
To sum it up,
Every click tells a story, but not every story is worth paying for. By tracking the right ad performance metrics, you learn which campaigns bring in loyal customers and which just burn cash.
Usermaven helps you see the complete picture. With ads attribution, funnel tracking, and conversion syncs, it connects every impression, click, and purchase into one clear line of insight.
Ready to see where your ad spend really goes?
Book a demo with Usermmaven now and take control of your ad performance from click to conversion.
Maximize your ROI
with accurate attribution
FAQs
What is the difference between ad metrics and KPIs?
Ad metrics are the individual numbers that show how your ads are performing, such as CTR, CPC, or ROAS.
KPIs (Key Performance Indicators) are the bigger goals tied to business success, such as revenue growth or customer acquisition.
How often should I review my ad performance metrics?
For most campaigns, reviewing metrics weekly gives you enough data to spot trends without reacting too early. However, if you’re running high-spend or short-term campaigns, check daily to make quick optimizations.
What’s the best way to compare ad performance across multiple platforms?
Compare campaigns using consistent conversion goals, attribution windows, and business outcomes. Since platforms like Google Ads, Meta Ads, and LinkedIn Ads use different reporting methods, their conversion numbers may not match.
A marketing attribution platform like Usermaven helps you connect supported advertising data with customer journeys, conversions, and revenue, making it easier to evaluate performance across channels.
Can small businesses or startups use ad performance metrics effectively?
Yes. Even with a limited advertising budget, businesses can track essential metrics like CTR, CPC, conversion rate, and CPA to understand campaign performance.
Start with metrics that match your goals, then expand your reporting as your campaigns grow. For businesses running multiple campaigns, Usermaven can help connect marketing performance with conversions and revenue.

Written by
Imrana Essa
SaaS Marketing Lead
Imrana Essa is a marketing lead and content strategist with 8+ years of experience creating and leading content for B2B and SaaS brands. She specializes in marketing analytics, attribution, content strategy, and organic growth, translating complex marketing concepts into clear, actionable insights. Her work focuses on helping marketers understand performance, make data-informed decisions, and build strategies that contribute to sustainable growth.
All articles by Imrana →