Digital marketing has become more competitive, more expensive, and more complex. Without clear digital marketing metrics and KPIs, it is almost impossible to know whether your campaigns are profitable or just consuming budget.
Here are the digital marketing metrics and KPIs you need to track in 2026 to stay competitive and accountable.
1. Conversion rate
Conversion rate is one of the most important KPIs in digital marketing because it directly measures how effectively your traffic turns into results.
It represents the percentage of visitors who complete a desired action, such as:
This digital marketing KPI helps you evaluate landing page performance, campaign effectiveness, and overall funnel efficiency.
Why it matters:
A high conversion rate means your messaging, targeting, and user experience are aligned. A drop in conversion rate signals friction in the customer journey.
For most businesses, improving conversion rate has a greater impact than simply increasing traffic.
CAC = Total marketing and sales costs / Number of new customers acquired
CAC is a critical KPI for digital marketing measurement because it determines profitability.
Why it matters:
If your CAC is higher than your customer lifetime value, your marketing strategy is unsustainable. Reducing CAC while maintaining conversion quality improves long-term growth.
This KPI connects marketing performance directly to business outcomes.
3. Return on investment (ROI)
Return on investment (ROI) measures the profitability of your marketing campaigns.
It tells you whether your digital marketing efforts are generating more revenue than they cost.
Formula:
ROI (%) = (Net profit from campaign / Campaign cost) × 100
ROI is a strategic digital marketing KPI used by leadership to evaluate performance across channels.
Why it matters:
A positive ROI means your campaigns are profitable. A negative ROI means you are losing money, even if engagement or traffic looks strong.
ROI shifts the focus from vanity metrics to actual financial impact.
Wondering how much revenue each customer brings over time? Use our free customer lifetime value calculator to estimate CLV and plan smarter growth strategies.
CTR (%) = (Total clicks / Total impressions) × 100
CTR is a leading KPI in digital marketing because it predicts downstream performance.
Why it matters:
A high CTR indicates that your messaging, targeting, and creative are compelling. A low CTR suggests weak positioning or irrelevant audience targeting.
Improving CTR often leads to:
Lower cost per click
Higher quality traffic
Better conversion rates
Drive business growth with AI-powered analytics
*No credit card required
6. Cost per lead (CPL)
Cost per lead (CPL) measures how much you spend to acquire a single lead through your marketing efforts.
It is one of the most important KPIs for digital marketing campaigns focused on lead generation.
A low CPL indicates cost-efficient lead generation. However, CPL should always be evaluated alongside lead quality. Cheap leads that do not convert into customers can inflate performance without driving revenue.
For B2B and SaaS businesses, CPL is a core digital marketing performance metric.
7. Marketing qualified leads (MQLs)
Marketing qualified leads are leads that have demonstrated a higher likelihood of becoming customers based on predefined criteria.
These criteria may include:
Downloading gated content
Visiting pricing pages
Engaging with multiple emails
Repeated website visits
MQLs are a strategic KPI in digital marketing because they align marketing efforts with sales outcomes.
Why it matters:
Tracking total leads alone is misleading. MQLs measure intent, not just activity. An increase in MQLs often signals stronger targeting and improved content relevance.
This KPI is essential for digital marketing measurement in growth-focused teams.
8. Customer retention rate
Customer retention rate measures the percentage of customers who continue doing business with you over a specific period.
Retention is often overlooked, but it is one of the strongest indicators of sustainable growth.
Formula:
Retention rate (%) = ((Customers at end of period − New customers) / Customers at start of period) × 100
Why it matters:
Acquiring new customers is more expensive than retaining existing ones. A high retention rate increases customer lifetime value and improves overall ROI.
For subscription-based or SaaS companies, retention is a critical digital marketing KPI tied directly to profitability.
9. Churn rate
Churn rate measures the percentage of customers who stop using your product or service within a given period.
Formula:
Churn rate (%) = (Customers lost during period / Total customers at start of period) × 100
Churn is the inverse of retention.
Why it matters:
High churn cancels out acquisition gains. If your churn analysis shows an increase, your digital marketing performance may appear strong at the top of the funnel but weak at the bottom.
Reducing churn improves long-term marketing efficiency and revenue stability.
Churn is a key KPI for digital marketing teams working closely with product and customer success.
10. Revenue per channel
Revenue per channel measures how much revenue each marketing channel generates.
Examples of channels include:
Organic search
Paid search
Social media
Email marketing
Referral traffic
This KPI connects digital marketing metrics directly to financial outcomes.
Why it matters: Not all traffic sources contribute equally. Revenue per channel helps identify where to scale investment and where to reduce spend.
It measures how quickly your website traffic from search engines is increasing over time.
Unlike total traffic, this KPI tracks momentum and SEO metrics effectiveness.
Formula:
Organic Traffic Growth Rate (%) = ((Current Period Organic Traffic − Previous period organic traffic) / Previous period organic traffic) × 100
Why it matters:
Organic traffic is one of the most sustainable acquisition channels. A consistent growth rate indicates a strong website’s SEO strategy, improving search visibility, and better keyword targeting.
As a digital marketing KPI, it reflects long-term performance rather than short-term campaign spikes.
12. Engagement rate
Engagement rate measures how actively users interact with your content, ads, or website.
Depending on the platform, engagement may include:
Engagement Rate (%) = (Total Engagements / Total Impressions or Users) × 100
Why it matters: High engagement suggests strong audience alignment and relevant messaging. Low engagement may indicate poor targeting or weak content positioning. Strong engagement is a key factor in driving digital success and increasing customer loyalty.
Engagement rate is a leading KPI in digital marketing because it predicts downstream metrics like conversions and retention.
13. Average session duration
It measures the average amount of time users spend on your website during a visit.
Longer session duration often indicates that visitors find value in your content. However, it must be analyzed alongside conversion metrics to determine whether engagement leads to results.
In digital marketing measurement, this KPI helps evaluate landing page quality and content effectiveness.
14. Bounce rate
Bounce rate measures the percentage of visitors who leave your website after viewing only one page.
A high bounce rate may signal poor user experience, irrelevant traffic, slow load speed, or mismatched search intent.
However, bounce rate must be interpreted in context. For informational blog pages, a higher bounce rate may be normal. For product or pricing pages, it may indicate friction.
As a digital marketing performance metric, bounce rate helps identify pages that require optimization.
15. Cost per acquisition (CPA)
Cost per acquisition measures the average cost required to generate a conversion or customer.
While similar to CAC, CPA often focuses on campaign-level acquisition rather than total business acquisition costs.
Formula:
CPA = Total campaign spend / Total conversions
Why it matters:
CPA helps optimize paid campaigns and advertising efficiency. Lower CPA with maintained conversion quality improves ROI.
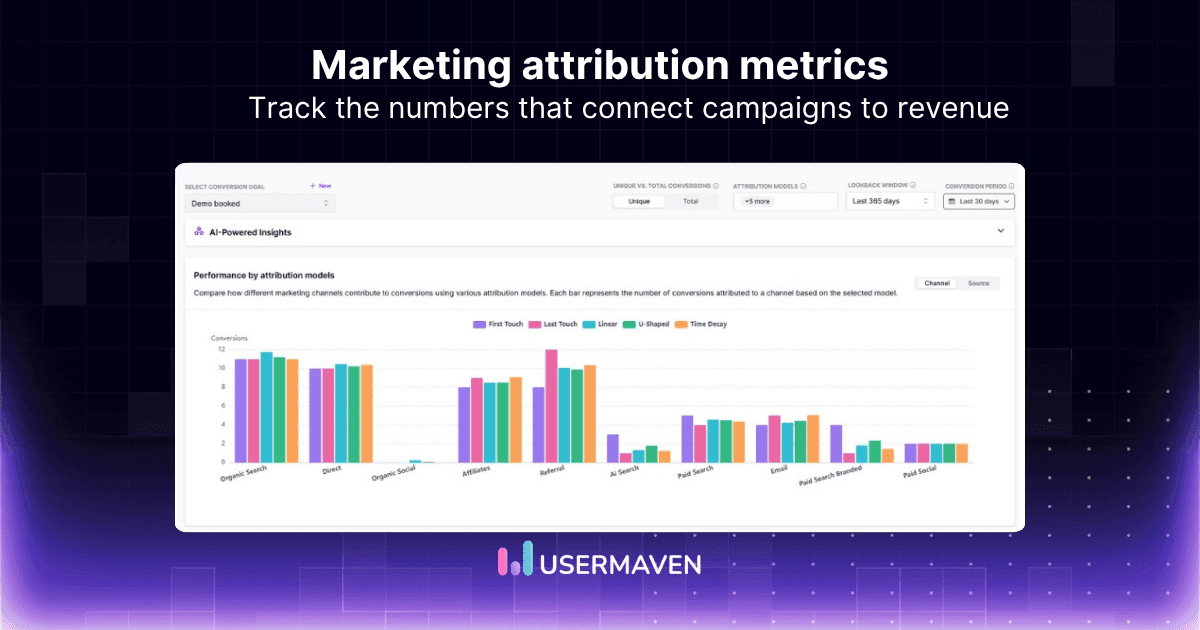
It measures how much revenue can be credited to specific marketing channels or touchpoints.
Unlike simple “revenue per channel,” this KPI accounts for multi-touch attribution in customer journeys, where users interact with several channels before converting.
Modern digital marketing measurement requires understanding how channels work together, not in isolation. Revenue attribution helps allocate budget effectively and identify high-impact touchpoints.
For growth-focused teams, this KPI prevents over-investing in channels that appear strong but do not contribute to final conversions.
For growth-focused teams, this KPI is where Usermaven works as marketing attribution software: it shows which channels and touchpoints actually create revenue, not just which ones look active before the final conversion.
17. Funnel conversion rate
Funnel conversion rate measures how efficiently users move from one stage of the marketing funnel to the next.
Examples:
Visitor → Lead
Lead → MQL
MQL → Customer
Trial → Paid User
Why it matters:
The overall conversion rate can hide bottlenecks. Funnel conversion rates identify exactly where users drop off.
This KPI is critical for digital marketing optimization because small improvements at one stage can significantly increase total revenue.
Lead-to-Customer Rate measures the percentage of leads that ultimately become paying customers.
Formula:
Lead-to-customer rate (%) = (Customers / Total leads) × 100
Why it matters:
High lead volume does not always equal high revenue. This KPI evaluates lead quality and alignment between marketing and sales.
If this rate is low, your targeting or qualification criteria may need refinement.
It is a powerful KPI in digital marketing because it directly connects top-of-funnel activity to bottom-of-funnel revenue.
19. Average revenue per user (ARPU)
Average revenue per user (ARPU) measures how much revenue, on average, each customer generates during a given period.
Formula:
ARPU = Total revenue / Total active users
Why it matters:
ARPU helps assess pricing strategy, upsell effectiveness, and monetization efficiency.
When combined with retention rate and CLV, ARPU provides a clear picture of sustainable growth.
For subscription-based and SaaS businesses, ARPU is one of the most important financial KPIs in digital marketing performance measurement.
20. Return on ad spend (ROAS)
Return on ad spend measures the revenue generated for every dollar spent on advertising.
Formula:
ROAS = Revenue from ads / Cost of ads
Why it matters: ROAS is more granular than overall ROI and focuses specifically on paid advertising efficiency. It is one of the most important ad performance metrics for evaluating the success of paid campaigns.
A ROAS of 4:1 means that for every $1 spent, $4 in revenue was generated.
This KPI goes deeper than open rate because it measures actual engagement.
Why it matters:
A strong click rate indicates that your content and call-to-action are compelling.
Email click rate connects directly to conversion-focused digital marketing KPIs and helps evaluate campaign relevance.
Tracking both open rate and click rate provides a full view of email performance.
23. Impressions
Impressions measure how many times your content, ad, or webpage is displayed to users.
Unlike clicks or conversions, impressions focus purely on visibility.
Why it matters:
Impressions are a top-of-funnel digital marketing KPI that reflects brand exposure and campaign reach, helping measure the impact of your branding strategies across channels.
High impressions with low clicks may indicate:
Weak messaging
Poor targeting
Low creative appeal
Impressions are especially important in paid advertising and social media campaigns.
Digital marketing KPI benchmarks
To measure success effectively, you need context. These benchmark ranges provide a practical reference point for evaluating your digital marketing performance.
General performance benchmarks
KPI
Typical benchmark range
Conversion rate
2% – 5% (ecommerce), 3% – 7% (B2B lead gen)
Customer acquisition cost (CAC)
Varies by industry; should be significantly lower than CLV
ROI
Positive ROI; 5:1 ratio often considered strong
Return on ad spend (ROAS)
3:1 to 5:1
Customer lifetime value (CLV) to CAC ratio
3:1 or higher
Average revenue per user (ARPU)
Industry dependent
Lead generation benchmarks
KPI
Typical benchmark range
Cost per lead (CPL)
$30 – $200+ depending on industry
Lead-to-customer rate
2% – 10% (higher for high-intent channels)
Marketing qualified leads (MQL growth)
20% – 40% YoY growth
Funnel conversion rate (stage to stage)
20% – 40% between major funnel steps
Traffic and engagement benchmarks
KPI
Typical benchmark range
Organic traffic growth rate
10% – 30% YoY
Engagement rate (website/content)
60% – 70% active engagement
Average session duration
2 – 4 minutes
Bounce rate
40% – 60% (content sites), lower for product pages
Pages per session
2 – 4 pages
Paid and email benchmarks
KPI
Typical benchmark range
Click-through rate (CTR) – SEO
3% – 10% (position dependent)
Click-through rate (CTR) – paid ads
1% – 3%
Email click rate
2% – 5%
Cost per acquisition (CPA)
Industry dependent; must support positive ROAS
Impressions growth
Steady month-over-month increase
Retention and loyalty benchmarks
KPI
Typical benchmark range
Customer retention rate
70% – 90% (SaaS/subscription higher)
Churn rate
< 5% monthly (SaaS benchmark varies)
Net promoter score (NPS)
30+ good, 50+ excellent
See what's working. Fix what's not. Grow faster.
*No credit card required
The best tool to measure digital marketing metrics and KPIs
Tracking digital marketing metrics and KPIs across multiple channels can quickly become fragmented. Traffic may be measured in one tool, ad performance in another, product usage in a third, and attribution in yet another dashboard.
This disconnect makes accurate digital marketing measurement difficult and often leads to incomplete performance insights.
To measure marketing performance effectively in 2026, you need a unified analytics platform that connects traffic, engagement, conversions, revenue, and attribution in one place.
Usermaven
Usermavenis built to measure digital marketing metrics and KPIs across the entire user journey. It eliminates data silos and provides a complete view of marketing performance from first visit to revenue.
It covers:
Website and product analytics
Track website traffic, user behavior, engagement metrics, session duration, bounce rate, and funnel movement. Monitor how users interact with both marketing pages and product experiences without complex setup.
SEO analytics
Measure organic traffic growth, keyword-driven performance, landing page effectiveness, and search-driven conversions. Understand SEO attribution and how it contributes to pipeline and revenue, not just visibility.
Paid advertising analytics
Track performance metrics such as CTR, CPC, CPA, ROAS, and campaign-level conversions. Connect ad spend directly to revenue outcomes and optimize based on profitability, not vanity metrics.
Marketing attribution and reporting
Use multi-touch attribution models to understand how different channels contribute to conversions. Generate performance reports that align marketing activity with business objectives.
Instead of juggling multiple dashboards, Usermaven allows marketing teams to measure, analyze, and optimize all digital marketing KPIs from a single analytics dashboard.
This unified approach improves decision-making, reduces reporting complexity, and ensures that every digital marketing performance metric is tied back to measurable business impact.
Turn your marketing data into results!
Digital marketing metrics and KPIs give clarity to performance. When you track the right indicators, you understand what drives traffic, engagement, conversions, and revenue. Strong digital marketing measurement turns raw data into strategic decisions.
Usermaven brings all your marketing data into one place, connecting traffic, SEO, paid campaigns, product analytics, and attribution. As a powerful website analytics tool, it helps you measure the KPIs that matter and align marketing performance with business growth.
Ready to track your digital marketing performance with complete visibility?
Sign up for free or book a demo today with Usermaven to gain complete visibility into your marketing performance.
See Usermaven in action
Book a free demo and discover how powerful analytics can grow your business.
*No credit card required
FAQs
1. What is the difference between a metric and a KPI in digital marketing?
A metric tracks a specific activity, while a KPI measures progress toward a defined business objective. For example, pageviews and click-through rate are digital marketing metrics. Revenue growth and customer acquisition cost are digital marketing KPIs because they directly reflect business performance. Every KPI is a metric, but not every metric qualifies as a KPI. A KPI must be tied to a measurable goal such as revenue, lead generation, or retention.
2. How many digital marketing KPIs should you track?
Most businesses should focus on 5 to 10 core digital marketing KPIs at a time. Tracking too many metrics can dilute focus and make decision-making harder. Instead, choose KPIs that directly align with your primary objective, whether that is revenue growth, customer acquisition, retention, or brand awareness. A smaller, focused KPI set improves clarity and execution.
3. What are leading and lagging KPIs in digital marketing?
Leading KPIs predict future performance. Examples include engagement rate, CTR, and organic traffic growth. These indicators help optimize campaigns early. Lagging KPIs measure final outcomes. Examples include revenue, ROI, and customer acquisition cost. These confirm whether your marketing strategy was profitable. An effective digital marketing measurement strategy includes both leading and lagging KPIs.
4. Which digital marketing KPIs matter most for revenue growth?
Revenue-focused businesses should prioritize:
• Conversion rate • Customer acquisition cost • Customer lifetime value • Return on investment • Return on ad spend • Lead-to-customer rate
These KPIs connect marketing performance directly to profitability and long-term growth.
A campaign produces thousands of clicks, hundreds of conversions, and a low cost per lead. The advertising dashboard looks successful. The CRM tells a different story. Few leads become qualified opportunities, closed revenue remains low, and many of the customers acquired through the campaign cancel within their first few months. This difference exists because campaign […]
A SaaS marketing attribution strategy explains how campaigns, customer interactions, product activity, and sales touchpoints receive credit for pipeline and revenue. Building that strategy is difficult because SaaS journeys rarely end at a form submission or signup. A prospect may discover the brand through content, return through paid search, start a trial, activate a feature, […]
Wondering why your dashboards never agree on which channels drive SaaS growth? This guide unpacks 12 real-world SaaS marketing attribution challenges and shows how to fix them, so you can tie campaigns to pipeline, revenue, and retention with a lot more confidence.