Enterprise data rarely sits in one system. Financial results may live in an ERP, customer activity in a CRM, product usage in separate software, and marketing data across several advertising platforms.
Enterprise performance analytics tools connect these sources so leaders can monitor results, investigate changes, and make decisions from a more consistent view.
A strong performance analytics strategy goes beyond displaying charts. It connects metrics with the activities, customers, products, and business processes responsible for them.
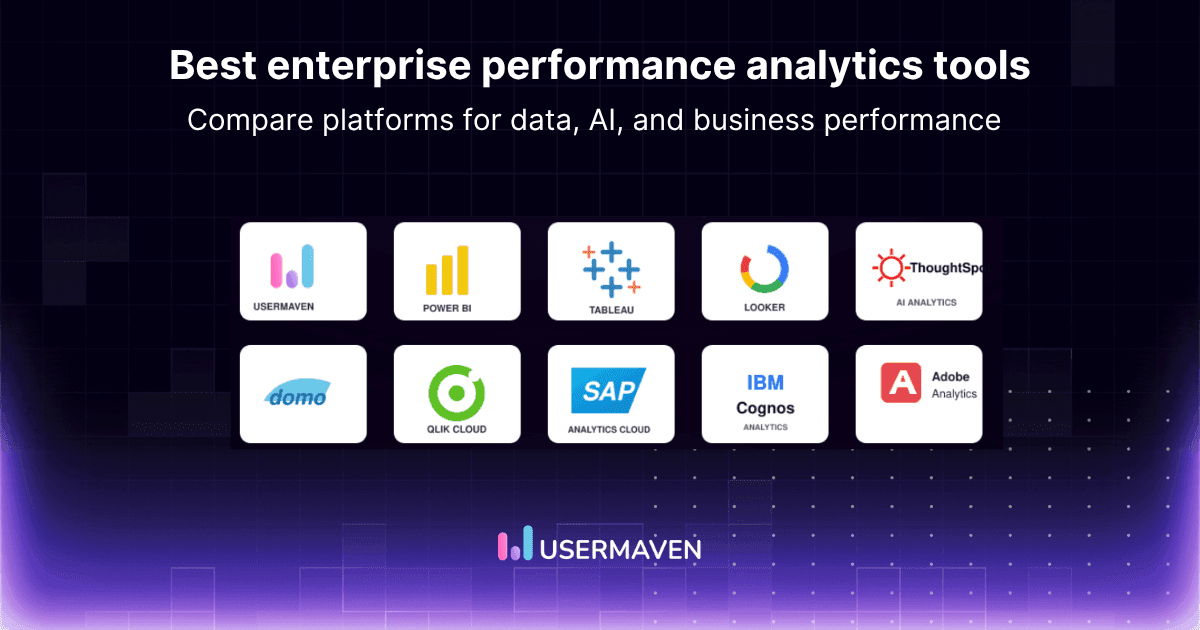
This guide compares ten platforms across data integration, dashboards, artificial intelligence, governance, scalability, deployment, pricing, and ideal enterprise use case.
Key takeaways
Different platforms solve different problems: Power BI and Tableau support broad business intelligence, while Adobe Analytics and Usermaven focus more closely on digital customer performance.
Governance matters as much as visualization: Enterprise teams need consistent metric definitions, access controls, auditability, and reliable data sources.
AI makes analysis faster: Natural-language questions, anomaly detection, automated summaries, and forecasts can reduce manual reporting work.
Total cost extends beyond licensing: Implementation, data engineering, training, administration, infrastructure, and support can substantially affect the investment.
10 best enterprise performance analytics tools
The broader category of performance analytics tools includes general business intelligence platforms, digital analytics products, planning systems, and specialized customer-performance software.
Let’s dive into the enterprise performance analytical tools.
1. Usermaven: Best for digital customer and revenue performance

Usermaven brings marketing attribution, website activity, product engagement, customer journeys, CRM data, and revenue reporting into one environment.
It is not intended to replace every finance or operational BI system. Its strongest role is helping enterprise marketing, product, ecommerce, SaaS, and growth teams understand digital performance.
Best for: Enterprises that need acquisition, customer behavior, product engagement, pipeline, and revenue analysis in one platform.
Key enterprise capabilities:
Multi-touch marketing attribution
Website and ecommerce analytics
Product engagement and adoption
Customer journeys
Funnels and retention
CRM pipeline and revenue visibility
Cohort and lifecycle analysis
Custom dashboards
Maven AI
Automatic event capture
Warehouse export
Custom integrations
Product analytics connects acquisition with activation, feature usage, engagement, and retention. This helps teams see what happens after a campaign or sales activity brings someone into the product.
Enterprise plans include custom workspaces, unlimited data history, warehouse exports, SAML SSO, role-based access controls, audit logs, residency options, private cloud deployment, and on-premises deployment.
Pricing: Growth starts at $84 per month for 250,000 events per month. Scale starts at $199 per month and adds attribution, CRM revenue analysis, conversion paths, retention, and Maven AI. Enterprise pricing is customized.
Teams that need multi-touch attribution without jumping straight to enterprise pricing can also review the comparison of affordable attribution tools.
2. Microsoft Power BI: Best for Microsoft-based enterprises

Microsoft Power BI is a widely adopted business intelligence platform for building reports, modeling data, and distributing dashboards across an organization.
It integrates closely with Microsoft Fabric, Azure, Excel, Microsoft 365, and other parts of the Microsoft ecosystem.
Best for: Organizations already using Microsoft cloud, productivity, database, and data-platform products.
Key enterprise capabilities:
Interactive reports and dashboards
Data modeling
Microsoft Fabric integration
Embedded analytics
Role and permission controls
Scheduled refreshes
Large semantic models
Copilot for supported Fabric capacities
Power BI works well when an organization wants broad business intelligence across finance, operations, sales, and other departments.
Its licensing becomes more complex when teams combine per-user plans, embedded analytics, and Fabric capacity.
Pricing: A free account is available. Power BI pricing lists Pro at $14 per user per month and Premium Per User at $24 per user per month, paid yearly. Embedded and Fabric capacity use variable pricing.
3. Tableau: Best for advanced visualization

Tableau is designed for detailed visual analysis and interactive data exploration.
Analysts can connect multiple sources, build dashboards, and let users investigate results through filters, drill-downs, and visual interactions.
Best for: Analyst-led enterprises that prioritize sophisticated data visualization and flexible exploration.
Key enterprise capabilities:
Interactive visualizations
Drag-and-drop analysis
Tableau Desktop
Tableau Prep
Tableau Pulse
Cloud and self-managed server options
Data and advanced management
Tableau Agent
Embedded analytics
Tableau Cloud provides a hosted service, while Tableau Server gives organizations more control over deployment and infrastructure.
Tableau Next adds agentic analytics and closer integration with Salesforce technologies.
Pricing: Tableau pricing lists Standard licenses from $15 per user per month and Enterprise licenses from $35 per user per month, billed annually. Creator and Explorer roles cost more, while Cloud+ and Tableau+ require a quote.
4. Google Looker: Best for governed cloud analytics

Google Looker is a business intelligence platform built around governed semantic modeling.
LookML allows data teams to define business logic centrally so dashboards, reports, and embedded applications use consistent metrics.
Best for: Organizations using cloud warehouses that need governed and reusable business definitions.
Key enterprise capabilities:
Semantic data modeling
LookML
Reusable business metrics
Dashboards and exploratory analysis
Embedded analytics
APIs
BigQuery integration
Scheduled reporting
Conversational Analytics
Looker is especially useful when teams want analysts and business users to work from the same metric definitions.
Pricing includes a platform component and user licenses. Standard, Enterprise, and Embed editions are available through annual agreements.
Pricing: Custom. Organizations need to contact Google Cloud for platform and user pricing.
5. ThoughtSpot: Best for search-driven analytics

ThoughtSpot focuses on making enterprise data accessible through search and natural-language questions.
Business users can explore data without relying only on predefined dashboards or knowing SQL.
Best for: Enterprises that want broader self-service analysis through conversational and search-based interfaces.
Key enterprise capabilities:
Natural-language search
Interactive Liveboards
Automated KPI monitoring
Anomaly detection
Change analysis
Spotter AI Agents
Semantic modeling
Embedded analytics
Live cloud-warehouse connections
Spotter acts as an AI analyst that answers questions, explains results, and supports follow-up investigation. ThoughtSpot also offers advanced analysis through Analyst Studio.
Pricing: Essentials starts from $25 per user per month when billed annually. Usage-based pricing starts from $0.10 per credit, while Enterprise plans use custom pricing.
6. Domo: Best for executive cloud dashboards

Domo combines data integration, analytics, visualizations, workflows, applications, and AI in one cloud platform.
Its broad connector library can help organizations bring operational and departmental information into executive reporting.
Best for: Enterprises wanting cloud dashboards, alerts, integrations, mobile reporting, and workflow automation together.
Key enterprise capabilities:
Cloud and on-premise data connections
Drag-and-drop data transformation
Executive dashboards
Mobile analytics
Alerts
Scheduled reports
Embedded analytics
Low-code applications
Workflows and automation
Custom AI agents
Domo states that its platform supports more than 1,000 prebuilt connectors and provides usage-based paid plans with volume discounts and optional add-ons.
Pricing: Domo offers a 30-day free trial. Paid subscriptions are consumption-based and require a tailored quote.
7. Qlik Cloud Analytics: Best for complex data exploration

Qlik Cloud Analytics uses an associative analytics engine that lets users explore relationships across data without being restricted to a predefined query path.
It combines dashboards, reporting, data integration, automation, AI assistance, and predictive analysis.
Best for: Enterprises working with complex or disconnected datasets that require flexible exploration.
Key enterprise capabilities:
Associative data exploration
Interactive dashboards
Hundreds of connectors
Reporting and distribution
Data lineage
Managed spaces
Qlik Answers
Qlik Predict
Automations
Cloud and client-managed options
Qlik Cloud plans use analyzed-data capacity as an important pricing measure. Higher plans add predictive analytics, more generative AI capacity, lineage, SAP data extraction, and expanded governance.
Pricing: Starter begins at $300 per month for 10 users. Standard begins at $825 per month, Premium at $2,750 per month, and Enterprise requires a quote. Plans are billed annually.
8. SAP Analytics Cloud: Best for analytics and enterprise planning

SAP Analytics Cloud combines business intelligence, planning, predictive analytics, and augmented analysis in one cloud service.
It is particularly relevant for enterprises already using SAP applications and data sources.
Best for: SAP-centered organizations combining performance reporting with financial, supply-chain, and operational planning.
Key enterprise capabilities:
Business intelligence
Enterprise planning
Budgeting and forecasting
Scenario modeling
Predictive analytics
SAP data integration
Prebuilt business content
Joule-assisted analysis
Governed planning models
SAP positions the platform as an integrated environment for analyzing, predicting, planning, and reporting. Joule can assist with reporting, insights, scenario modeling, and planning tasks.
Pricing: Custom. SAP provides trials and pricing information through its sales and service-catalog channels.
9. IBM Cognos Analytics: Best for governed enterprise reporting

IBM Cognos Analytics combines interactive dashboards with structured enterprise reporting.
It is especially relevant when an organization needs scheduled report distribution, role-based controls, centralized administration, and flexible deployment.
Best for: Enterprises that prioritize governed reporting and controlled information distribution.
Key enterprise capabilities:
Interactive dashboards
Enterprise reports
Scheduled distribution
Report bursting
Data modules
AI Assistant
Predictive forecasting
Centralized administration
Audit tracking
Cloud, on-premise, and container deployment
IBM offers on-demand cloud plans alongside hosted, on-premise, and container-based deployment options.
Pricing: Standard starts at $11.25 per authorized user per month. Premium starts at $44.90 per authorized user per month, with prices varying by region and purchasing terms.
10. Adobe Analytics: Best for digital experience analytics

Adobe Analytics focuses on websites, mobile applications, campaigns, content, customer behavior, and digital experiences.
Adobe Customer Journey Analytics extends this view by unifying identities and interactions across online and offline sources.
Best for: Large organizations needing detailed customer, campaign, content, and journey analysis across digital channels.
Key enterprise capabilities:
Cross-channel customer analysis
Identity stitching
Customer segmentation
Journey visualization
Person-level attribution
Campaign analysis
Predictive insights
Agentic and generative AI
Adobe Experience Platform integration
Audience activation
Customer Journey Analytics supports natural-language questions, AI-generated insights, journey analysis, experimentation, and attribution across channels, events, content, and customer actions.
Pricing: Custom. Pricing can depend on data volume, product package, users, AI capabilities, integrations, professional services, and contract terms.
Quick overview of enterprise performance analytics tools
The best choice depends on the performance questions being answered and the technical environment supporting them.
| Tool | Best for | Main strength | AI capability | Deployment | Pricing |
|---|---|---|---|---|---|
| Usermaven | Digital customer and revenue performance | Attribution, product, journey, and revenue analysis | Maven AI | Cloud, private cloud, and on-premise options | Public + custom |
| Microsoft Power BI | Microsoft-based enterprises | Dashboards and data modeling | Copilot | Cloud, embedded, and capacity options | Public |
| Tableau | Advanced visualization | Interactive visual exploration | Tableau Agent and Tableau AI | Cloud and server | Public + custom |
| Google Looker | Governed cloud analytics | Semantic data modeling | Conversational Analytics | Cloud | Custom |
| ThoughtSpot | Search-driven analytics | Natural-language data exploration | Spotter AI Agents | Cloud and embedded | Public + custom |
| Domo | Executive cloud analytics | Integrations, dashboards, and workflows | Domo AI | Cloud | Usage-based custom pricing |
| Qlik Cloud Analytics | Complex data exploration | Associative analytics and data integration | Qlik Answers and Qlik Predict | Cloud and client-managed options | Public + custom |
| SAP Analytics Cloud | Analytics and enterprise planning | BI, forecasting, and planning | Joule | Cloud | Custom |
| IBM Cognos Analytics | Governed enterprise reporting | Controlled reporting and distribution | AI Assistant | Cloud, on-premise, and containers | Public + custom |
| Adobe Analytics | Digital experience analytics | Cross-channel customer analysis | Agentic and predictive AI | Cloud | Custom |
Best enterprise performance analytics tool by use case
The best enterprise performance analytics tool depends on what your team needs to measure, how your data is managed, and who needs to act on the insights.
Use this table as a quick match between common enterprise requirements and the tool that fits best.
| Enterprise requirement | Recommended tool |
|---|---|
| Digital customer and revenue performance | Usermaven |
| Microsoft data ecosystem | Power BI |
| Advanced visualization | Tableau |
| Governed cloud metrics | Looker |
| Natural-language data exploration | ThoughtSpot |
| Executive cloud dashboards | Domo |
| Complex data relationships | Qlik Cloud Analytics |
| Analytics and enterprise planning | SAP Analytics Cloud |
| Governed scheduled reporting | IBM Cognos Analytics |
| Digital experience analytics | Adobe Analytics |
Ecommerce teams should prioritize ecommerce performance analytics that connects campaigns with products, order value, retention, and customer lifetime value.
Sales-led organizations may need sales performance analytics that links acquisition, pipeline stages, opportunities, sales activity, and closed revenue.
Enterprises managing substantial advertising budgets should also evaluate performance marketing attribution capabilities. These help connect campaign spending with customer journeys, conversions, pipeline, and revenue.
See Usermaven in action
Book a free demo and discover how powerful analytics can grow your business.
How enterprise performance analytics works
A typical enterprise analytics process includes seven stages:
Connect data sources
Pull in data from every relevant system so nothing falls through the cracks.Clean and standardize
Remove duplicates and align formats so your data is actually trustworthy.Define shared metrics
Agree on what each KPI means so every team is measuring the same thing.Build dashboards and reports
Turn raw numbers into governed views that anyone can act on.Spot trends and gaps
Identify what is shifting, what is underperforming, and where to focus.Investigate root causes
Dig into segments, channels, or regions to understand why changes happened.Track outcomes
Measure whether the actions you took actually moved the numbers.
A reliable platform should preserve access to the underlying data. Leaders may begin with a high-level KPI, but analysts should still be able to explore the segments, channels, products, or regions responsible for the change.
Core capabilities of enterprise performance analytics tools
Enterprise analytics software should do more than produce polished dashboards.
The following capabilities determine whether a platform can support reliable decision-making across a large organization.
Enterprise data integration
The platform should connect data from systems such as:
Customer relationship management platforms
Enterprise resource planning systems
Finance and billing tools
Advertising and marketing platforms
Product and website analytics
Cloud data warehouses
Ecommerce platforms
Customer-support systems
A single source of truth reduces the risk of different teams presenting conflicting performance numbers.
That does not always mean storing every record in one tool. It means agreeing on the approved systems, definitions, transformations, and owners behind each metric.
Data governance
Enterprise analytics may expose financial, customer, employee, product, and operational information. The OECD’s data governance guidance treats governance as a full-lifecycle responsibility covering data access, sharing, privacy, protection, and security.
Clear data governance should cover:
Data ownership
Access permissions
Metric definitions
Quality checks
Audit records
Data lineage
Retention policies
Residency requirements
Privacy and compliance
Governance also determines which users may create or modify reports. Without it, self-service analytics can produce dozens of competing definitions for the same business result.
KPI consistency
Revenue, active users, qualified pipeline, churn, acquisition cost, and customer value should not be calculated differently across departments.
Teams should document the formula, source, owner, refresh schedule, included segments, and exclusions for every major KPI.
Standardizing digital marketing metrics and KPIs is especially important when several teams report on acquisition, conversion, and revenue.
Executive dashboards
Executives need a focused view of the measures that require attention.
A clear KPI dashboard should surface targets, trends, exceptions, and important changes without overwhelming decision-makers with unnecessary charts.
An analytics dashboard should also support deeper investigation. Analysts may need to filter by channel, product, customer segment, market, region, or period.
Self-service exploration
Business teams should be able to answer common questions without waiting for a data specialist to build every report.
Useful self-service capabilities include:
Drag-and-drop reporting
Reusable filters
Saved views
Natural-language questions
Drill-down analysis
Scheduled reports
Shareable dashboards
Self-service still requires governed metrics. Greater access should not result in uncontrolled calculations.
AI and natural-language analysis
AI can reduce the time required to analyze large datasets. The NIST AI Risk Management Framework recommends evaluating AI systems for validity, reliability, transparency, explainability, privacy, and ongoing risk management.
Common capabilities include:
Natural-language questions
Automated summaries
Anomaly detection
Root-cause analysis
Forecasting
Segment comparison
Suggested visualizations
Recommended actions
The distinction between predictive analytics and prescriptive analytics is useful here.
Predictive analytics estimates what may happen. Prescriptive analytics recommends what an organization might do in response.
Real-time reporting
Some decisions require frequent updates, while others can rely on daily or weekly refreshes.
Real-time or near-real-time reporting may matter for:
Advertising spend
Ecommerce revenue
Website outages
Product adoption
Fraud monitoring
Inventory
Customer-support operations
Teams should match refresh frequency to the decision, rather than paying for continuous processing that adds little value.
Security and permissions
Enterprise requirements may include:
SAML single sign-on
Role-based access controls
Audit logs
Encryption
Regional data hosting
Private-cloud deployment
On-premise deployment
Custom retention rules
Security reviews
The platform should also make it easy to separate sensitive information from general performance reporting.
Scalability and deployment
A tool that works for one department may struggle when expanded across regions and business units.
Enterprise buyers should evaluate:
Data-volume limits
Query performance
Concurrent users
Workspace structure
Regional deployment
Warehouse connectivity
Embedded analytics
API capacity
Administration effort
Enterprise performance analytics best practices
Technology alone does not create a successful enterprise analytics program. Organizations also need clear questions, governed metrics, accountable owners, and processes that turn insight into action.
Define business questions first
Begin with the decisions that teams need to make.
Examples include:
Which regions are missing revenue targets?
Which campaigns generate profitable customers?
What is slowing pipeline progression?
Which product actions predict retention?
Where are operational costs increasing?
Which customer segments are at risk of churn?
These questions should determine the required metrics and data sources.
Standardize KPI definitions
Each important KPI should have a documented:
Formula
Owner
Data source
Refresh schedule
Time zone
Segment rules
Inclusion criteria
Exclusion criteria
Without consistent definitions, departments may spend meetings debating the numbers instead of acting on them.
Paid-media reporting should also prioritize meaningful ad performance metrics, such as customer acquisition cost, revenue, margin, payback, and long-term value.
Build a governed data foundation
Create clear rules for how data is collected, transformed, approved, accessed, and changed.
Governance should be established before dashboards are distributed across hundreds or thousands of users.
Start with high-value use cases
Attempting to connect every enterprise dataset at once can delay useful reporting.
Start with a small number of important executive or departmental questions. Expand after the organization proves that the first reports are trusted and used.
Apply role-based access
Executives, marketers, analysts, sales representatives, and finance teams do not need identical access.
Role-based permissions should provide enough information for each team to work while protecting restricted financial, customer, or employee data.
Validate AI-generated insights
AI summaries should not be treated as unquestionable conclusions.
Users should be able to inspect:
Source data
Metric definitions
Applied filters
Date ranges
Calculations
Comparison periods
Analysts should verify important findings before they affect budgets or strategic decisions.
Track analytics adoption
Measure whether teams actually use the platform.
Useful adoption indicators include:
Active dashboard users
Scheduled report subscriptions
Repeated natural-language questions
Saved analyses
Shared reports
Actions resulting from insights
Low adoption may indicate weak training, confusing dashboards, poor data quality, or limited trust.
Avoid implementation mistakes
Common analytics implementation mistakes include starting without clear owners, tracking excessive data, ignoring naming standards, and building dashboards before defining business questions.
A phased implementation usually delivers value faster than a large rollout with no prioritized use cases.
Enterprise performance analytics for CIOs
CIOs need to evaluate more than the quality of charts.
The platform must fit the organization’s architecture, security policies, data strategy, operating model, and budget.
Architecture and integration burden
Review how the platform connects to:
Data warehouses
ERP systems
CRMs
Finance tools
Product systems
Marketing platforms
Identity providers
Internal applications
A platform with native connectors may still require engineering work to standardize models and reconcile inconsistent source data.
Governance and security
CIO evaluation should include:
SAML SSO
Role-based permissions
Audit logs
Encryption
Data residency
Retention policies
Private connectivity
Regional hosting
Compliance documentation
Private-cloud or on-premise options
The broader field of enterprise analytics also includes architecture, governance, adoption, and operational requirements beyond dashboard features.
Scalability
Assess whether the platform can support:
Growing data volumes
More departments
Regional teams
Concurrent users
Larger models
Frequent refreshes
Embedded analytics
New AI workloads
Performance should be tested using realistic enterprise datasets, not only vendor demonstrations.
Deployment flexibility
Standard software-as-a-service deployment may suit many organizations.
Others may require:
Private cloud
Hybrid infrastructure
On-premise deployment
Regional data centers
Dedicated instances
Warehouse-native querying
Deployment requirements can quickly eliminate platforms that appear suitable based only on feature lists.
Total cost of ownership
The software subscription is only one part of the cost.
The full investment may include:
Implementation
Data engineering
Consulting
Infrastructure
Training
Administration
Premium support
AI usage
Additional storage
Embedded analytics
Custom integrations
A lower license price may not produce a lower total cost when the platform needs extensive internal resources.
Business adoption
Technical capability creates limited value when business users cannot understand the platform.
CIOs should evaluate onboarding, documentation, training, usability, natural-language analysis, and support for different user roles.
How to choose an enterprise performance analytics platform
The buying process should begin with the organization’s requirements, not a generic feature checklist.
Review the existing data stack
List the systems the platform must connect to.
Identify which sources hold approved information and where duplicate or conflicting data currently exists.
Identify the primary users
Clarify whether the platform will mainly serve:
Executives
Business analysts
Data teams
Marketing teams
Product teams
Sales teams
Finance teams
Operations teams
Different users need different levels of flexibility, governance, and technical complexity.
Determine the required analytics depth
Decide whether the organization needs:
Standard reports
Interactive dashboards
Self-service exploration
Marketing attribution
Customer journeys
Forecasting
Planning
Predictive analytics
Embedded analytics
Avoid paying for advanced capabilities that no team is prepared to use.
Evaluate AI transparency
Ask vendors how their AI features:
Access data
Interpret business definitions
Explain calculations
Handle restricted information
Cite underlying metrics
Learn from user feedback
An AI answer should be traceable to trusted enterprise data.
Compare governance requirements
Evaluate metric ownership, data lineage, report approvals, permissions, and auditability.
Self-service access should operate within a controlled framework.
Assess implementation effort
Compare tools that support no-code analytics with platforms that require extensive modeling, engineering, or consulting.
Self-service does not eliminate implementation work, but it can reduce dependence on technical teams for routine analysis.
Review data management requirements
Strong data management provides the foundation for reliable dashboards, forecasts, and AI-generated insights.
Review how each platform handles data quality, transformations, storage, ownership, access, and lifecycle policies.
Compare total cost
Request a clear estimate covering:
Software
Implementation
Integrations
Training
Support
Infrastructure
Usage overages
AI capacity
Future scaling
Enterprise contracts should also define renewal terms and expected price increases.
How Usermaven supports digital enterprise performance analytics
Usermaven supports digital enterprise performance analytics by connecting acquisition, website behavior, product engagement, CRM progression, customer journeys, and revenue in one focused environment.
It is most useful for enterprises that need digital performance visibility across marketing, product, growth, ecommerce, and revenue teams.
Teams can use Usermaven to connect paid ads, organic acquisition, content, landing pages, CRM records, and revenue through marketing attribution dashboards, website analytics, product analytics, funnels, cohorts, and journey analysis.
This helps them compare channel contribution and understand what happens before and after acquisition.
Maven AI lets teams ask plain-language questions about campaigns, segments, retention, funnels, revenue, and expansion while still validating answers through dashboards and reports.
For enterprise needs, Usermaven supports SSO, RBAC, data residency, warehouse export, custom integrations, and SLAs.
Final verdict
The best enterprise performance analytics tool depends on the performance questions, technology stack, users, and deployment requirements.
Power BI is a practical choice for Microsoft-centered environments. Tableau suits teams that prioritize advanced visualization, while Looker provides governed semantic modeling for cloud data.
ThoughtSpot focuses on natural-language exploration. Domo combines cloud dashboards with integrations and workflows, while Qlik supports associative analysis across complex datasets.
SAP Analytics Cloud combines analytics with planning. IBM Cognos emphasizes governed reporting, and Adobe Analytics focuses on enterprise customer experiences and digital journeys.
Usermaven is the stronger fit when the priority is connecting marketing, website behavior, product engagement, customer journeys, CRM activity, retention, and revenue in one self-service platform.
Ready to see Usermaven in action? Explore the platform or book a demo for a closer look.
Unlock insights that drive growth
FAQs
1. What are enterprise performance analytics tools?
Enterprise performance analytics tools combine data from business systems and turn it into dashboards, reports, trends, forecasts, and actionable insights. They may analyze financial, sales, marketing, product, customer, and operational performance.
2. What is enterprise performance analytics?
Enterprise performance analytics is the process of measuring and investigating business performance across departments, systems, and data sources. It helps organizations understand what changed, why it changed, and which actions may improve future results.
3. What is the difference between enterprise analytics and business intelligence?
Business intelligence usually focuses on reports, dashboards, and data exploration. Enterprise analytics is a broader concept that may also include predictive analysis, customer journeys, product behavior, planning, attribution, AI, and operational decision support.
4. Which enterprise performance analytics tool is best?
The best tool depends on the use case. Power BI suits Microsoft environments, Tableau supports advanced visualization, SAP Analytics Cloud combines analytics and planning, Adobe Analytics specializes in digital experiences, and Usermaven connects marketing, product, customer, and revenue performance.
5. What should CIOs look for in an analytics platform?
CIOs should evaluate integration requirements, governance, security, scalability, deployment, administration, AI transparency, business adoption, and total cost of ownership. A platform should fit both the technical architecture and the needs of business users.
6. How does AI improve enterprise performance analytics?
Updated

Written by
Junaid Ahmed
Content Writer & Digital Marketer
Junaid Ahmed is a content and copywriter with 3+ years of experience creating research-driven content across SaaS, B2B, ecommerce, and digital marketing. He specializes in turning complex topics into clear, practical content that helps marketers better understand their challenges, evaluate solutions, and make informed decisions. His work spans educational content, industry insights, and actionable marketing guides.
All articles by Junaid →