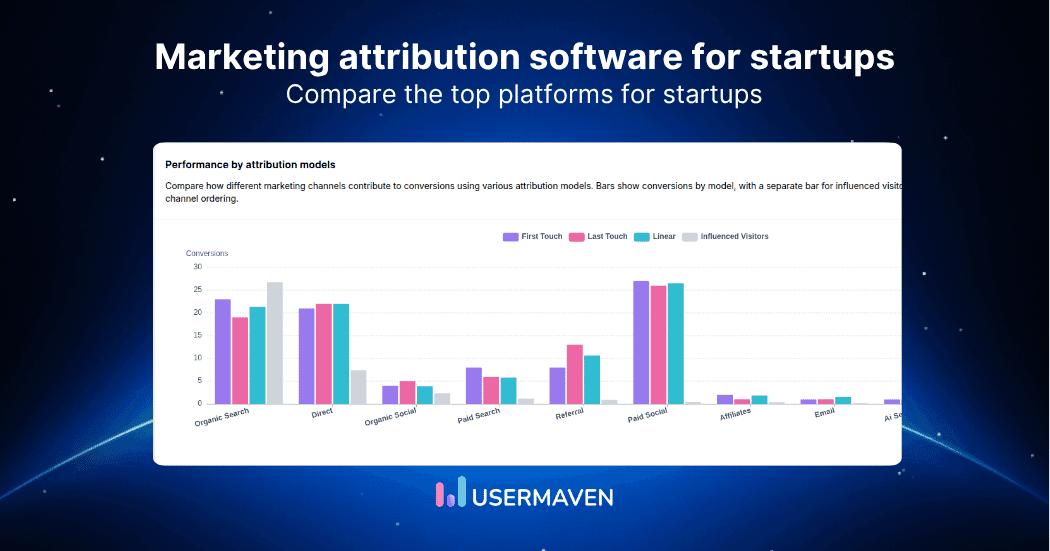
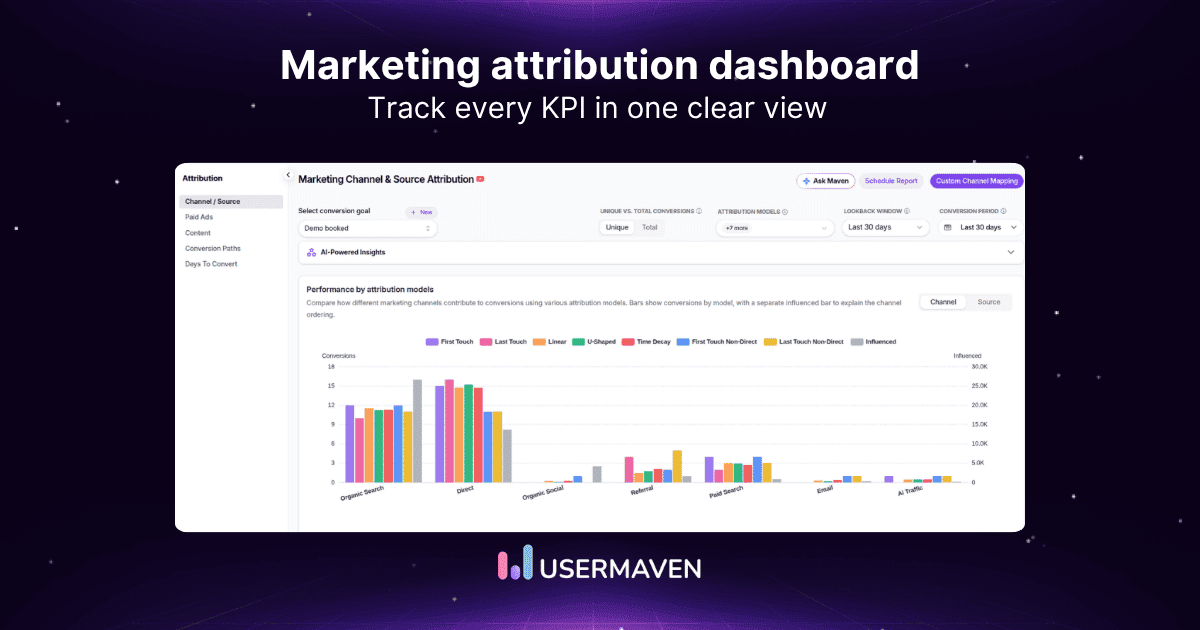
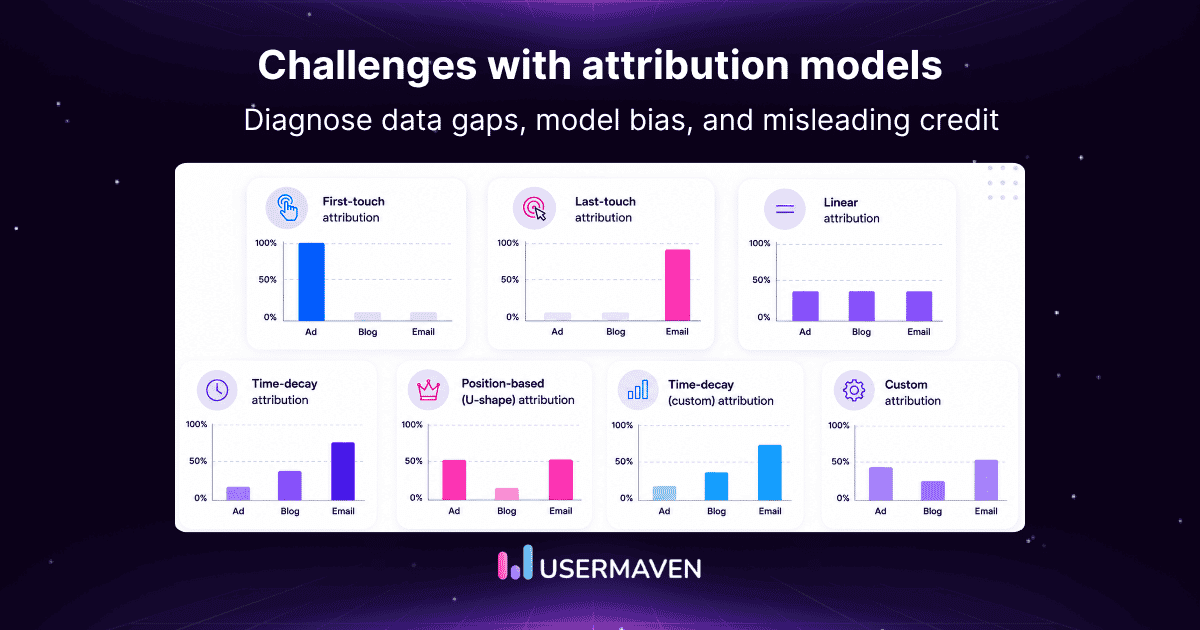
One conversion can involve several touchpoints, yet most reports still reward only one.
A buyer might discover your brand through an organic article, click a paid social ad days later, attend a webinar, return through branded search, and finally convert through email. Under a last-click model, the email receives all the credit, even though earlier interactions helped create and strengthen demand.
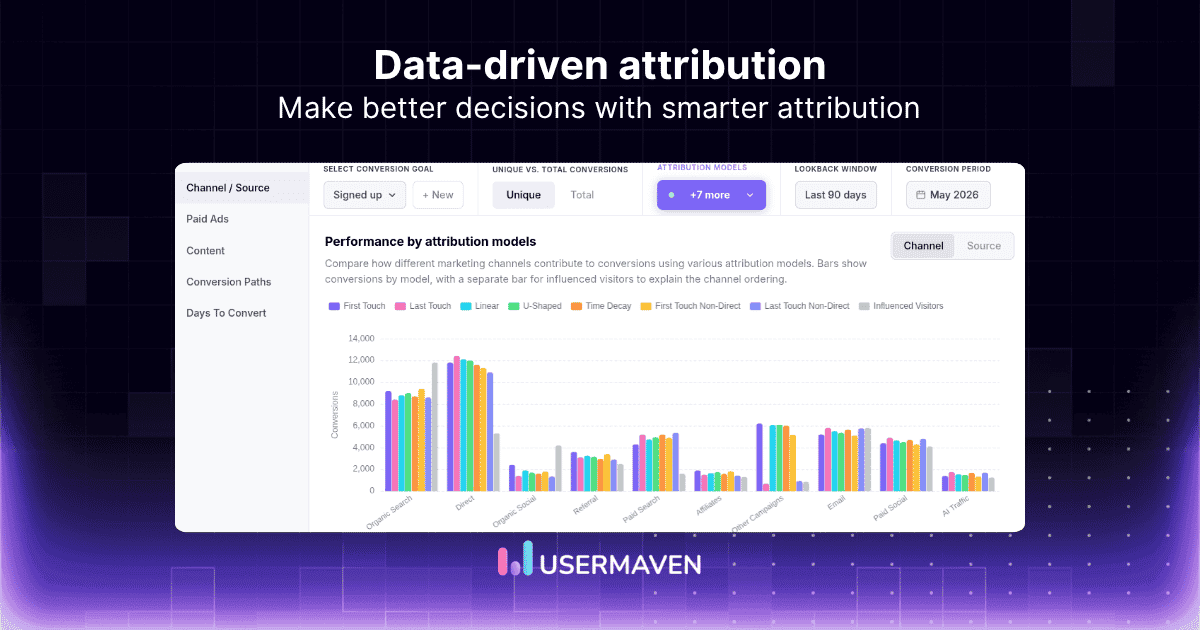
Data-driven attribution offers a more balanced view. It uses statistical analysis and machine learning to compare converting and non-converting journeys. It then assigns fractional credit based on the estimated contribution of each touchpoint.
Unlike rule-based models, it does not rely on fixed formulas. However, its accuracy still depends on clean data, sufficient conversion volume, reliable identity resolution, complete tracking, and suitable attribution windows. Understanding these factors is essential before using data-driven attribution to guide budgets and campaign decisions.
Key takeaways
- Data-driven attribution uses statistical or machine-learning methods to estimate how different marketing touchpoints contribute to conversions.
- Unlike rule-based attribution models, it calculates attribution weights from observed converting and non-converting journeys instead of following a fixed formula.
- Data-driven attribution is a form of multi-touch attribution, but it does not independently prove that a campaign caused additional conversions.
- Its reliability depends on accurate tracking, sufficient journey data, consistent campaign taxonomy, identity resolution, and complete conversion records.
- Marketers should validate data-driven attribution using customer journeys, model comparisons, CRM outcomes, holdout tests, and incrementality experiments.
What is data-driven attribution?
Data-driven attribution, commonly abbreviated as DDA, is an algorithmic marketing attribution model that uses historical customer journey data to estimate the contribution of each marketing touchpoint to a conversion.
Instead of assigning credit according to a fixed rule, the model analyzes patterns in actual user behavior. It compares the paths of customers who converted with those who did not and calculates how the presence, absence, order, and timing of specific interactions affect conversion probability.
The model may then distribute conversion credit across multiple touchpoints. For example, it could assign:
- 15% to a paid social ad
- 35% to an organic search visit
- 20% to a webinar
- 10% to a retargeting campaign
- 20% to an email click
These percentages are not predetermined. They are calculated from the patterns the model identifies in the available data.
Google describes data-driven attribution as a model that evaluates both converting and non-converting paths and considers factors such as interaction order, time to conversion, device type, the number of ad interactions, and creative format.
Maximize your ROI
with accurate attribution
Data-driven attribution at a glance
Here is what you need to know before going deeper.
| Question | Answer |
|---|---|
| What does it do? | Distributes conversion credit across marketing touchpoints |
| How are weights determined? | Through statistical analysis or machine learning |
| What data does it analyze? | Converting and non-converting customer journeys |
| Is the formula fixed? | No, weights are learned from observed data |
| Is it a multi-touch model? | Yes |
| Does it prove causality? | Not by itself |
| What affects its accuracy? | Data quality, volume, tracking coverage, and model design |
How does data-driven attribution work?
Data-driven attribution generally follows five stages.

Step 1: Collect customer journey data
The attribution system records interactions that occur before a conversion. Depending on the platform and tracking setup, these may include:
- Ad clicks and impressions
- Organic search visits
- Email clicks
- Social media interactions
- Referral visits
- Website sessions
- Product interactions
- Form submissions
- Demo requests
- Purchases
- CRM-qualified opportunities
- Offline sales events
The system should capture both converting and non-converting journeys. Looking only at customers who converted would make it difficult to determine whether a touchpoint genuinely increased conversion probability or simply appeared frequently in most user journeys.
Step 2: Compare converting and non-converting paths
The model compares the paths of users who completed the selected conversion with similar users who did not.
For example, it may find that users who attended a webinar converted more frequently than similar users who never attended one. It may also find that a retargeting ad often appeared immediately before conversion but had little effect on users who had already demonstrated strong purchase intent.
This comparison helps the model identify which interactions are associated with meaningful changes in conversion likelihood.
Step 3: Analyze the contribution of each touchpoint
The system analyzes how adding, removing, or changing the position of a touchpoint affects the estimated probability of conversion.
Suppose the estimated probability of conversion is:
- 4% when a journey includes an organic search visit
- 2.5% when an otherwise similar journey does not include it
The model may interpret the organic visit as having a meaningful contribution and assign it a larger share of the credit.
More advanced systems may use counterfactual analysis, probability models, neural networks, Markov chains, Shapley values, or other statistical methods. The exact methodology differs between platforms.
Step 4: Assign fractional conversion credit
The model distributes conversion credit among the touchpoints according to their calculated contribution.
Unlike first-touch or last-touch attribution, more than one interaction can receive credit. Unlike linear attribution, the credit does not have to be divided equally.
The same channel can also receive different credit in different journeys. An email click may be highly influential in one conversion path but contribute very little in another.
Step 5: Update the model as new data becomes available
Data-driven attribution models are not necessarily static. As campaigns, audiences, buying behavior, and conversion patterns change, the model can recalculate contribution weights.
This allows it to adapt to:
- Seasonal demand
- New marketing channels
- Changes in campaign strategy
- Shifts in device usage
- Longer or shorter buying cycles
- Changes in creative performance
- New conversion events
Some attribution platforms may also update recent attribution reports as new customer interactions are processed. While the exact behavior varies by platform, marketers should understand how their attribution solution handles reporting windows, lookback periods, and data refreshes when interpreting recent results. Usermaven, for example, lets teams configure attribution lookback windows to match their buying cycle, helping ensure that earlier touchpoints are included in attribution analysis.
Common methods used in data-driven attribution
Different attribution platforms use different statistical techniques to estimate how much each touchpoint contributes to a conversion. While the underlying methodology varies, the goal remains the same: distribute conversion credit based on observed customer behavior rather than fixed attribution rules.
Some of the most common approaches include:
- Markov chain models, which estimate how conversion probability changes when a touchpoint is removed from the customer journey.
- Shapley value models, which assign credit based on the incremental contribution each touchpoint makes across different combinations of interactions.
- Probabilistic and regression models, which identify statistical relationships between marketing touchpoints and conversion outcomes.
- Machine learning models, which continuously learn from new customer journeys and adjust attribution weights as user behavior changes.
The exact methodology depends on the attribution platform, so two tools analyzing the same customer journeys may produce different attribution results.
What factors does a data-driven attribution model analyze?
A data-driven attribution model may evaluate considerably more than the channel that generated a click.
Common factors include:
Touchpoint order
The model looks at where each interaction appears in the customer journey.
An organic article that repeatedly introduces new prospects may receive different credit from a branded search click that normally appears just before conversion.
Time to conversion
The time between an interaction and the final conversion can affect its estimated contribution.
A touchpoint that occurs close to conversion may receive more credit in some journeys, but proximity alone does not automatically mean it had the greatest influence.
Time between interactions
The model may evaluate whether users move quickly between touchpoints or return after several days or weeks.
This can help distinguish short ecommerce journeys from longer B2B or SaaS buying cycles.
Device type
A buyer may discover a company on mobile, continue researching on a desktop, and convert later on another device.
When the platform can resolve those interactions, device information helps the model interpret the complete path rather than treating each session as a separate customer.
Number and frequency of interactions
Repeated exposure can increase familiarity, but more interactions do not always mean greater influence.
The model may assess whether repeated ads contribute to conversion or simply reach people who were already likely to buy.
Campaign and creative format
Different ads, messages, keywords, landing pages, and creative formats can play different roles in a journey.
Google’s methodology, for example, considers the type of creative asset alongside interaction order, device type, and time to conversion.
Converting and non-converting behavior
This is one of the most important parts of data-driven attribution.
If a touchpoint appears frequently in both converting and non-converting paths, its presence alone may not strongly increase conversion probability. A less common interaction that appears disproportionately in successful journeys may receive more credit.
Data-driven attribution example
Imagine a B2B SaaS buyer completes the following journey:
Organic article → LinkedIn ad → webinar → direct visit → branded search → demo request
Here is how different marketing attribution models might treat the journey.
| Attribution model | Credit assignment |
|---|---|
| First-touch attribution | 100% to the organic article |
| Last-touch attribution | 100% to branded search |
| Linear attribution | Equal credit across all touchpoints |
| Time-decay attribution | More credit to branded search and the direct visit |
| Position-based attribution | Most credit to the organic article and branded search |
| Data-driven attribution | Credit based on the estimated influence of each interaction |
The data-driven model might find that:
- Organic content frequently introduces buyers who later convert.
- Webinar attendees convert at a significantly higher rate.
- Branded search commonly appears late in journeys but mainly captures existing intent.
- Direct visits have little independent influence.
- The LinkedIn ad assists consideration but rarely closes conversions.
It might consequently assign the largest share of credit to the webinar and organic article, even though branded search was the final measurable interaction.
The exact allocation would depend on patterns across many journeys, not only this individual conversion path.
Ecommerce data-driven attribution example
Consider an ecommerce customer journey:
Creator video → paid social ad → product page → abandoned-cart email → branded search → purchase
Last-click attribution would give all the credit to branded search.
A data-driven model could identify that shoppers exposed to the creator video and paid social campaign were much more likely to view the product and complete a purchase. It might also determine that branded search mostly helped shoppers return after they had already decided what to buy.
The model could therefore assign more credit to the creator campaign and paid social ad while still recognizing the supporting role of email and branded search.
This helps the ecommerce team distinguish channels that create demand from those that mainly capture existing demand.
Data-driven attribution vs. traditional attribution models
Traditional attribution models use predefined rules to determine how conversion credit is distributed.
| Model | How it assigns credit | Main limitation |
|---|---|---|
| First touch | All credit to the first interaction | Ignores nurturing and conversion touchpoints |
| Last touch | All credit to the final interaction | Overvalues demand-capture channels |
| Linear | Equal credit to every interaction | Assumes every touchpoint is equally influential |
| Time decay | More credit to recent interactions | Undervalues early influence |
| Position based | Most credit to first and last interactions | Uses an arbitrary fixed formula |
| Data driven | Credit calculated from journey data | Requires reliable data and can lack transparency |
Data-driven attribution vs. multi-touch attribution
Data-driven attribution and multi-touch attribution are related, but they are not identical.
Multi-touch attribution software helps you distribute conversion credit across every interaction in the customer journey, using models like linear, time-decay, and position-based attribution.
Data-driven attribution is a specific type of multi-touch attribution. It uses algorithms to calculate how much credit each touchpoint should receive rather than applying predetermined weights.
Put simply:
All data-driven attribution is multi-touch attribution, but not all multi-touch attribution is data driven.
| Aspect | Data-driven attribution | Multi-touch attribution |
|---|---|---|
| What it is | A specific algorithmic attribution model | A broader attribution approach |
| Credit assignment | Learned from observed data | Can be rule-based or algorithmic |
| Examples | Machine-learning or probabilistic attribution | Linear, time decay, U-shaped, and data-driven |
| Data requirements | Generally higher | Depend on the selected model |
| Transparency | Can be difficult to explain | Rule-based models are usually easier to interpret |
| Best use | Complex journeys with sufficient data | Any team moving beyond single-touch attribution |
Data-driven attribution vs. algorithmic attribution
Data-driven attribution and algorithmic attribution are often used interchangeably.
Both terms describe attribution approaches that use statistical models, machine learning, or other algorithms to calculate touchpoint contribution from observed data.
The difference is mainly one of emphasis:
- Data-driven attribution emphasizes the use of actual customer journey data.
- Algorithmic attribution emphasizes the computational method used to calculate credit.
Implementations can differ significantly between platforms. One system may use probability models, while another uses Markov chains, Shapley values, deep learning, or proprietary methods.
As a result, two platforms can analyze similar journey data and produce different attribution weights.
Data-driven attribution vs. incrementality
Data-driven attribution explains how conversion credit should be distributed among observed interactions.
Incrementality answers a different question:
Did this campaign generate conversions that would not have happened without it?
A campaign can receive considerable attribution credit without producing much incremental impact.
For example, a retargeting campaign may regularly appear before purchases and therefore receive credit from an attribution model. However, a holdout test may reveal that many of those shoppers would have purchased without seeing the retargeting ad.
| Data-driven attribution | Incrementality |
|---|---|
| Distributes credit across observed touchpoints | Measures additional outcomes caused by marketing |
| Uses customer journey patterns | Commonly uses experiments or control groups |
| Supports campaign and channel analysis | Supports causal decision-making |
| Answers where credit should go | Answers what would have happened without the campaign |
| Does not independently prove causality | Designed to estimate causal lift |
The strongest measurement strategy uses both.
Data-driven attribution helps marketers understand how channels contribute across the journey, while incrementality testing helps validate whether those channels generate additional business.
Data-driven attribution vs. marketing mix modeling
Marketing mix modeling, or MMM, evaluates how marketing activities and external factors affect business results using aggregated historical data.
Data-driven attribution usually works at the customer journey or interaction level. Marketing mix modeling works at an aggregated level, such as weekly spend and revenue by channel, market, or region.
| Aspect | Data-driven attribution | Marketing mix modeling |
|---|---|---|
| Data level | Journey or interaction level | Aggregated historical data |
| Typical scope | Digital touchpoints and conversion paths | Online and offline marketing |
| Main use | Campaign and journey optimization | Strategic budget planning |
| Time horizon | Shorter-term and ongoing | Longer-term |
| Identity dependence | Often relies on journey stitching | Does not require individual user paths |
| External factors | Usually limited | Can include seasonality, pricing and economic changes |
| Privacy exposure | Higher when user-level data is used | Lower due to aggregated data |
The two approaches can complement each other. Data-driven attribution offers granular journey insights, while marketing mix modeling provides a broader view of channel performance and external influences.
Benefits of data-driven attribution
- More balanced conversion credit: Data-driven attribution recognizes that several touchpoints contribute to a conversion, reducing dependence on arbitrary first-click or last-click rules.
- Better visibility into assisting channels: Content, organic search, social media, and awareness campaigns often influence buyers early. An algorithmic model reveals their contribution when they consistently appear in successful conversion paths.
- Smarter budget allocation: When you understand which touchpoints are associated with higher conversion probability, you can direct resources toward campaigns that support the complete journey, not just those that close it.
- Improved cross-channel analysis: Data-driven attribution evaluates how channels work together rather than in isolation. This is especially useful when multiple advertising platforms claim credit for the same conversion.
- Adaptation to changing behavior: Because attribution weights can be recalculated, the model responds to shifts in campaign performance, customer behavior, seasonality, and channel mix.
- Better bidding within advertising platforms: Platforms use attributed conversion values to optimize automated bidding. Google uses data-driven attribution as its default model for most Google Ads conversion actions. However, platform-specific attribution only evaluates interactions visible within that platform, so it should not be treated as a complete view of the cross-channel customer journey.
Limitations of data-driven attribution
While data-driven attribution provides a more complete view of the customer journey than rule-based models, it still has important limitations. Understanding these helps marketers interpret attribution reports more accurately.
1. It depends on high-quality, observable data
Data-driven attribution can only analyze interactions it can measure. Offline conversations, word-of-mouth referrals, private messages, untracked email forwards, and unresolved cross-device journeys are often invisible to the model. In addition, poor data quality such as missing events, duplicate conversions, broken tracking, or inconsistent UTM parameters can reduce attribution accuracy.
2. It estimates contribution, not business impact
Data-driven attribution estimates how much each touchpoint contributed to a conversion, but it does not prove causation or profitability. Attribution results should be combined with campaign costs, revenue, and metrics such as ROAS, CPA, and CAC. When causal decisions are required, marketers should validate findings through experiments or incrementality testing.
3. Results vary across platforms and methodologies
Different attribution platforms use different data sources, identity resolution methods, attribution windows, channel coverage, and statistical models. Some models also operate as a “black box,” making it difficult to understand how credit is assigned. As a result, Google Ads, Meta Ads, CRMs, and independent attribution platforms may report different attribution results for the same customer journey.
How to evaluate a data-driven attribution platform
Before choosing a platform, ask:
- Does it analyze both converting and non-converting paths?
- Which channels and touchpoints can it include?
- Does it explain its attribution methodology?
- What data volume does the model require?
- How does it behave when data is insufficient?
- Can it connect anonymous and identified journeys?
- Can it import CRM, offline, and revenue events?
- How are direct visits handled?
- Does it support custom attribution windows?
- Can it deduplicate conversions across channels?
- Can results be compared with rule-based models?
- Are individual conversion paths visible?
- Can the underlying data be exported?
- Does it measure view-through interactions?
- Can attribution results be validated against experiments?
A sophisticated model is not automatically a useful one. Transparency, data coverage, and connection to business outcomes are just as important as the algorithm.
How to validate data-driven attribution results
Attribution isn’t just about measuring past performance; it’s a tool for guiding future strategy. If the data is incomplete, misunderstood, or left unchallenged, it can steer budget and messaging in the wrong direction.
Reliable data migration tools help preserve data integrity when consolidating information from multiple platforms, ensuring attribution models are built on complete and accurate datasets.
Here is how to validate data-driven attribution results in 6 steps.
1- Compare attribution models
Review how conversion and revenue credit changes under different models.
A large difference does not automatically mean one model is wrong. It identifies channels that benefit from particular attribution assumptions.
2- Inspect individual conversion paths
Look at real customer journeys to determine whether the credit allocation makes practical sense.
The model should complement journey evidence, not replace it.
3- Connect attribution with CRM outcomes
Evaluate whether the channels receiving more credit also generate:
- Qualified leads
- Sales opportunities
- Larger deals
- Higher lifetime value
- More revenue
4- Track performance after budget changes
When attribution insights lead to increased or decreased spend, monitor the resulting CPA, ROAS, pipeline, and revenue.
The model is useful only when it improves decisions.
5- Use holdout tests
Exclude a representative audience from a campaign and compare its performance with the exposed group.
This can reveal whether a highly attributed campaign generates incremental results.
6- Review results over time
Attribution weights can change because of seasonality, channel mix, campaigns, creative, tracking, and consumer behavior.
Avoid making major decisions from a short or unusual reporting period.
How Usermaven supports better attribution analysis
Usermaven helps marketing teams move beyond a single attribution view by connecting marketing touchpoints with customer journeys, conversions, and revenue.
Instead of forcing teams to depend on one opaque algorithm, Usermaven allows marketers to compare multiple attribution models and investigate why channel credit changes.

Teams can use Usermaven to:
- Compare first-touch, last-touch, linear, U-shaped, time-decay, first non-direct, and last non-direct attribution models
- Analyze complete customer journeys
- Connect anonymous and identified activity
- Track website and product interactions
- Measure campaign, source, and channel performance
- Create custom channel mappings
- Analyze funnels and conversion paths
- Connect marketing activity with conversion and revenue outcomes
- Identify channels that assist conversions without receiving the final click
This transparent approach is particularly useful for teams that do not yet have the data volume required for a stable machine-learning model or want to validate algorithmic attribution against visible journey evidence.
See Usermaven in action
Book a free demo and discover how powerful analytics can grow your business.
Conclusion
Data-driven attribution gives marketers a more complete understanding of how different touchpoints contribute to conversions. While no attribution model is perfect, using the right methodology and high-quality data leads to more informed budget decisions, better campaign optimization, and more accurate measurement of marketing performance.
As a leading marketing attribution platform, Usermaven helps you go beyond basic attribution reports by connecting customer journeys, attributed revenue, marketing channels, and campaign performance in one place. With multi-touch attribution, user journey analytics, and AI-powered insights, you can understand what drives conversions and confidently invest in the channels that generate real business growth.
Ready to see which marketing channels are actually driving your revenue?
Ready to see Usermaven in action? Explore the platform or book a demo for a closer look.
FAQs
When should you use data-driven attribution?
Data-driven attribution is most suitable when:
– You market across several channels with multiple touchpoints before conversion.
– You have enough consistent conversion and journey data.
– Last-click reporting is distorting your budget decisions.
– Your business has a longer or nonlinear buying process.
– You need more granular campaign optimization.
When should you avoid relying on it?
Data-driven attribution may not be the best primary model when:
– Conversion volume is very low.
– Nearly all customers come from one channel.
– Tracking is incomplete or inconsistent.
– The main conversion is poorly defined.
– Offline influence represents most of the buying journey.
– Customer identities cannot be connected across sessions.
– The platform does not explain its methodology.
– Teams treat the output as causal proof without validation.
In these cases, transparent rule-based models and direct journey analysis may produce more understandable and stable insights while the measurement foundation is improved.
Is data-driven attribution more accurate than last-click attribution?
Data-driven attribution generally provides a more complete view of multi-channel journeys because it recognizes multiple interactions and calculates their estimated contribution. However, its accuracy depends on data quality, tracking coverage, conversion volume, attribution settings, and the methodology used by the platform.
How much data is needed for data-driven attribution?
There is no universal threshold. The amount of data required depends on the platform, conversion event, path diversity, model design, and tracking quality. Models generally perform better when they can analyze a substantial number of converting and non-converting journeys.
What factors does data-driven attribution analyze?
Updated

Written by
Adeel Khan
Growth Marketing Expert
Adeel Khan is a full-stack SaaS marketer with 10+ years of experience in content marketing, paid advertising, analytics, and conversion rate optimization. He shares practical insights and strategies drawn from hands-on experience, helping B2B SaaS marketers improve performance and make better marketing decisions.
All articles by Adeel →