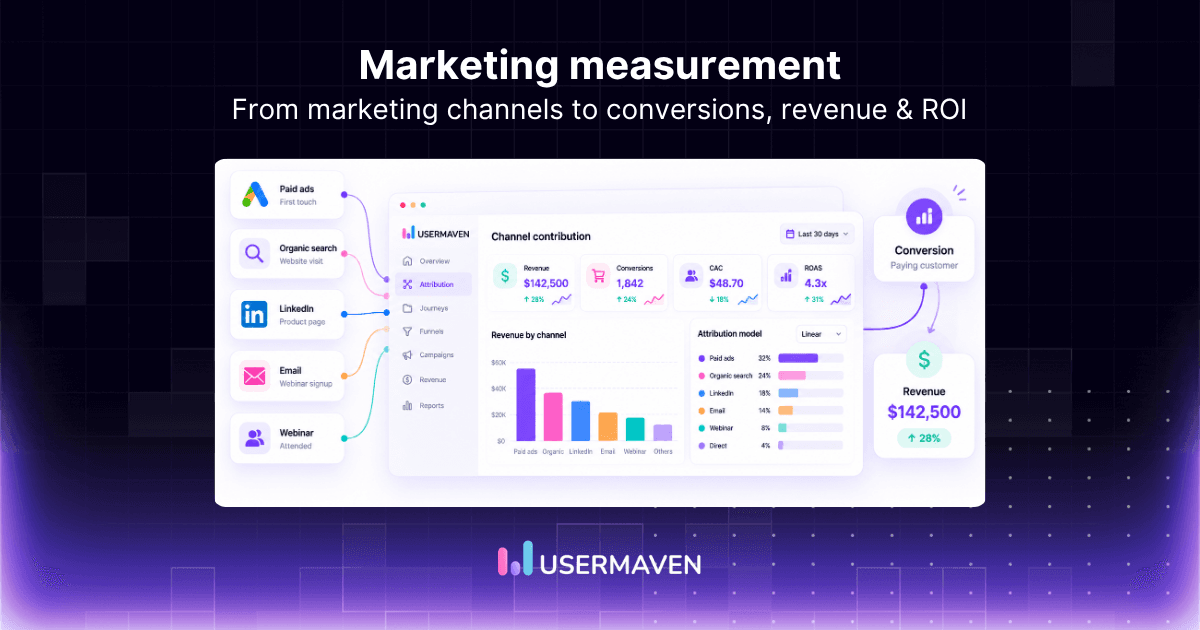
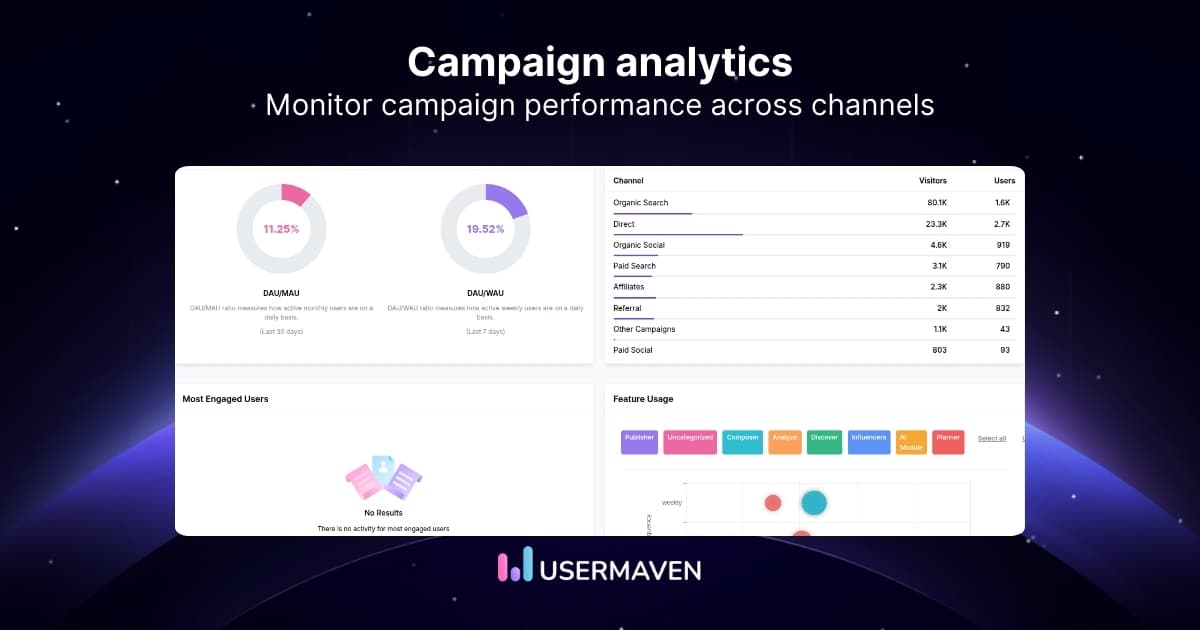
Your marketing dashboard shows more traffic. Your product dashboard shows fewer active users. And your revenue report says sales are growing.
So, is your business actually performing better?

That’s the problem with looking at disconnected metrics. An analytics dashboard brings relevant data together so you can understand what’s happening, spot problems, and decide what to do next.
But not every dashboard serves the same purpose. A marketing team needs different insights than a product manager or finance leader.
Here are 15 practical analytics dashboard examples, the metrics worth tracking, and how to build dashboards that help you make better decisions.
Website analytics tool for modern marketers & agencies
Key takeaways
- Analytics dashboards turn data into decisions. They organize important metrics, trends, and comparisons in one place.
- Different teams need different dashboards. Marketing, product, sales, and leadership teams measure different outcomes.
- The right KPIs matter more than the number of charts. Focus on metrics connected to specific business goals.
- Good dashboards show context. Trends, segments, benchmarks, and comparisons help explain performance changes.
- Dashboards need regular reviews. Keep metrics accurate, remove unnecessary charts, and update reports as business priorities change.
What is an analytics dashboard?
An analytics dashboard is a visual interface that displays important business metrics using charts, tables, and summaries.
It brings data from one or more sources into a central view, making it easier to monitor performance, identify trends, and investigate changes.
For example, a marketing analytics dashboard might display:
- Website traffic by acquisition channel.
- Leads and conversion rates.
- Campaign spending and customer acquisition costs.
- Marketing-attributed pipeline and revenue.
- Performance changes over time.
Instead of reviewing separate reports for every metric, teams can use one dashboard to understand how different activities contribute to their goals.
However, a dashboard is only as useful as the data behind it. Inaccurate tracking, inconsistent definitions, or missing integrations can produce misleading conclusions.
Why are analytics dashboards important?
Businesses generate data across websites, products, advertising platforms, CRMs, and payment systems.
Without a clear reporting structure, it’s difficult to connect that information to business performance.
Analytics dashboards help teams:
- Monitor important KPIs without rebuilding reports.
- Identify unusual changes in performance.
- Compare customer segments and marketing channels.
- Share consistent information across departments.
- Prioritize opportunities based on measurable results.
For example, a SaaS company might notice that trial signups are increasing while paid subscriptions remain flat.
A dashboard showing signup volume, activation rate, and paid conversion rate can help identify which stage deserves investigation.
This is where actionable analytics becomes useful. The goal isn’t simply to collect more data, but to use it to improve business outcomes.
What are the main types of analytics dashboards?
Analytics dashboards are commonly grouped into four categories based on the decisions they support.
| Dashboard type | Primary purpose | Typical users | Example metrics |
|---|---|---|---|
| Strategic | Monitor long-term business goals | Executives, founders | Revenue growth, CAC, LTV |
| Operational | Track ongoing activities | Marketing, sales, operations | Daily leads, campaign spending, signups |
| Analytical | Investigate trends and performance drivers | Analysts, growth teams | Cohort retention, conversion paths, channel performance |
| Tactical | Measure progress toward team objectives | Department managers | Campaign ROI, feature adoption, sales pipeline |
These categories can overlap. A single dashboard may support both operational monitoring and deeper analysis.
Strategic dashboards
Strategic dashboards focus on long-term performance.
For example, a SaaS leadership dashboard might show annual recurring revenue, customer acquisition cost, retention, and growth trends.
The purpose is to help decision-makers understand whether the business is moving toward its larger goals.
Operational dashboards
Operational dashboards track activities that require frequent attention.
A marketing operations dashboard might display daily campaign spending, new leads, and conversion performance.
These dashboards help teams identify problems quickly and respond when necessary.
Analytical dashboards
Analytical dashboards help teams investigate patterns, relationships, and changes.
For example, a product analyst might compare retention across customer cohorts to understand whether recent onboarding changes are associated with better engagement.
Tactical dashboards
Tactical dashboards help departments monitor specific initiatives.
A content marketing team might track organic traffic, qualified leads, and conversions from recently published articles.
A useful starting point is understanding the difference between reporting and analytics, since presenting metrics and investigating their meaning are related but distinct activities.
Key features of an effective analytics dashboard
A useful dashboard does more than display attractive charts.
It should help users find relevant information, understand performance, and take action.
1. Clear and relevant KPIs
Every metric should support a specific question or decision.
For example, a marketing team trying to reduce acquisition costs needs CAC, conversion rates, and channel performance more than general pageview counts.
2. Customizable views
Different teams should be able to focus on their own priorities.
Marketing may need campaign and attribution metrics, while product teams need activation, engagement, and retention.
Customizable analytics dashboards help organize those views without forcing everyone to use the same report.
3. Segmentation and filtering
Overall averages can hide important differences.
A dashboard should let you investigate performance by relevant dimensions such as acquisition channel, customer segment, device, campaign, or time period.
4. Trends and comparisons
A number without context tells you very little.
Showing the current conversion rate alongside the previous period, for example, makes it easier to recognize meaningful changes.
5. Reliable data connections
Dashboards often depend on information from several systems.
Make sure data sources, refresh schedules, event definitions, and integrations are understood.
Not every metric updates in real time, particularly when it comes from external platforms or CRM systems.
6. Simple visual design
Use charts that match the data.
Line charts work well for trends, bar charts for comparisons, and tables for detailed breakdowns.
Avoid unnecessary colors, decorative charts, and crowded layouts.
7. Clear metric definitions
Everyone reviewing a dashboard should understand what each metric means.
For example, “conversion” could refer to a signup, demo booking, qualified lead, or completed purchase.
Without consistent definitions, teams may interpret the same dashboard differently.
15 analytics dashboard examples and the metrics to track
The best dashboard depends on what you want to measure.
Here are 15 examples covering marketing, product analytics, customer behavior, and business performance.
1. Web analytics dashboard
A web analytics dashboard shows how people discover and interact with your website.
It helps you understand which channels attract visitors, which pages generate engagement, and where visitors convert.
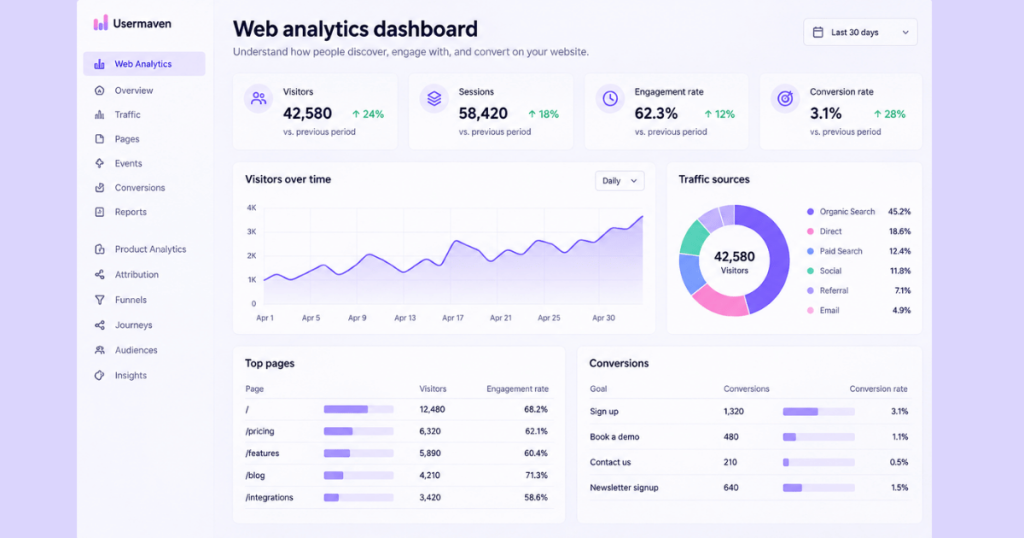
Key metrics to track:
- Visitors and sessions.
- Traffic sources and channels.
- Landing-page performance.
- Engagement rate.
- Website conversion rate.
Practical example: Your organic traffic increased by 25%, but demo bookings stayed flat.
A web analytics dashboard can help you investigate whether traffic growth came from informational pages with lower conversion intent or whether important landing pages experienced a decline in conversion rate.
For a deeper explanation of website-specific reporting, see our web analytics dashboard guide.
Website analytics tool for modern marketers & agencies
2. User acquisition dashboard
A user acquisition dashboard tracks how new visitors, leads, or customers are acquired.
It helps marketing teams compare acquisition channels and understand which activities produce valuable outcomes.
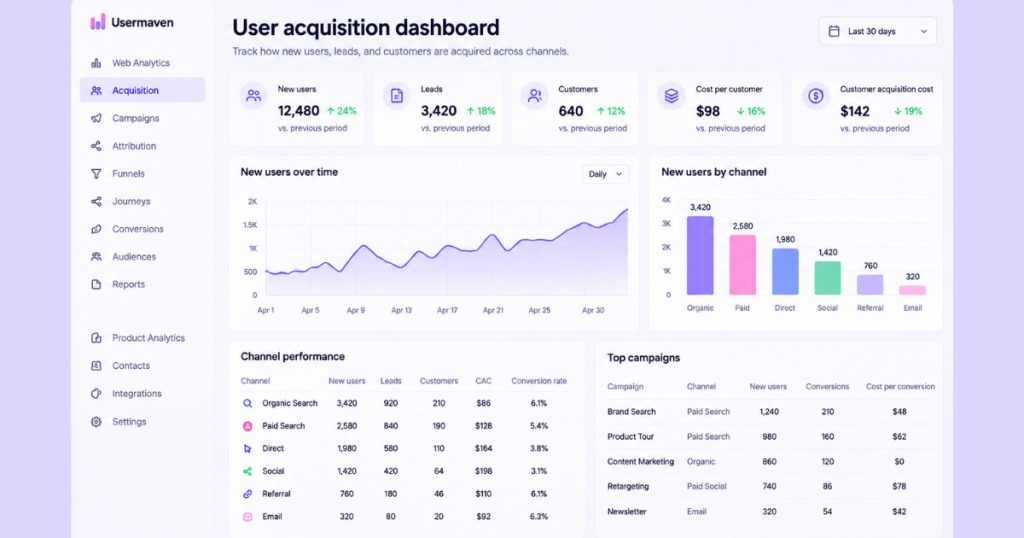
Key metrics to track:
- New users and leads.
- Customer acquisition cost (CAC).
- Cost per lead.
- Acquisition channel conversion rate.
- New customers by source.
Practical example: LinkedIn Ads generates fewer leads than Google Ads, but a higher percentage become paying customers.
Comparing lead volume, acquisition cost, and customer outcomes can help the team decide how to allocate its budget.
To evaluate spending more accurately, understand how to calculate and reduce customer acquisition cost.
3. Activation and onboarding dashboard
An activation dashboard tracks whether new users complete the actions needed to experience a product’s value.
This is particularly important for SaaS businesses, where a signup doesn’t necessarily mean someone has successfully adopted the product.
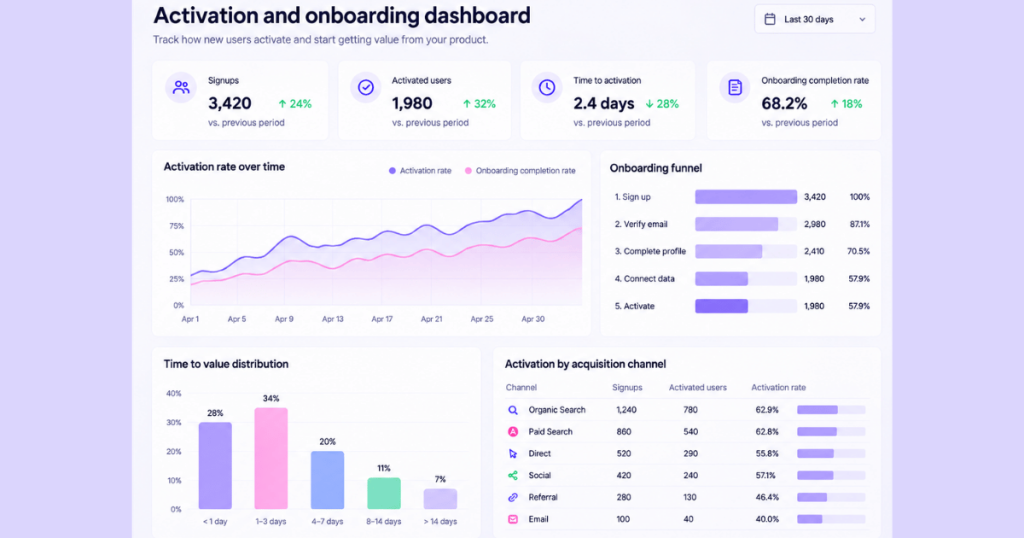
Key metrics to track:
- Onboarding completion rate.
- Activation rate.
- Time to first key action.
- Time to value.
- Onboarding drop-off rate.
Practical example: A SaaS product receives 500 new signups, but only 180 users complete the initial setup.
The dashboard can help identify which onboarding steps have the highest abandonment rates.
The team can then simplify the setup process, improve guidance, or investigate technical problems.
Tracking the right user onboarding KPIs helps distinguish registration activity from meaningful product activation.
4. SaaS business insights dashboard
A SaaS insights dashboard gives leadership a high-level view of business health.
Unlike a dashboard focused on one activity, it combines selected acquisition, product, retention, and revenue metrics.
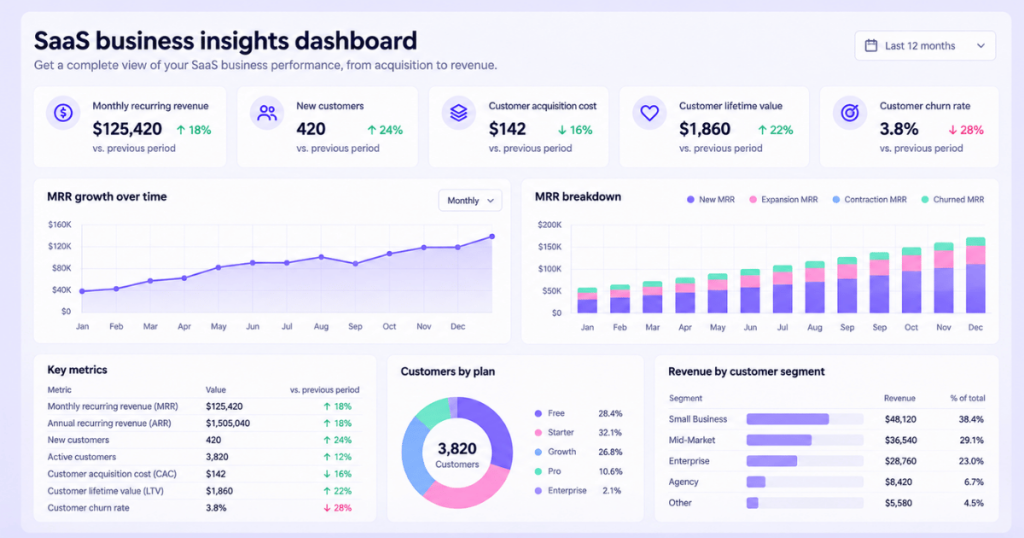
Key metrics to track:
- Monthly recurring revenue.
- New customers.
- Customer acquisition cost.
- Customer lifetime value.
- Customer and revenue churn.
Practical example: Revenue is growing, but customer acquisition costs are rising faster.
A leadership dashboard can highlight this imbalance and prompt further analysis of acquisition efficiency and customer profitability.
A broader B2B SaaS analytics approach can help connect marketing and product performance to business outcomes.
5. Feature adoption dashboard
A feature adoption dashboard measures whether customers discover and use specific product features.
It helps product teams understand which capabilities gain traction and which may need better onboarding or discoverability.
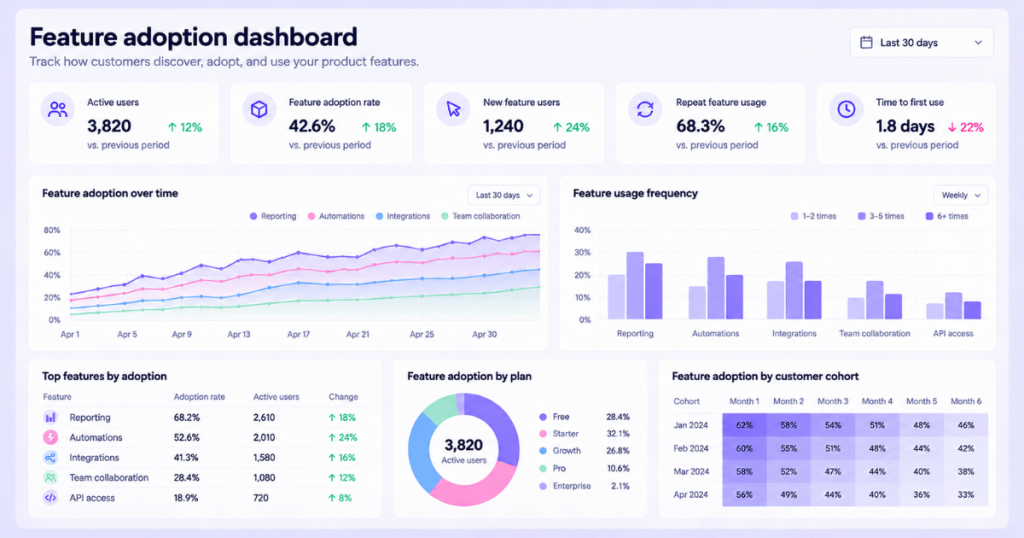
Key metrics to track:
- Feature adoption rate.
- Unique feature users.
- Usage frequency.
- Repeat feature usage.
- Adoption by customer segment.
Practical example: A SaaS company launches a new reporting feature.
After a month, only 12% of eligible users have tried it.
The team can investigate whether customers know the feature exists, understand its purpose, or encounter friction when using it.
An effective product analytics strategy helps connect feature usage to activation, retention, and other meaningful outcomes.
6. Customer retention dashboard
A customer retention dashboard shows whether customers continue using a product or service over time.
It helps businesses understand engagement trends and identify groups that may be at greater risk of leaving.
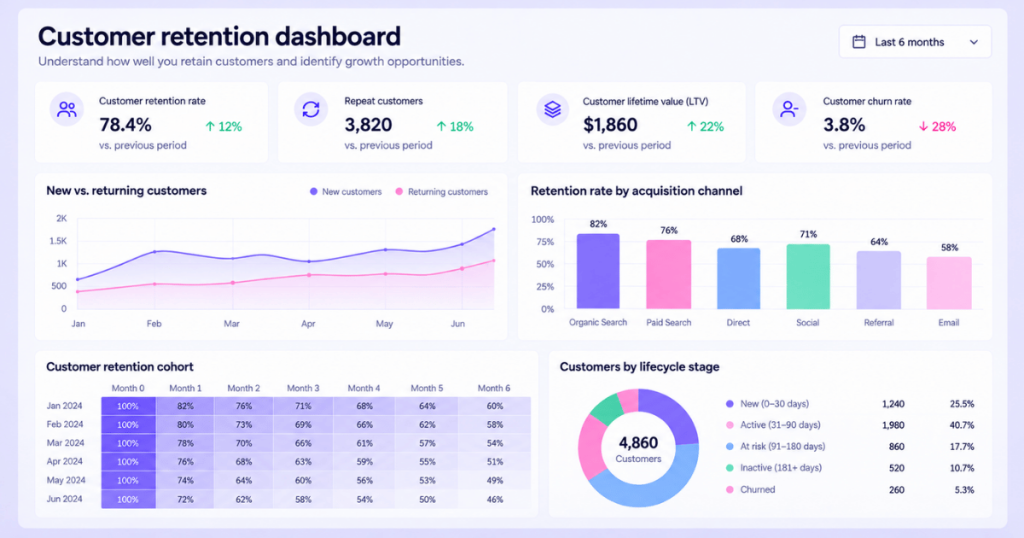
Key metrics to track:
- Customer retention rate.
- Cohort retention.
- Repeat usage.
- Customer lifetime value.
- Retention by acquisition source.
Practical example: Customers acquired through paid campaigns have lower 90-day retention than customers acquired through organic search.
The business can investigate differences in customer expectations, onboarding, or product fit.
Using cohort analysis to measure retention can reveal patterns that overall retention averages might hide.
7. Churn analysis dashboard
A churn dashboard tracks customer and revenue losses.
It helps teams identify when churn increases, which segments are affected, and whether behavioral changes appear before cancellations.
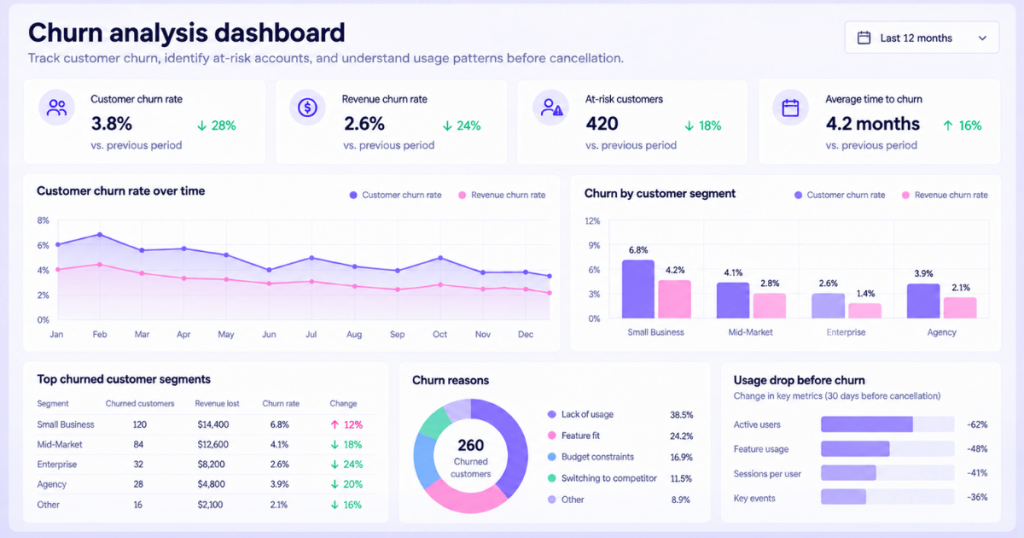
Key metrics to track:
- Customer churn rate.
- Revenue churn rate.
- Cancellations by segment.
- Churned monthly recurring revenue.
- Product engagement before cancellation.
Practical example: Customers who stop using a core feature during their first month appear more likely to cancel.
The team can investigate whether those customers need better onboarding, support, or product education.
However, a dashboard alone cannot establish why customers leave. Cancellation surveys and customer interviews are needed to understand the reasons.
Learn more about churn analysis and how to interpret customer loss patterns.
8. Revenue and MRR dashboard
A revenue dashboard helps businesses understand how revenue changes over time.
For subscription businesses, monthly recurring revenue is particularly useful because it separates recurring subscription changes from one-time payments.
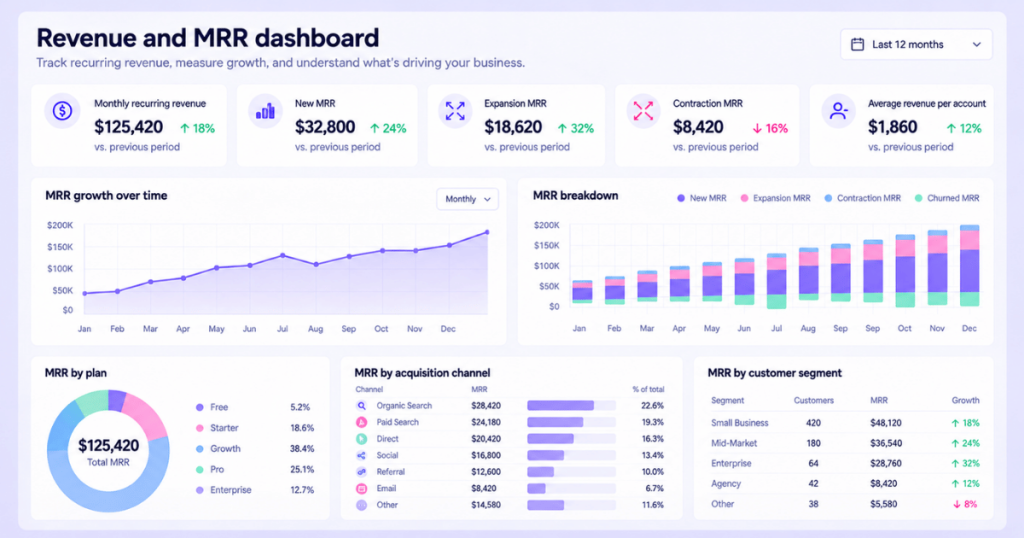
Key metrics to track:
- Monthly recurring revenue (MRR).
- New MRR.
- Expansion MRR.
- Contraction MRR.
- Churned MRR.
- Average revenue per account.
Practical example: Total MRR increased by 8%, but new customer revenue declined.
A revenue dashboard can show whether growth came primarily from existing customers upgrading their plans.
That distinction matters when evaluating acquisition performance and future growth.
For marketing teams, revenue attribution adds another perspective by examining how tracked marketing interactions contribute to revenue outcomes.
9. Product usage dashboard
A product usage dashboard tracks how customers interact with your software.
Unlike feature adoption dashboards, which focus on individual capabilities, product usage dashboards provide a broader view of engagement across the product.
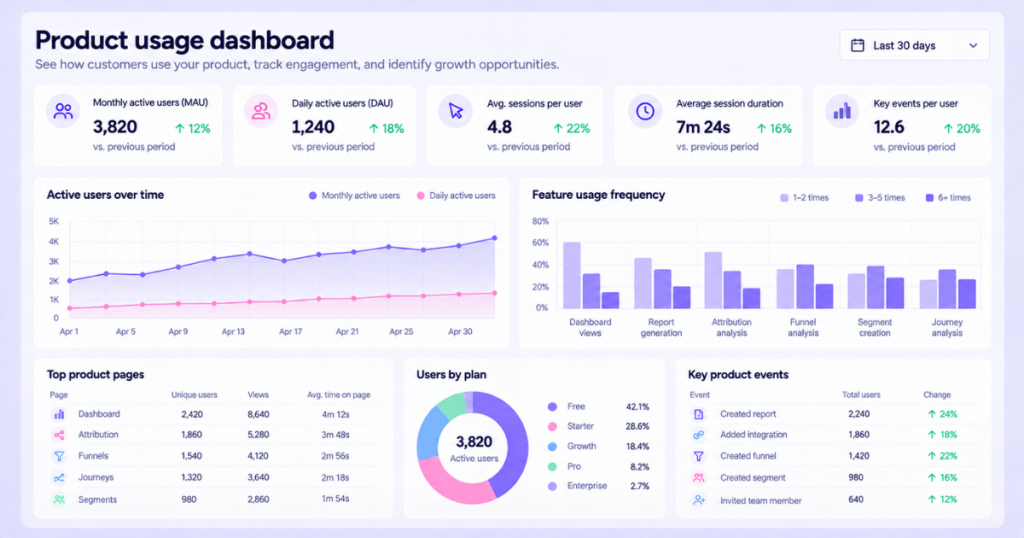
Key metrics to track:
- Daily and monthly active users.
- Sessions per user.
- Product events.
- Usage frequency.
- Engagement by customer segment.
Practical example: Monthly active users remain stable, but average usage frequency declines.
This could indicate a change in engagement, even though the overall active-user count appears healthy.
A product usage analytics framework can help teams investigate these changes and identify opportunities to improve the product experience.
10. Funnel conversion dashboard
A funnel conversion dashboard shows how users progress through a sequence of important steps.
It helps identify where potential customers abandon a process before completing a desired action.
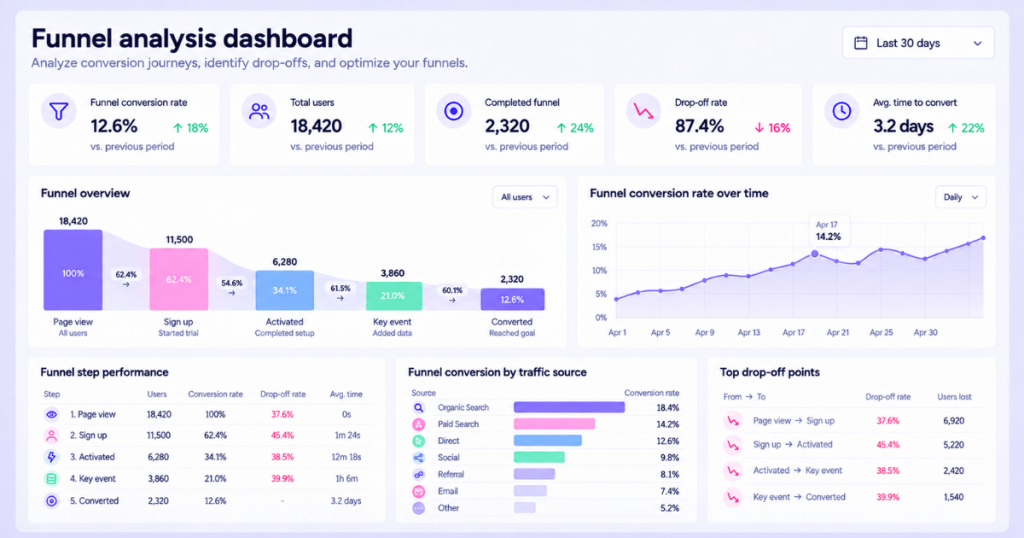
Key metrics to track:
- Overall funnel conversion rate.
- Stage-to-stage conversion rate.
- Drop-off rate.
- Funnel completion time.
- Conversion by customer segment.
Practical example: A SaaS signup funnel contains four steps:
Website visit → Signup started → Account created → Setup completed.
If 70% of users abandon the process between account creation and setup completion, the team can investigate that stage.
A well-structured conversion funnel helps turn this information into specific optimization opportunities.
11. Customer journey dashboard
A customer journey dashboard helps businesses understand how people interact with different channels and touchpoints before converting.
It can reveal common navigation paths, repeated interactions, and differences between customer segments.
Key metrics to track:
- Common conversion paths.
- Touchpoints before conversion.
- Time to conversion.
- Journey completion rate.
- Conversion by acquisition channel.
Practical example: Enterprise customers often visit comparison pages, return through organic search, and book a demo after several interactions.
A customer journey dashboard can help identify these patterns and support improvements to content, navigation, and follow-up experiences.
For a more detailed approach, explore customer journey analytics.
12. Google search performance dashboard
A Google search performance dashboard focuses on organic search visibility and engagement.
It helps SEO teams understand which search queries and pages attract traffic from Google.
Key metrics to track:
- Organic search clicks.
- Search impressions.
- Click-through rate.
- Average search position.
- Top-performing queries and pages.
Practical example: A blog post receives more impressions but fewer clicks than the previous month.
The team can review whether its average position changed, search demand shifted, or its title and description need improvement.
Combining Search Console data with website analytics can also help connect organic search traffic to conversions.
See how a Google Search Console dashboard can support more useful SEO reporting.
13. Marketing performance dashboard
A marketing performance dashboard helps teams evaluate campaigns, acquisition channels, and business outcomes.
Instead of focusing only on traffic and clicks, it should show how marketing activities contribute to leads, conversions, pipeline, and revenue.
Key metrics to track:
- Marketing spending.
- Qualified leads.
- Cost per acquisition.
- Return on ad spend.
- Attributed pipeline and revenue.
- Channel conversion performance.
Practical example: Paid social produces more leads than paid search, but paid search generates more qualified opportunities and revenue.
A marketing dashboard that connects campaign data to CRM outcomes can reveal this difference.
Using a marketing attribution dashboard helps teams investigate which recorded marketing touchpoints contribute to business results.
14. WooCommerce analytics dashboard
A WooCommerce analytics dashboard helps ecommerce businesses monitor store performance.
It combines sales, customer, and product data to show how an online store is performing.
Key metrics to track:
- Total orders.
- Ecommerce revenue.
- Average order value.
- Purchase conversion rate.
- Repeat purchase rate.
- Top-selling products.
Practical example: Store revenue increases while the number of orders remains unchanged.
The dashboard can help determine whether average order value increased or whether a different product mix contributed to the change.
For businesses investing in advertising, ecommerce attribution can add context about how marketing channels contribute to purchases.
15. Custom KPI dashboard
A custom KPI dashboard focuses on metrics that matter to a specific team, campaign, or business objective.
Instead of relying on a general template, it combines selected metrics into a purpose-built view.
Key metrics to track:
These depend on the objective. For a growth team, they might include:
- Qualified leads.
- Customer acquisition cost.
- Activation rate.
- Pipeline generated.
- Revenue attributed to marketing.
Practical example: A B2B SaaS company wants to understand whether its content marketing generates qualified pipeline.
It creates a dashboard showing organic visitors, content-assisted conversions, opportunities created, and attributed revenue.
This provides a more useful view than reporting only on blog traffic.
A dedicated content marketing dashboard can help teams connect content performance to measurable business goals.
What metrics should an analytics dashboard include?
The right metrics depend on the dashboard’s purpose.
Tracking every available number usually makes a dashboard harder to understand.
Here’s a practical starting point.
| Business area | Important metrics | Primary question |
|---|---|---|
| Website | Traffic, engagement, conversion rate | Are visitors taking meaningful actions? |
| Marketing | CAC, ROAS, attributed revenue | Which activities contribute to growth? |
| Product | Active users, activation, adoption | Are customers finding value? |
| Retention | Retention rate, churn, cohort performance | Are customers staying engaged? |
| Revenue | MRR, expansion, contraction, churned revenue | How is recurring revenue changing? |
| Sales | Opportunities, win rate, pipeline value | Are leads turning into customers? |
Start with three to five primary KPIs and add supporting metrics where they provide useful context.
For marketing teams, understanding marketing attribution metrics can help distinguish activity metrics from those connected to pipeline and revenue.
How to create an analytics dashboard in 6 steps
Building a dashboard starts with defining what you want to accomplish, not choosing chart colors.
Step 1. Define your business objective
Ask what decision the dashboard should support.
For example:
- Reduce customer acquisition costs.
- Improve trial activation.
- Identify high-performing campaigns.
- Increase customer retention.
- Monitor recurring revenue.
A clear objective prevents unnecessary metrics from taking over the dashboard.
Step 2. Identify the audience
Decide who will use the dashboard.
Executives may need high-level trends, while marketing managers need channel-level details.
The audience determines how much information to include and how frequently the dashboard should be reviewed.
Step 3. Choose relevant KPIs
Select metrics that directly support the objective.
For example, if the goal is improving onboarding, track activation rate, onboarding completion, and time to value.
Avoid adding unrelated metrics simply because they’re available.
Step 4. Connect reliable data sources
Identify where each metric comes from.
Common sources include:
- Website analytics platforms.
- Product event tracking.
- Advertising accounts.
- CRM systems.
- Ecommerce platforms.
- Subscription billing systems.
Check that definitions, time zones, attribution windows, and data refresh schedules are consistent.
Step 5. Design the dashboard
Place the most important KPIs at the top.
Use trend charts to show changes over time and comparison charts to evaluate segments or channels.
Add filters only when they help users investigate meaningful differences.
The dashboard should make its main message understandable without requiring a lengthy explanation.
Step 6. Review and improve regularly
After launching the dashboard, review whether it actually helps people make decisions.
Remove unused charts, correct confusing metrics, and add relevant comparisons as priorities change.
For example, if a marketing team shifts its focus from lead generation to revenue growth, the dashboard should reflect that change.
Analytics dashboard design best practices
A well-designed dashboard should make complex information easier to understand.
Keep important metrics visible
Place the most decision-relevant KPIs where readers can find them immediately.
Avoid hiding critical information below large decorative charts.
Use the right visualization
Choose charts based on what you’re communicating.
- Line charts for changes over time.
- Bar charts for comparisons.
- Tables for detailed values.
- Funnel charts for sequential conversion steps.
- Cohort tables for retention patterns.
Include meaningful comparisons
Show previous periods, targets, or benchmarks where appropriate.
For example, displaying a 4% conversion rate is more useful when readers can compare it with the previous month’s 3.2%.
Keep related metrics together
Group acquisition, conversion, retention, and revenue metrics into clear sections.
This helps users understand how different parts of the business relate to each other.
Explain unusual changes
When a metric changes significantly, provide enough context to support investigation.
For example, a sudden traffic increase may come from a successful campaign, bot traffic, or a tracking change.
Don’t assume that every change reflects actual business performance.
Design for the people using it
A dashboard for executives should be easy to scan.
A dashboard for analysts may need additional filters, breakdowns, and detailed tables.
The best design is the one that helps its intended audience answer important questions.
Common analytics dashboard mistakes to avoid
Even a visually impressive dashboard can lead to poor decisions when its data or structure is misleading.
Tracking too many metrics
Adding dozens of KPIs makes it difficult to identify what matters.
Focus on the metrics connected to your main objective.
Prioritizing vanity metrics
Traffic, impressions, and clicks can be useful, but they don’t automatically indicate business growth.
Include conversion and revenue outcomes where relevant.
Ignoring data quality
Duplicate events, missing conversions, inconsistent tracking, and outdated integrations can distort dashboard results.
Review data collection regularly and investigate unexpected changes.
Using misleading visualizations
Truncated axes, inconsistent scales, and inappropriate chart types can exaggerate differences.
Keep visualizations accurate and easy to interpret.
Treating correlation as causation
A dashboard might show that conversions increased after a campaign launch.
That doesn’t prove the campaign caused the increase.
Use additional analysis, experiments, or other evidence when making causal claims.
Failing to update dashboards
Business goals change.
A dashboard built for early-stage acquisition may become less useful when the company shifts toward retention or revenue efficiency.
Review dashboards regularly and adjust them to current priorities.
How to choose the right analytics dashboard
Before choosing a dashboard or analytics platform, consider what your business actually needs.
Ask yourself:
- What are we trying to measure? Website performance, product engagement, marketing ROI, or revenue?
- Who will use the dashboard? Marketing, product, finance, leadership, or multiple teams?
- Which data sources matter? Advertising platforms, CRM systems, website events, or product data?
- How much customization is required? Do you need standard reports or purpose-built KPI views?
- Can we investigate performance changes? Look for filtering, segmentation, and relevant analytical capabilities.
- How will we use the results? The dashboard should support specific decisions, not just regular reporting.
For example, a product-led SaaS business may prioritize activation, feature adoption, and retention.
A B2B marketing team may need deeper visibility into acquisition costs, marketing attribution, pipeline, and revenue.
The right dashboard should reflect those differences.
Website analytics tool for modern marketers & agencies
How Usermaven turns analytics dashboards into growth insights
Most businesses don’t struggle because they lack data.
They struggle because marketing, product, and revenue data are disconnected, making it difficult to understand what’s driving results.
Usermaven is an AI-powered marketing attribution platform that connects marketing spend and customer journeys to conversions, pipeline, and revenue.
It combines attribution, website and product analytics, customer journey analysis, and AI-powered insights to help teams understand performance and make better growth decisions.
Bring your important metrics into one place
Usermaven lets you build dashboards around the metrics that matter to your business.
You can organize relevant marketing, website, product, funnel, and attribution insights into views that support your team’s reporting needs.
For example, a marketing team can monitor acquisition performance alongside conversions and attributed revenue rather than relying on traffic numbers alone.
Understand which marketing channels drive revenue
With multi-touch attribution, Usermaven helps teams examine how recorded marketing interactions contribute to conversions.
When CRM outcomes are connected, teams can also analyze marketing’s contribution to pipeline and revenue.
This helps you compare channels beyond clicks and leads, identify valuable touchpoints, and make more informed budget decisions.
Find conversion and engagement problems
Usermaven combines funnel analytics, user journeys, segmentation, and product analytics to help investigate how customers move through your business.
For example, you can examine where visitors abandon a signup funnel or compare activation patterns across different acquisition channels.
This helps teams identify areas that deserve closer attention and prioritize improvements.
Build dashboards and reports with Maven AI
Maven AI makes it easier to explore connected marketing and product data conversationally.
You can ask questions such as:
- “Which channels generated the most attributed revenue this month?”
- “Where did our signup conversion rate decline?”
- “How does retention compare across acquisition sources?”
- “Which campaigns contributed to pipeline growth?”
Maven AI can generate relevant charts and reports from your data, which can be reviewed and saved to dashboards.
This helps teams move from questions to useful reporting without manually rebuilding every analysis.
Monitor performance with AI Agents
Usermaven also supports scheduled Maven AI Agents.
These agents can investigate selected metrics and workflows on a recurring schedule and deliver insights through supported reporting channels.
For example, a weekly growth review agent can help monitor acquisition, conversion, and revenue performance.
Instead of repeatedly checking the same reports, your team can spend more time investigating changes and deciding what to improve.
Make your dashboards useful beyond reporting.
Usermaven helps connect marketing performance, customer behavior, and revenue outcomes so your team can understand what drives growth and where to invest next.
Book a demo to explore how Usermaven can help you build dashboards and make better marketing decisions.
Power up your SaaS
with perfect product analytics
In summary
An analytics dashboard should help you understand performance, identify problems, and make better decisions.
The 15 examples above show how different teams can use dashboards to track acquisition, product engagement, customer retention, conversions, and revenue.
Start with a clear objective, choose relevant KPIs, connect reliable data sources, and keep the dashboard simple enough to act on.
For teams that need to understand how marketing contributes to business growth, marketing attribution software can add valuable context by connecting customer interactions to conversions, pipeline, and revenue.
FAQs
1. What is the difference between an analytics dashboard and a report?
An analytics dashboard provides an ongoing visual view of important metrics, often with filters and comparisons. A report typically presents a defined set of findings for a particular period, question, or audience. Dashboards can support reports, and reports may include dashboard data.
2. How many KPIs should an analytics dashboard have?
There’s no universal limit. Start with three to five primary KPIs that support the dashboard’s objective. Add supporting metrics when they help explain performance, but avoid filling the dashboard with unnecessary information.
3. What is the best analytics dashboard for a SaaS company?
It depends on the business model and goals. Product-led SaaS companies may prioritize activation, feature adoption, and retention. Sales-led SaaS businesses may focus more on acquisition costs, qualified pipeline, revenue attribution, and customer retention.
4. Can analytics dashboards combine data from multiple platforms?
Yes. Many analytics platforms support integrations with advertising accounts, CRMs, websites, and other systems. Available integrations, refresh frequencies, and supported metrics vary by provider.
5. How often should analytics dashboards be updated?
The appropriate frequency depends on the metrics and decisions involved. Operational dashboards may need frequent updates, while strategic dashboards may be reviewed weekly or monthly. Always check the freshness of each underlying data source.
6. What makes an analytics dashboard effective?
An effective dashboard has a clear purpose, relevant KPIs, reliable data, meaningful comparisons, and an easy-to-understand layout. Most importantly, it helps users decide what to investigate or improve.

Written by
Lauren Brooks
Lifecycle Marketing Strategist
Lauren Brooks is a lifecycle marketing strategist with 4+ years of experience helping SaaS businesses create meaningful customer experiences. She specializes in user engagement, retention, and conversion optimization, helping brands build stronger customer relationships beyond acquisition.
All articles by Lauren →