You’re spending money on ads. But how much revenue are those ads actually bringing in?
Clicks and conversions might look promising, but they don’t always tell you whether your advertising is paying off.
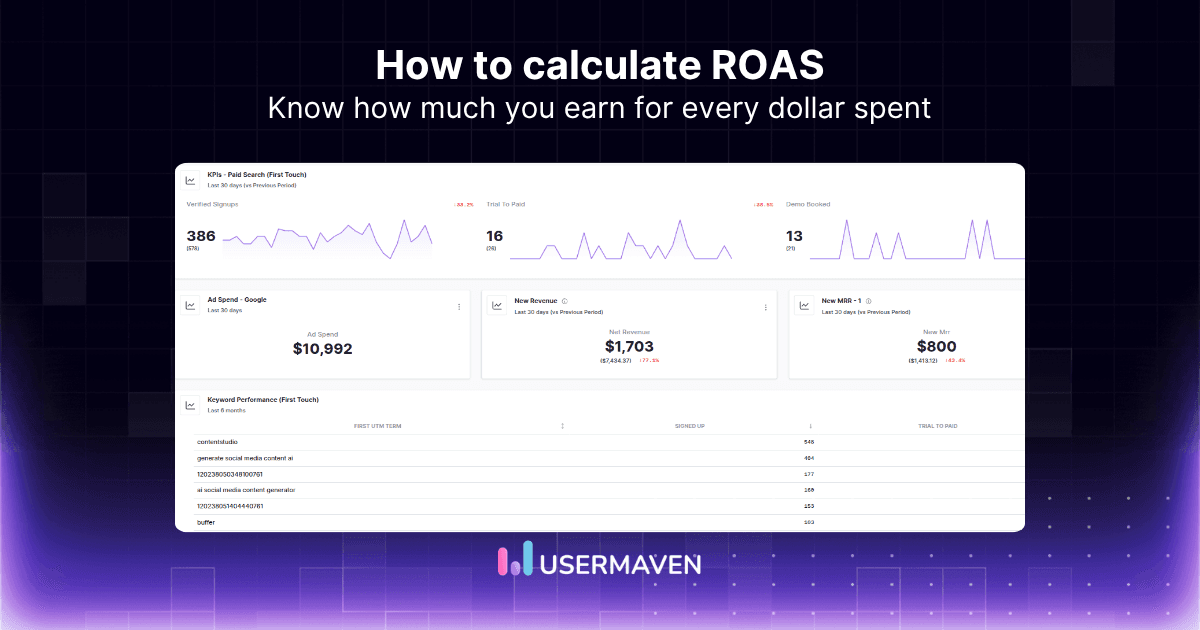
That’s where return on ad spend (ROAS) comes in. It tells you how much revenue your ads generate for every dollar spent.
But calculating ROAS is only half the picture. Understanding what your numbers mean, which campaigns deserve more budget, and whether your returns are actually profitable is what makes the difference.
Maximize your ROI
with accurate attribution
Key takeaways
- ROAS measures how much revenue your advertising generates for every dollar spent. Divide attributed ad revenue by advertising costs to calculate your return on ad spend.
- A higher ROAS doesn’t always mean higher profits. Your ideal ROAS depends on profit margins, operating costs, and business goals.
- Break-even ROAS helps you understand the minimum return needed to cover your costs. It’s an important starting point when setting realistic ROAS targets.
- Accurate ROAS calculations depend on reliable conversion tracking and revenue attribution. Comparing attribution models can help you understand how different campaigns contribute to results.
- Improving ROAS requires more than reducing ad spend. Focus on audience targeting, conversion rates, customer value, and allocating budget to campaigns that generate meaningful revenue.
What is ROAS (return on ad spend)?
Return on ad spend (ROAS) is a marketing metric that measures how much revenue your advertising generates compared to the amount you spend on ads.
It helps marketers evaluate the revenue performance of individual campaigns, ad groups, channels, or their overall advertising efforts.
For example, imagine an ecommerce business runs a Google Ads campaign that generates $8,000 in attributed sales from $2,000 in ad spend.
The campaign has a ROAS of 4:1, or 4x. This means it generated $4 in revenue for every $1 spent on advertising.
ROAS is particularly useful when comparing paid advertising performance across platforms such as Google Ads, Meta Ads, and LinkedIn Ads.
However, there’s an important distinction: ROAS measures attributed revenue, not profit. It doesn’t automatically account for product costs, salaries, fulfillment, or other business expenses.
That’s why a campaign can have a positive ROAS and still be unprofitable.
Maximize your ROI
with accurate attribution
How to calculate ROAS
Calculating return on ad spend is straightforward. You need two numbers: the revenue attributed to your advertising and the amount spent on those ads.
ROAS formula
You can express the result as a ratio, a multiplier, or a percentage.
ROAS calculation example
Suppose you run a Google Ads campaign with the following results:
- Total ad spend: $3,000
- Revenue attributed to the campaign: $15,000
Using the ROAS formula:
Your campaign generated a 5x ROAS, also written as 5:1 or 500%.
For every $1 spent on advertising, the campaign generated $5 in attributed revenue.
How to calculate ROAS in 3 steps
- Find your attributed revenue. Identify the revenue credited to your campaign during the reporting period. Use the same attribution method when comparing campaigns.
- Determine your advertising spend. Add up the media costs associated with the campaign, including the amount spent on the ads themselves.
- Divide revenue by ad spend. Apply the formula and express your result as a multiplier, ratio, or percentage.
How to calculate ROAS as a percentage
To convert ROAS into a percentage, multiply the result by 100.
For example, a 3.5x ROAS equals 350%, while a 2x ROAS equals 200%.
| ROAS ratio | Multiplier | Percentage |
|---|---|---|
| 1:1 | 1x | 100% |
| 2:1 | 2x | 200% |
| 3:1 | 3x | 300% |
| 4:1 | 4x | 400% |
| 5:1 | 5x | 500% |
What costs should you include in ROAS?
For a standard ROAS calculation, use the amount paid to the advertising platform to deliver your ads.
Other expenses, such as agency fees, creative production, software subscriptions, and employee salaries, are generally excluded from standard platform ROAS calculations.
You can include these costs in a broader, fully loaded return calculation, but clearly define your method and use it consistently.
Also, make sure your revenue and advertising spend cover comparable reporting periods and use consistent attribution settings. Otherwise, your ROAS calculation may give you a misleading picture of campaign performance.
ROAS calculator
Want to calculate ROAS without doing the math yourself?
Use Usermaven’s free ROAS calculator to quickly measure your advertising returns.
Simply enter your ad spend and attributed revenue to calculate ROAS and evaluate campaign performance.
What is a good ROAS?
A good ROAS depends on your business model, profit margins, customer acquisition costs, and advertising goals.
A 4x ROAS is often used as a general benchmark, but it isn’t a universal standard. A campaign generating 3x ROAS might be profitable for one business and unprofitable for another.
For example:
- Ecommerce: A business selling products with high margins may be profitable at 3x ROAS, while a retailer with thin margins may need 5x or more.
- B2B SaaS: A company may accept a lower initial ROAS if customers generate recurring subscription revenue over time.
- Lead generation: A campaign may generate leads rather than immediate purchases, so ROAS depends on connecting those leads to eventual sales revenue.
How to interpret your ROAS
| ROAS | What it means |
|---|---|
| Below 1x | Attributed revenue is lower than ad spend. |
| 1x | Attributed revenue equals ad spend, before other business costs. |
| 2x | Every $1 in ad spend generates $2 in attributed revenue. |
| 3x | Every $1 in ad spend generates $3 in attributed revenue. |
| 4x or higher | Stronger revenue return relative to ad spend, but profitability still depends on costs. |
How to set a realistic ROAS target
Instead of relying on industry averages, start with your business economics.
Consider your gross profit margin, acquisition costs, average order value, and customer lifetime value (CLV).
For example, a business with a 25% contribution margin before advertising needs at least 4x ROAS to cover its ad spend, assuming the attributed revenue and costs are measured consistently.
The most useful ROAS target is one that supports your profitability and growth goals, not simply a number that looks impressive in an advertising dashboard.
How to calculate break-even ROAS
Break-even ROAS is the minimum return on ad spend needed to cover your advertising costs without making a profit or loss on the costs included in your calculation.
It helps you set a realistic ROAS target based on your business margins rather than relying on general industry benchmarks.
Break-even ROAS formula
Use your contribution margin as a decimal. This is the percentage of revenue remaining after variable costs, excluding advertising spend.
Break-even ROAS example
Suppose an ecommerce business sells a product for $100, with the following costs:
- Product cost: $40
- Shipping and fulfillment: $10
- Payment processing: $5
After these expenses, $45 remains, giving the business a 45% contribution margin.
The business needs approximately 2.22x ROAS to cover its variable costs and advertising spend.
Break-even ROAS vs. target ROAS
Break-even ROAS represents your minimum required return based on the costs included in the calculation. Target ROAS is the return you aim to achieve to support your profit and growth goals.
For example, if your break-even ROAS is 2.22x, you might target 3x or higher to leave room for fixed operating expenses and profit.
Keep in mind that this simplified calculation assumes a consistent contribution margin and doesn’t account for fixed business costs.
ROAS vs. ROI, CPA, and ACoS
ROAS measures advertising revenue efficiency, but it doesn’t tell you whether a campaign is profitable. Other metrics, such as return on investment (ROI), cost per acquisition (CPA), and advertising cost of sales (ACoS), provide additional context.
Here’s how they compare:
| Metric | What it measures | Formula |
|---|---|---|
| ROAS (Return on ad spend) | Revenue attributed to advertising relative to ad spend | Attributed revenue ÷ Ad spend |
| ROI (Return on investment) | Net return relative to the total investment being evaluated | (Return − Total investment cost) ÷ Total investment cost × 100 |
| CPA (Cost per acquisition) | Average advertising cost per acquisition | Ad spend ÷ Acquisitions |
| ACoS (Advertising cost of sales) | Advertising spend as a percentage of attributed sales revenue | Ad spend ÷ Attributed sales revenue × 100 |
How are ROAS and ACoS related?
ROAS and ACoS use the same numbers but express the relationship differently.
For example, if you spend $1,000 on ads and generate $5,000 in attributed sales:
- ROAS = 5x
- ACoS = 20%
A higher ROAS means a lower ACoS when both metrics use the same revenue and advertising spend.
While ROAS helps you compare advertising returns, evaluating it alongside acquisition costs and profitability gives you a better understanding of campaign performance.
How to tell if your ads are actually paying off
A campaign can generate plenty of revenue and still fall short of your business goals. The important question is whether its returns justify what you’re spending.
To evaluate your advertising performance, compare your actual ROAS with your break-even ROAS and target ROAS.
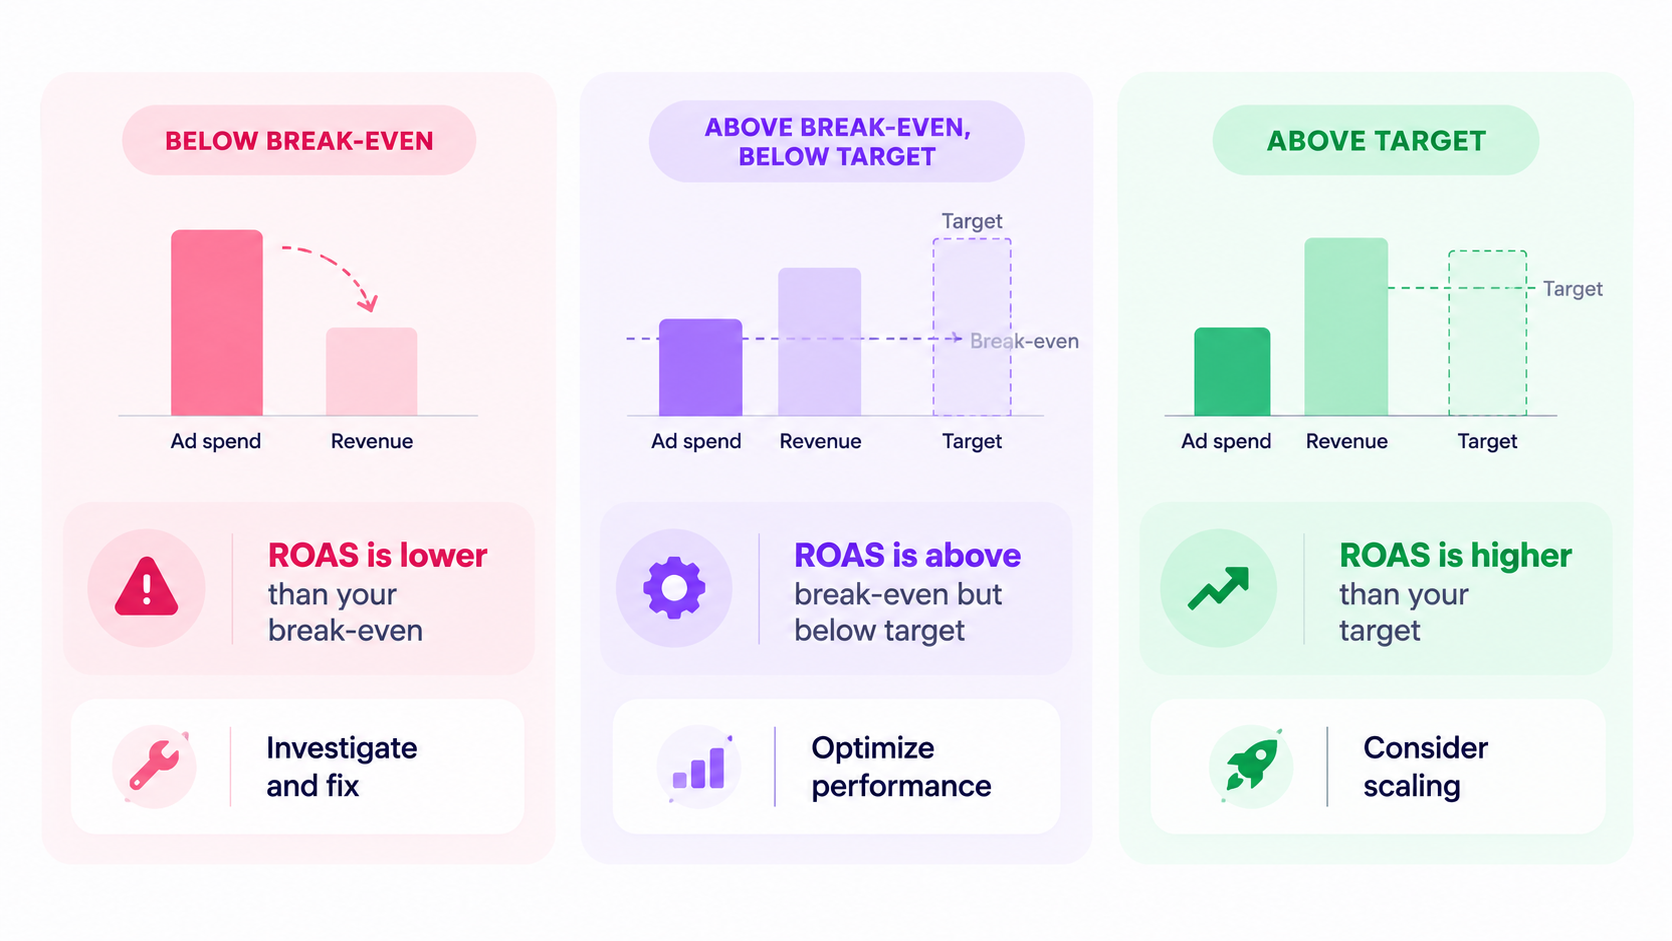
Compare your ROAS against your targets
Imagine you’re running three paid advertising campaigns with a break-even ROAS of 2.5x and a target ROAS of 4x.
Here’s how their performance compares:
| Campaign | Ad spend | Attributed revenue | Actual ROAS | What it tells you |
|---|---|---|---|---|
| Google Ads | $2,000 | $10,000 | 5x | Above target |
| Meta Ads | $3,000 | $9,000 | 3x | Above break-even, below target |
| LinkedIn Ads | $2,000 | $4,000 | 2x | Below break-even |
These results suggest different next steps:
- Google Ads: Investigate opportunities to increase spending while monitoring whether returns remain strong.
- Meta Ads: Review targeting, conversion rates, and acquisition costs to find opportunities for improvement.
- LinkedIn Ads: Investigate why returns are below break-even before committing more budget.
These are illustrative results. They assume the same contribution margin applies to all three campaigns and that revenue is attributed consistently.
Look beyond immediate advertising revenue
For businesses with longer sales cycles, especially B2B SaaS, immediate ROAS may not capture the full value of an advertising campaign.
For example, a LinkedIn Ads campaign might generate demo requests that convert into paying customers several weeks later. Evaluating only immediate purchases could underestimate its contribution.
Google Ads also explains that conversion delays can affect reported ROAS, making recent campaign performance appear weaker before all conversions have been recorded. That’s why it’s important to account for your sales cycle before reducing advertising spend.
Before making budget decisions, consider:
- Customer lifetime value (CLV): Do acquired customers generate recurring revenue over time?
- Sales cycle length: Has enough time passed for leads to become customers?
- Pipeline and closed-won revenue: Are campaigns attracting prospects who eventually generate revenue?
- Attribution: Are multiple marketing channels contributing to the same conversions?
How to improve ROAS and get better returns from your ads
Improving ROAS isn’t always about spending less. Sometimes, the biggest opportunity comes from attracting better customers, improving conversion rates, or investing more in campaigns that generate valuable sales.
Here are six practical ways to improve your return on ad spend.
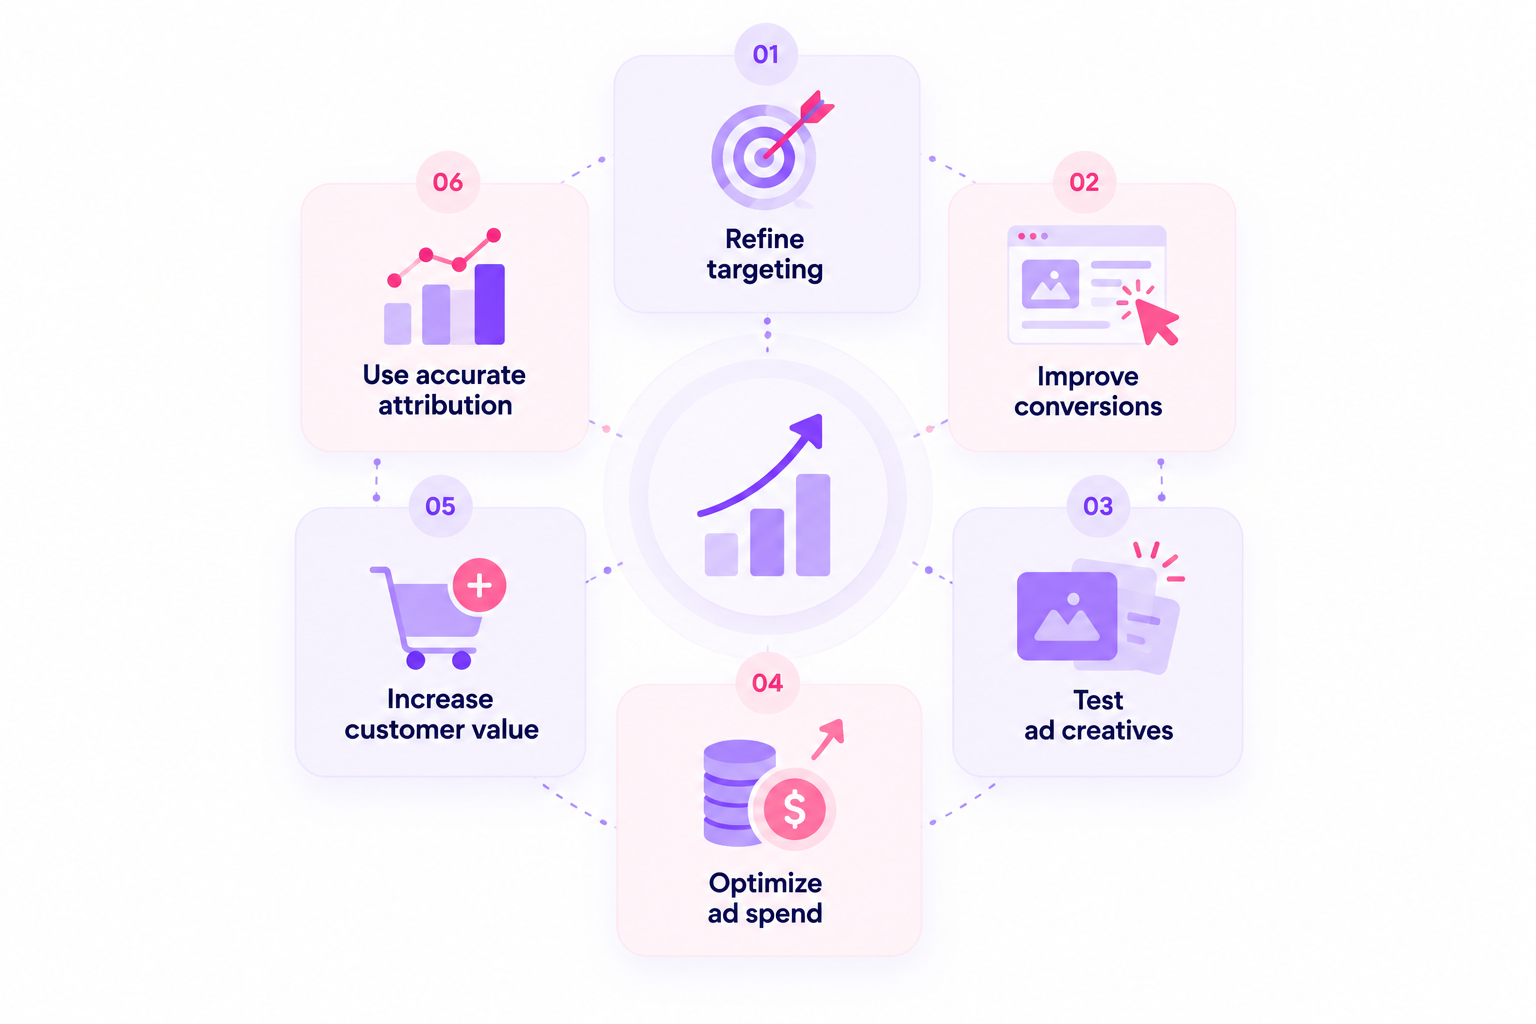
1. Refine your audience targeting
Reaching more people doesn’t necessarily mean reaching the right people.
Review which audiences, keywords, and customer segments generate purchases or qualified leads, rather than focusing only on clicks.
- Exclude irrelevant search terms and low-intent audiences.
- Compare conversion performance across customer segments.
- Use customer and CRM data to identify high-value audiences.
2. Improve your landing page conversion rates
Even a well-targeted campaign can underperform if visitors don’t convert after clicking an ad.
Make sure your landing page delivers what the ad promises and gives visitors a clear next step.
Focus on improving page speed, messaging, mobile usability, and calls to action. Use funnel analysis to identify where visitors abandon the conversion process.
3. Test your ad creatives and messaging
Your ads should attract people who are likely to become customers, not just generate engagement.
Test different headlines, visuals, offers, and calls to action. Compare the results using attributed revenue and acquisition costs, not click-through rates alone.
4. Allocate budget based on revenue performance
Not every campaign deserves the same investment.
Compare campaigns against your ROAS targets and identify where additional spending could generate worthwhile returns.
Before increasing budgets, check whether campaigns can maintain their performance as spending grows. A campaign with a high ROAS at a small budget won’t necessarily deliver the same return at scale.
5. Increase average order value and customer value
Generating more revenue from each customer can improve advertising returns without requiring more clicks.
Depending on your business, consider:
- Relevant upsells and cross-sells.
- Product bundles or higher-value plans.
- Offers that encourage larger purchases.
- Retention and expansion strategies that increase customer lifetime value.
For subscription businesses, evaluate these improvements using an appropriate revenue measurement period rather than assuming future customer revenue has already been earned.
6. Optimize campaigns using accurate attribution data
A campaign’s reported ROAS depends on which conversions and revenue it receives credit for.
When customers interact with several ads before purchasing, relying on a single platform’s reporting may give you an incomplete picture of advertising performance.
Compare paid campaigns using consistent attribution settings and connect advertising data with actual customer outcomes where possible.
This helps you avoid cutting campaigns that contribute to valuable conversions or increasing budgets based on duplicated or incomplete revenue data.
Maximize your ROI
with accurate attribution
Why your reported ROAS might be inaccurate
Your ROAS calculation is only as reliable as the data behind it. Even when you’re using the correct formula, tracking gaps and inconsistent attribution can make campaigns appear more or less successful than they actually are.
Here are some common issues to watch for:
| Common issue | How it affects your ROAS | What to do |
|---|---|---|
| Duplicate conversions | Multiple advertising platforms may claim credit for the same sale, inflating combined reported revenue. | Deduplicate conversions and use consistent cross-channel attribution. |
| Missing conversion data | Untracked purchases or offline sales can make ROAS appear lower than it is. | Validate conversion tracking and connect relevant CRM and offline revenue data. |
| Different attribution windows | Platforms may credit conversions over different periods, making comparisons inconsistent. | Review attribution windows before comparing results. |
| Delayed revenue | Campaigns generating leads may appear ineffective before those leads become customers. | Account for sales cycle length and track eventual closed-won revenue. |
| Refunds and cancellations | Revenue that is later refunded or canceled can overstate actual returns. | Reconcile attributed revenue with finalized sales where possible. |
Why attribution matters when calculating ROAS
Imagine a customer clicks a Google Ad, later interacts with a LinkedIn Ad, and eventually purchases.
Both platforms might report the conversion based on their attribution settings. If you simply add their reported revenue together, you risk counting the same sale twice.
This is why platform-reported ROAS and cross-channel attributed ROAS can tell different stories.
A consistent attribution approach helps you understand how channels contribute to conversions without treating every platform’s reported revenue as additional sales.
Before making major budget decisions, make sure your conversion data is reliable, your reporting periods are comparable, and your attribution method matches what you’re trying to measure.
How Usermaven helps you measure and improve ROAS
Calculating ROAS is easy when someone clicks an ad and makes a purchase immediately. But what happens when a customer interacts with several campaigns before converting?
For example, a B2B SaaS customer might discover your business through Google Ads, return through a LinkedIn campaign, and book a demo before eventually becoming a paying customer.
Looking at individual advertising dashboards may not tell you how those interactions contributed to revenue.
Usermaven is an AI-powered marketing attribution platform that helps you connect advertising performance with user journeys, conversions, pipeline, and revenue.
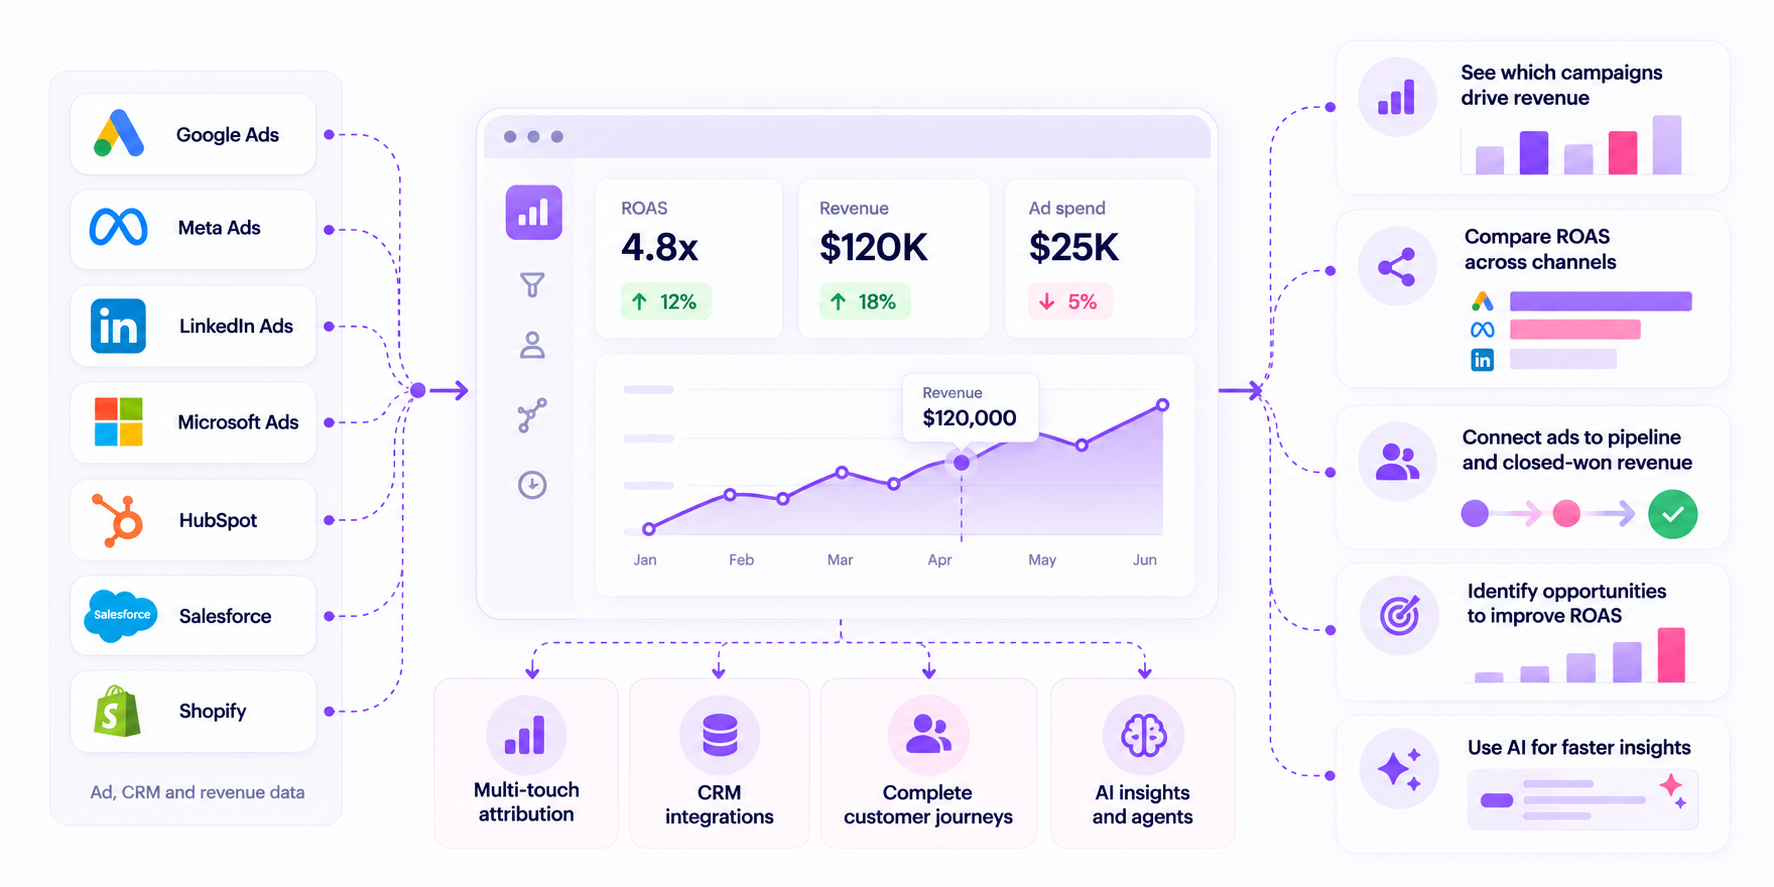
Here’s how it helps you make better decisions about your ad spend.
1. Understand which campaigns contribute to revenue
Usermaven brings advertising and attribution data together, helping you evaluate campaign performance beyond clicks, impressions, and lead volume.
With integrations for Google Ads, Meta Ads, LinkedIn Ads, and Microsoft Ads, you can analyze how paid marketing contributes to conversions and revenue.
This helps you identify campaigns that attract valuable customers rather than simply generating traffic.
2. Compare ROAS across attribution models
Different attribution models can tell different stories about the same customer journey.
For example, last-touch attribution might give LinkedIn Ads credit for a conversion, while first-touch attribution credits Google Ads.
With Usermaven’s multi-touch attribution, you can compare models such as first-touch, last-touch, linear, U-shaped, and time-decay attribution.
This helps you understand how revenue credit changes across models and which campaigns consistently contribute to customer acquisition.
Instead of reallocating budget based on a single attribution view, you can make decisions with more context.
3. Connect advertising spend to pipeline and closed-won revenue
For B2B SaaS companies, a lead isn’t the same as a paying customer.
A campaign might generate dozens of demo requests but only a few closed deals. Another might attract fewer leads that convert into higher-value customers.
Usermaven’s CRM integrations, including HubSpot and Salesforce, help connect marketing interactions with sales outcomes.
You can evaluate which campaigns contribute to qualified opportunities, pipeline, and revenue rather than judging performance by form submissions alone.
This is particularly useful when calculating ROAS for campaigns with longer sales cycles.
4. Identify opportunities to improve advertising returns
Once you understand how campaigns contribute to revenue, you can make more informed optimization decisions.
For example, you might discover that:
- A Google Ads campaign generates strong revenue despite having fewer conversions.
- A LinkedIn campaign contributes to high-value opportunities that close later.
- A Meta Ads campaign attracts traffic but contributes relatively little attributed revenue.
- Certain marketing channels play an important role earlier in the customer journey.
These insights help you decide where to increase investment, investigate underperformance, or adjust your strategy.
5. Analyze campaign performance with Maven AI
Usermaven’s Maven AI helps you explore marketing and attribution data using natural-language questions.
Instead of manually reviewing multiple reports, you can ask questions about campaign performance, conversion trends, and revenue contribution.
You can also use AI Agents to run scheduled analyses and receive findings through supported delivery channels, including email and Slack.
This makes it easier to review performance regularly and identify changes that may need attention.
Make your ROAS more useful with revenue attribution
A 5x ROAS looks impressive, but the number is only useful when you understand where the attributed revenue comes from and how it relates to your business goals.
Usermaven helps you evaluate paid advertising in the context of the complete customer journey, so you can move beyond isolated platform metrics and make more confident decisions about your marketing budget.
Book a demo to learn how Usermaven can help you measure advertising returns and identify opportunities for profitable growth.
Maximize your ROI
with accurate attribution
FAQs
Can ROAS be negative?
No. ROAS cannot be negative when ad spend is positive and attributed revenue is zero or greater. If a campaign generates no attributed revenue, its ROAS is 0x.
However, a campaign can lose money even with a positive ROAS because the calculation doesn’t account for all business costs.
How often should you calculate ROAS?
Review ROAS regularly, but choose a reporting period that reflects your typical conversion cycle.
Ecommerce businesses may benefit from daily or weekly reviews, while B2B SaaS companies with longer sales cycles may need monthly or quarterly evaluations.
Avoid making major budget decisions based on a few days of data when conversions take longer to occur.
Can you calculate ROAS for lead generation campaigns?
Yes, but you need to connect leads to revenue.
If a campaign generates demo requests or form submissions instead of immediate purchases, track which leads become paying customers and how much revenue they generate.
You can then divide the attributed revenue by your advertising spend. If revenue isn’t available yet, use metrics such as cost per qualified lead or cost per opportunity until you have enough sales data.
Should ROAS include repeat purchases?
It depends on what you’re measuring.
If you’re evaluating immediate campaign performance, use revenue attributed within your defined conversion window. If you’re measuring customer acquisition over a longer period, you can also analyze revenue from repeat purchases.
Keep these calculations separate and clearly label the revenue period so you don’t confuse immediate ROAS with longer-term customer value.
Can you calculate ROAS without tracking individual customers?
Yes. If you have reliable advertising spend and attributed revenue totals, you can calculate ROAS without identifying individual customers.
However, limited tracking may make it harder to determine which campaigns contributed to conversions, especially across multiple channels.In these cases, use available aggregated reporting and clearly document the attribution assumptions behind your calculation.
Updated

Written by
Imrana Essa
SaaS Marketing Lead
Imrana Essa is a marketing lead and content strategist with 8+ years of experience creating and leading content for B2B and SaaS brands. She specializes in marketing analytics, attribution, content strategy, and organic growth, translating complex marketing concepts into clear, actionable insights. Her work focuses on helping marketers understand performance, make data-informed decisions, and build strategies that contribute to sustainable growth.
All articles by Imrana →