Your Shopify dashboard shows $180K in monthly revenue. Your Meta Ads manager claims it drove $95K of that. Your Google Ads account claims another $75K. Add both platform numbers together, and the claimed attribution exceeds the actual revenue your store generated.
This is the ecommerce attribution problem. And that is why most ecommerce brands are optimising for channels that appear profitable but are not.
Ecommerce performance analytics is the discipline that closes this gap. It connects ad spend to actual store revenue using independent, first-party tracking rather than platform self-reporting.
This guide covers everything: the definition, key metrics, the four types of analytics, how to set up your measurement stack, and how to avoid the mistakes that quietly skew your data. For a foundation on the broader discipline, see the complete performance analytics guide first.
Key takeaways
Ecommerce performance analytics is the practice of collecting, measuring, and analysing data across traffic, conversion, revenue, and retention to evaluate and improve online store profitability
Platform-reported attribution overstates results: Google, Meta, and Shopify each claim credit for the same sale using different attribution windows, inflating ROAS and misleading budget decisions
The four types of ecommerce analytics are descriptive, diagnostic, predictive, and prescriptive, each serving a different decision stage and requiring different data depth
Key metrics span four categories: acquisition, conversion, revenue, and retention. Tracking only one category creates blind spots that cost margin
Usermavenprovides independent first-party attribution for ecommerce brands, connecting ad spend to actual revenue without relying on platform-reported numbers.
What is ecommerce performance analytics?
Ecommerce performance analytics is the systematic process of collecting, measuring, and analysing data from an online store to evaluate performance across traffic, conversion, revenue, and customer retention, and to turn those findings into decisions that improve profitability.
It is the operational layer that answers the question every ecommerce operator needs answered: which activities are actually driving revenue, and which ones just look like they are?
Unlike standard web analytics, which focuses on on-site behaviour, ecommerce performance analytics connects store data to ad platform data, CRM records, and revenue data. The result is a complete picture of what drives profit, not just what drives traffic.
This connection to marketing attribution is where most ecommerce brands lose accuracy. Each ad platform counts conversions differently, using different attribution windows and different conversion definitions. Without an independent layer above all platforms, brands cannot know which numbers to trust.
What ecommerce performance analytics is not
It is not platform-reported ROAS. Google Ads reports the results it wants advertisers to see, counted by its own attribution logic. So does Meta. Both are incentivised to show strong performance. Neither represents the complete picture.
It is not session tracking alone. Knowing how many people visited your store tells you nothing about why the conversion rate dropped 15% in week three of a campaign, or which traffic sources are bringing customers who never buy again.
It is not retrospective reporting. Effective ecommerce analytics does not just explain what happened. It informs the next decision before the next campaign goes live.
The distinction between ecommerce conversion tracking and full ecommerce performance analytics is similar: conversion tracking records what happened, while performance analytics explains why and what to do next.
Why ecommerce performance analytics matters in 2026
The case for ecommerce performance analytics has strengthened every year since iOS 14. In 2026, three structural changes make it a competitive requirement rather than a nice-to-have.
Ad platform accuracy is declining while ad costs are rising
Platform pixels miss a growing share of conversions due to iOS privacy restrictions, ad blockers, and cookieless browsers. Brands optimising on platform-reported data are making budget decisions on incomplete information while paying more per click than they were two years ago.
The result is that platform ROAS figures inflate while actual return on investment quietly decreases. Facebook ads attribution in particular has become significantly less reliable post-iOS 14, with Meta’s own estimates showing 15% to 20% underreporting of iOS conversions.
The multi-channel customer journey is the norm, not the exception
Ecommerce customers rarely convert on one touchpoint. A customer might see a Meta ad, search Google three days later, read a review, and convert on a direct visit a week after that. Platform attribution assigns 100% of the credit to the last click and misses the full story.
Digital marketing metrics and KPIs frameworks built on last-click attribution systematically undervalue the channels that initiate and assist conversions and overvalue the ones that merely collect them.
Retention has become the primary growth lever
Acquiring a new customer in 2026 costs significantly more than retaining one. Brands without retention analytics, including repeat purchase rates, customer lifetime value by cohort, and churn signals, are leaving their most profitable growth lever unmeasured.
Revenue analytics that connect acquisition spend to retention outcomes reveal which channels bring your best long-term customers versus which ones bring one-time buyers at an unsustainable cost.
According to Statista global ecommerce market data, global ecommerce revenue is projected to exceed $7.9 trillion by 2027. The brands that capture the most margin in that market will be those that measure performance accurately, not those with the largest ad budgets.
Research from the Baymard Institute on cart abandonment shows the average documented online cart abandonment rate is 70.19%, representing over $260 billion in recoverable revenue for US and EU brands annually. Ecommerce performance analytics is the system that identifies where in the checkout flow revenue is being lost.
Key ecommerce performance metrics to track
The right set of ecommerce performance metrics depends on the business model and the questions the team needs to answer. Choosing too many creates noise. Choosing too few creates blind spots. The most effective approach organises metrics into four categories, each measuring a different stage of the customer journey.
Traffic and acquisition metrics
Sessions by channel: Total visits segmented by source, including organic search, paid search, paid social, direct, email, and referral. The baseline view for acquisition analysis and the starting point for any channel comparison.
Cost per acquisition (CPA): Total spend divided by customers acquired in a defined period. Not leads, not clicks, not impressions. Customers. This is the metric that determines whether the acquisition is sustainable.
New vs returning visitor ratio: A high new visitor share signals acquisition dependency. Low new visitor share signals retention strength. The balance between the two reflects the health of both sides of the growth equation.
Click-through rate (CTR) by channel: CTR compared against landing page conversion rate reveals whether the problem is at the ad level or the page level. A high CTR with a low conversion rate means the ad is attracting the wrong audience or the page is failing to convert the right one.
Number of sessions: Total sessions and sessions by source. For a complete methodology on tracking and interpreting this metric accurately, see the guide to the number of sessions.
Conversion and checkout metrics
Ecommerce conversion rate: Visitors to completed purchases. Industry benchmark ranges from 1% to 4% depending on category and traffic source mix. A meaningful conversion rate analysis always segments by channel, device, and product category rather than using the blended rate alone.
Cart abandonment rate: Industry average exceeds 70%. Segmenting by device, traffic source, and product category identifies exactly where to focus recovery efforts.
Checkout abandonment rate: Distinct from cart abandonment. This measures drop-off specifically within the checkout flow after a session has initiated the checkout process. High checkout abandonment usually points to friction in the payment or shipping steps.
Add-to-cart rate: Visitor to cart addition ratio. A leading indicator of purchase intent that sits upstream from the conversion rate. A falling add-to-cart rate signals a product positioning or pricing problem before it appears in the conversion rate.
Product page conversion rate: Individual SKU conversion rates reveal high-intent products versus high-traffic products with low purchase rates. This segmentation drives smarter inventory, pricing, and merchandising decisions.
Revenue and profitability metrics
Average order value (AOV): Total revenue divided by the number of orders. Increasing AOV by 10% delivers the same margin impact as acquiring 10% more customers at zero additional ad spend. Upsell and bundle strategies live and die by this number.
Return on ad spend (ROAS): Revenue attributed to ads divided by ad spend. Meaningful only when the attribution is independent of what each ad platform reports. Platform ROAS figures are starting points, not conclusions.
Gross margin by channel: Revenue per channel minus product cost and fulfilment per channel. The only metric that reveals whether a channel is actually profitable after accounting for the cost of the goods it sells. High-ROAS channels can have low margins if they systematically attract discount buyers.
Revenue by traffic source: Which channels bring buyers, not just visitors. Essential for budget allocation decisions and for identifying which acquisition channels are worth scaling.
Refund and return rate: High return rates in specific channels or product categories signal quality, targeting, or expectation-setting problems. A channel with strong ROAS but a 30% return rate is often less profitable than it appears.
See the guide to cross-platform ad tracking for how to reconcile revenue figures across Google, Meta, and Shopify into one consistent view.
Retention and loyalty metrics
Repeat purchase rate: The percentage of customers who buy more than once. The single strongest indicator of product-market fit and brand health in ecommerce. A repeat purchase rate below 20% signals that acquisition costs are compounding without a retention base to absorb them.
Customer lifetime value (CLV): Total revenue a customer generates across all orders. CLV by acquisition channel reveals which channels bring your most valuable customers, not just your cheapest first-order buyers. This is where the real channel budget decision lives.
Purchase frequency: Average number of orders per customer per period. Used to set retention campaign timing, loyalty programme thresholds, and subscription offer eligibility.
Churn rate: For subscription ecommerce, the percentage of active subscribers who cancel in a given period. The mirror metric to repeat purchase rate for non-subscription stores.
For a full breakdown of the tools used to track these metrics across channels, see performance analytics tools.
The 4 types of ecommerce analytics (and when to use each)
Understanding the four types of ecommerce analytics reveals where most brands are operating, and more importantly, where the largest performance gains are being left unrealised.
1. Descriptive analytics: What happened?
Descriptive analytics summarises historical data. Revenue last month. Sessions last week. Top-selling SKUs last quarter. Conversion rate over the past 30 days.
This is the baseline layer every ecommerce brand already has. Shopify reports, GA4 dashboards, and ad platform summaries are all descriptive analytics.
The problem is that most brands stop here. Knowing what happened is not the same as knowing why it happened or what to do next.
2. Diagnostic analytics: Why did it happen?
Diagnostic analytics goes beyond the summary to identify causes. Why did the conversion rate drop in week three of a campaign? Why did AOV fall while traffic grew? Which traffic segment drove the revenue increase in Q4?
This requires segmentation, cohort analysis, and funnel breakdowns. It is the difference between a dashboard and an investigation. Most teams have the tools for diagnostic analytics but lack the process to use them consistently.
3. Predictive analytics: What will happen?
Predictive analytics uses historical patterns to forecast future performance. Expected revenue next month. CLV predictions by acquisition cohort. Likelihood of a return purchase within 30 days from a specific customer segment.
This layer requires sufficient historical data volume and a tool capable of running predictive models. AI-powered analytics platforms have made predictive ecommerce analytics accessible to mid-market teams for the first time.
4. Prescriptive analytics: What should we do?
Prescriptive analytics recommends specific actions based on data patterns. Which campaigns should be scaled before peak season? Which product categories to promote to which customer segments? Which audiences to suppress from paid campaigns to protect the margin.
This is the highest-value layer and the one most directly connected to revenue outcomes. It is also the layer where data-driven attribution matters most, because prescriptive recommendations are only as good as the data quality feeding them.
Most ecommerce brands operate at the descriptive level and occasionally reach diagnostic. The gap between where they are and prescriptive is where the largest revenue opportunity sits.
How to set up ecommerce performance analytics step-by-step
Setting up ecommerce performance analytics correctly from the start prevents the data quality problems that make analytics unreliable months later. These six steps cover the full setup in the right order.
Step 1: Define your goals before choosing your metrics
Revenue growth, margin improvement, retention, and customer acquisition all require different metric sets and different attribution configurations. Setting up tracking without a defined goal produces dashboards that look comprehensive but trigger no decisions.
Start with two or three specific business questions the analytics system needs to answer. Everything else follows from those questions.
Step 2: Implement first-party tracking on your store
Platform pixels alone miss 20% to 40% of conversions due to ad blockers, iOS restrictions, and cookieless browsers. Deploy a first-party tracking solution that collects data server-side and independently of platform pixels.
Server-side tracking sends event data directly from your server to your analytics platform, bypassing client-side restrictions. Combined with first-party data collection, it gives near-complete conversion coverage across all browsers and devices.
Step 3: Connect your ad platforms and CRM
Link Google Ads, Meta Ads, and any other paid channels to a single attribution workspace. Without this connection, ROAS figures from each platform exist in isolation and cannot be reconciled against CRM revenue or each other.
Step 4: Set up conversion tracking for every goal event
Purchase is one goal event. Add-to-cart, product page view, checkout initiation, and email capture are also conversion points worth tracking independently. Each one reveals a different stage of purchase intent and a different point of potential funnel failure.
Consistent UTM parameters across every campaign and channel are the baseline requirement for accurate source attribution. Without consistent UTM discipline, session and conversion data fragments across sources in ways that cannot be corrected retroactively.
Step 5: Build your performance dashboard
A useful ecommerce analytics dashboard answers one question per section: what is acquisition costing? What is converting? What is the revenue mix by channel? What is retention doing?
Avoid a single all-metrics view. It creates noise rather than clarity. The most actionable dashboards surface exceptions and outliers, not every number in the data set.
Step 6: Set a review cadence and assign ownership
Weekly reviews catch conversion rate drops and budget inefficiencies early. Monthly reviews track trend direction and cohort behaviour. Quarterly reviews assess strategy and attribution model configuration.
Each review should end with one specific action, not a summary of numbers. Analytics without a decision attached to it is reporting. Analytics that change what the team does next is performance measurement.
Drive business growth with AI-powered analytics
*No credit card required
Common ecommerce analytics mistakes that skew your data
Most ecommerce analytics problems are not tool problems. They are process and setup problems that produce data that looks accurate but is not.
1. Relying on platform-reported attribution
Google Ads counts a conversion if someone clicks an ad in the last 30 days. Meta counts a view-through conversion if someone saw an ad in the last 7 days. Both can claim the same customer. Both are technically correct by their own rules. Neither gives you an accurate picture of which channel actually drove the purchase.
The ad platform discrepancies guide documents exactly how this happens and what independent attribution reveals when you stack both views side by side.
2. Tracking sessions without connecting to revenue
High-session, low-revenue traffic is a budget problem disguised as a traffic metric. Traffic quality matters more than traffic volume for ecommerce profitability. A campaign that drives 50,000 sessions with a 0.3% conversion rate is not a traffic success.
3. Ignoring the mobile conversion gap
Mobile typically drives 60% to 70% of ecommerce traffic but a significantly lower share of conversions. Treating mobile and desktop as one blended conversion rate masks a major optimisation opportunity on both sides.
4. Not segmenting new versus returning customers
Blended conversion rates hide the difference between acquisition performance and retention performance. A rising overall conversion rate can mask a declining new customer conversion rate if returning customers are compensating for it.
5. Setting it up and leaving it
Analytics setups decay. Pixels break silently. UTM parameters become inconsistent across campaigns. Ad platform connections drop. A setup not actively reviewed produces data that looks accurate until a discrepancy surfaces at the end of a quarter.
Cookieless tracking configurations in particular need regular verification as browser privacy defaults continue to tighten and affect how session data is collected and attributed.
See also: Google Analytics limitations for a breakdown of where GA4 specifically falls short as a standalone ecommerce analytics solution.
How Usermaven powers ecommerce performance analytics
Usermaven is an AI-powered marketing attribution platform that connects ad platforms, CRM, and website data to track the full customer journey in real time using first-party and server-side tracking.
For ecommerce brands specifically, Usermaven solves the core problem that makes most analytics setups unreliable: each platform reports its own version of what happened. Usermaven sits above Google Ads, Meta Ads, and Shopify and produces one attribution view that reconciles what each platform claims against what actually happened in revenue.
Usermaven’s marketing attribution platform software captures every session and conversion event using a first-party pixel that bypasses most ad blockers. The marketing attribution software layer connects every paid touchpoint to revenue outcomes using seven attribution models: first-touch, last-touch, linear, time-decay, position-based, data-driven, and custom rules.
The gap between what platforms claim and what Usermaven measures is typically 20% to 40% in ad spend justification. That gap is the difference between scaling the right channel and scaling the wrong one.
2. Maven AI for ecommerce decisions
Maven AI answers ecommerce performance questions in plain language without SQL or analyst dependency. Which campaign drove the highest CLV customers last quarter? Which channels should be scaled before peak season? Which audience segments have the highest repeat purchase rate?
The answers are available in seconds, directly from the performance data Usermaven collects independently of what any platform reports.
3. First-party tracking with near-complete coverage
Usermaven’s server-side tracking captures conversions that platform pixels miss due to ad blockers and browser privacy settings. For ecommerce brands running campaigns to iOS audiences, this coverage gap is significant. Platform data shows a partial picture. Usermaven shows the full one.
4. Privacy-first by default
GDPR and CCPA compliance are built in, not added as an upgrade. Cookieless tracking, consent management, and data residency controls are available from day one. See Usermaven’s GDPR and CCPA documentation for the full compliance details.
5. No-code setup in minutes
No developer dependency for implementation, attribution model changes, or new campaign tracking. Ecommerce teams own and operate their performance analytics independently from day one.
See what's working. Fix what's not. Grow faster.
*No credit card required
Conclusion
Ecommerce performance analytics is not a reporting function. It is the operational system that connects every dollar of ad spend to every dollar of actual revenue, across every channel, in a way that individual platform dashboards never will.
The four metric categories, the four types of analytics, and the six setup steps in this guide are the foundation. But the foundation only works if the data feeding it is accurate and independent of what any single platform wants you to believe.
Usermaven’s guided analytics setup connects your ad platforms, store data, and CRM into one ecommerce performance analytics layer in minutes.
Start your free trial with no credit card required. Or book a demo to see exactly where your current attribution is giving you an incomplete picture.
FAQs
1. What is ecommerce performance analytics?
Ecommerce performance analytics is the systematic practice of collecting, measuring, and analysing data across an online store’s traffic, conversion, revenue, and retention to evaluate how the store is performing and identify decisions that improve profitability. It connects ad spend to actual revenue outcomes using independent measurement rather than relying on what individual platforms report.
2. What are the key performance metrics for ecommerce?
The key metrics span four categories: acquisition (sessions by channel, cost per acquisition, click-through rate), conversion (ecommerce conversion rate, cart abandonment rate, add-to-cart rate), revenue (average order value, ROAS, gross margin by channel), and retention (repeat purchase rate, customer lifetime value, purchase frequency). Tracking one category without the others creates blind spots that cost margin.
3. What is the 80-20 rule in ecommerce?
The 80-20 rule in ecommerce, based on the Pareto principle, holds that roughly 80% of revenue typically comes from 20% of customers or products. Ecommerce performance analytics identifies which customers, products, and channels fall in that top 20%, so marketing and inventory resources can be concentrated where they have the most impact.
4. What are the 4 types of commerce analytics?
The four types are descriptive (what happened), diagnostic (why it happened), predictive (what will happen), and prescriptive (what should be done). Most ecommerce brands operate at the descriptive level. Brands that reach prescriptive analytics, where AI recommends specific actions based on data patterns, gain the largest sustainable competitive advantage.
5. How is ecommerce performance analytics different from web analytics?
Web analytics tracks on-site behaviour: sessions, bounce rates, and page views. Ecommerce performance analytics connects that behaviour to revenue outcomes, ad spend, CRM data, and customer lifetime value. Web analytics tells you what happened on the site. Ecommerce performance analytics tells you what it was worth and what drove it.
6. Why do my ad platforms show different revenue numbers from Shopify?
Each ad platform uses its own attribution window and conversion logic. Google Ads may attribute a conversion to a click from 30 days ago. Meta may attribute the same conversion to a view-through from 7 days ago. Shopify records the actual transaction. An independent attribution tool reconciles all three into one reliable number by applying a consistent measurement standard across all platforms. For a deeper look at how this discrepancy happens and how to measure its impact, see the guide to marketing attribution models.
Triple Whale is a popular ecommerce analytics and attribution platform for Shopify and DTC brands. It helps teams track store performance, ad spend, attribution, and customer insights in one place. But its pricing isn’t a single flat monthly cost. Triple Whale pricing changes based on annual GMV, plan type, and the level of measurement a […]
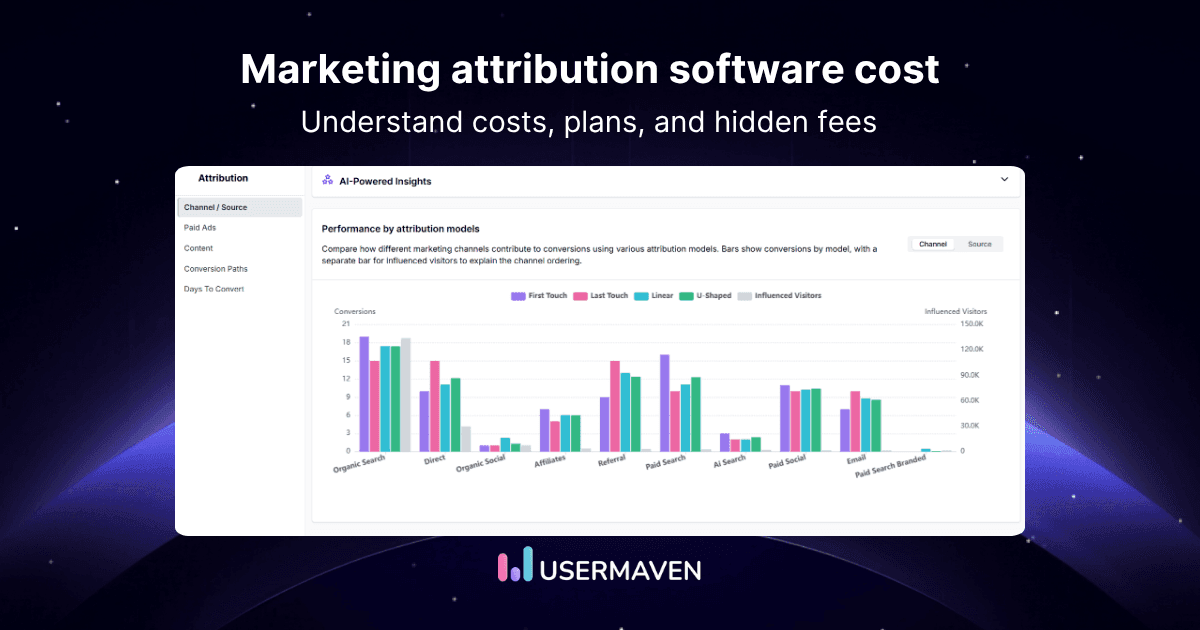
A growing marketing team requests pricing from three attribution vendors. One quotes a number through an interactive calculator that jumps as they adjust a slider. Two others say to contact sales with no figure attached at all. Three conversations later, the team still does not know whether attribution software costs $80 or $8,000 per month […]
Marketers like to think of the buyer’s journey as linear: someone finds your website through Google, signs up for your newsletter, and buys your product. Except, in real life, it looks more like this: a new subscriber opens your welcome email while commuting to work, gets distracted, and forgets about your offer. A few days […]