Sales teams in 2026 have more dashboards, more CRM data, and more reports than ever before. Most of them still cannot answer the question: which activities, channels, and behaviours are actually driving revenue?
The problem is not a lack of data. It is a lack of the right measurement system to turn that data into decisions.
Sales performance analytics is the discipline that closes this gap. It connects activity data, pipeline data, and revenue outcomes into one measurement system that tells sales leaders what is working, what is not, and where to focus next. For a foundation on the broader discipline, see the complete performance analytics guide first.
This guide covers the definition, the five core KPIs, how to build a dashboard that actually drives decisions, the most common mistakes that cost revenue, and how to connect marketing attribution to sales outcomes.
Key takeaways
Sales performance analytics is the practice of collecting, measuring, and analysing data across pipeline, activity, and revenue to identify what drives deals to close and what is blocking them
Most sales teams measure activity metrics like calls and demos, but miss the attribution layer that connects marketing channels to closed revenue
The five core sales KPIs every team needs to track are win rate, average deal size, sales cycle length, pipeline coverage ratio, and quota attainment
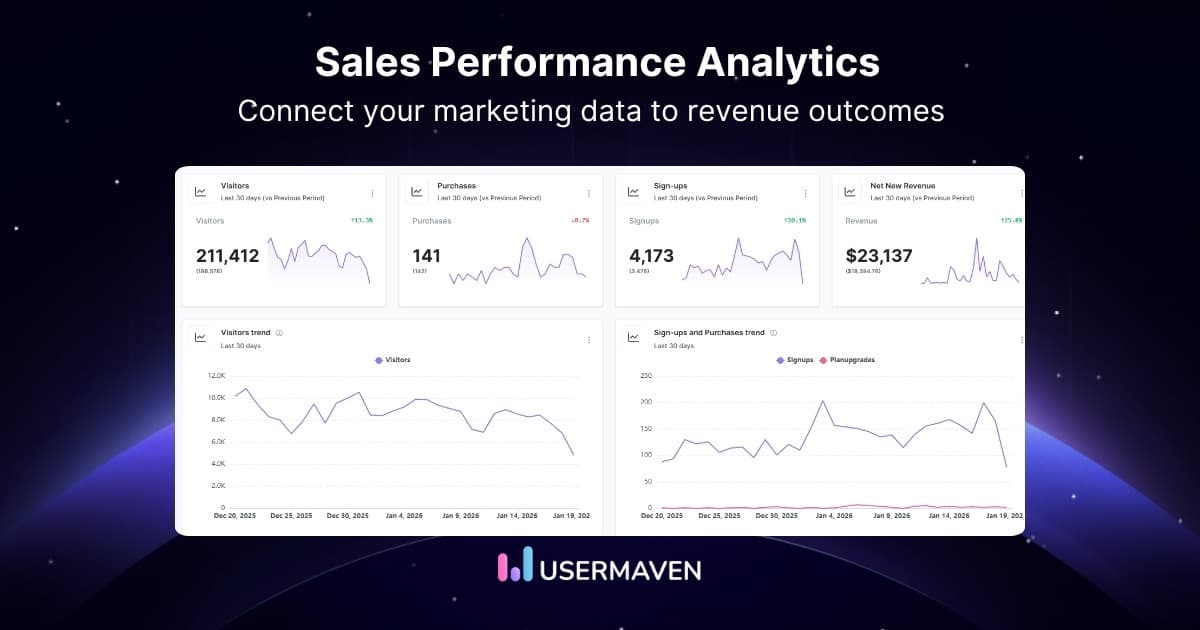
A well-built sales performance dashboard separates pipeline health from rep performance and connects both to revenue outcomes rather than tracking CRM activity in isolation
Usermavenconnects marketing attribution data to sales performance, showing which channels send the deals that actually close rather than just the deals that enter the pipeline
What is sales performance analytics?
Sales performance analytics is the systematic process of collecting, measuring, and analysing data across sales activity, pipeline health, and revenue outcomes to evaluate how well a sales team is performing against goals and to identify decisions that improve results.
It is the operational layer that answers the question every sales leader needs answered: which behaviours, channels, and processes are actually driving closed revenue, and which ones are consuming time without producing results?
Standard CRM reporting shows what happened. Sales performance analytics explains why it happened and what to do next. Activity metrics without outcome data is reporting. Outcome data connected to activity patterns is analytics.
Most sales performance systems are disconnected from the marketing layer. A deal enters the CRM as a lead, but the data rarely carries which channel originated it, which touchpoints influenced it, and why similar leads from different sources close at different rates. This is the attribution gap that marketing attribution data closes when connected to sales performance data.
Sales performance analytics is one of the four specialised applications of the broader performance analytics discipline, alongside marketing, ecommerce, and operational performance analytics.
What sales performance analytics is not
It is not activity tracking alone. Call counts, email opens, and demo completions measure effort, not effectiveness. A rep making 100 calls a week with a 5% connect rate is not outperforming a rep making 40 calls with a 30% connect rate. The numbers look different. The results confirm which one is actually performing.
It is not CRM data in isolation. CRM accuracy depends on rep discipline. When reps under-log or log inconsistently, any analytics built on that data is unreliable. Effective sales performance analytics requires automated data capture wherever possible, not manual entry that varies by rep.
It is not a one-time setup. Sales performance analytics requires ongoing review and recalibration as team composition, product mix, and market conditions change. See the guide to conversion tracking for how accurate event data at the top of the funnel feeds reliable performance data all the way to closed revenue.
Why sales performance analytics matters in 2026
The case for structured sales performance analytics has strengthened significantly in the past two years. Three structural pressures in 2026 make it a competitive requirement rather than a reporting upgrade.
Longer sales cycles and more decision-makers
B2B buying committees have grown. The average enterprise deal now involves six to ten stakeholders across multiple functions. Sales teams without analytics cannot identify which stakeholder engagement patterns correlate with closed deals versus stalled ones.
When every deal looks like progress in the CRM, the team cannot distinguish between opportunities moving forward and opportunities parked in a stage because nobody wants to mark them lost. Analytics separates the two before the end of the quarter.
Marketing and sales misalignment is costing pipeline quality
When marketing measures leads and sales measures closed revenue with no shared data layer, budget goes to channels that generate lead volume rather than channels that generate closeable deals.
Digital marketing metrics and KPIs frameworks built without sales outcome data systematically reward marketing channels that produce noise over channels that produce revenue. Sales performance analytics that connect to marketing attribution correct this misalignment at the source.
AI is raising the baseline for what good analytics looks like
Teams using AI-assisted analytics identify coaching opportunities, forecast risks, and replicate top rep behaviour faster than teams relying on manual CRM review. The gap between data-native and data-passive sales teams is widening every quarter in 2026.
Revenue analytics that connect acquisition spend to closed revenue by channel are where the most significant sales performance gains are being found by teams that have made the investment.
According to Gartner research for sales leaders, traditional analytics do not deliver the actionable insight needed to improve seller productivity, and driving real gains in revenue, quota attainment, and performance requires focusing on the leading indicators that matter most. The gap between top and bottom quartile performers is increasingly explained by analytics maturity rather than headcount or territory advantage.
Research from McKinsey on B2B sales performance shows that B2B companies using data and analytics systematically in their sales process achieve revenue growth rates five times higher than peers who do not. In 2026, this is not a differentiator. It is the cost of competing.
Key sales performance metrics to track
The right set of sales performance metrics depends on the team structure, sales motion, and the questions leadership needs to answer. The most effective approach organises metrics into three categories: pipeline and revenue, activity and behaviour, and funnel conversion.
Pipeline and revenue metrics
Win rate: Percentage of opportunities that close as won. The single most important indicator of sales process effectiveness. Segment by lead source, rep, deal size, and product line to move from a lagging metric to a diagnostic one.
Average deal size: Average revenue per closed deal. Declining average deal size with flat revenue means volume is compensating for value. This is unsustainable at scale and typically signals pricing pressure or a shift in the lead quality mix.
Sales cycle length: Average days from first contact to closed deal. Segment by lead source and deal size. Deals from certain channels that close faster at similar values represent disproportionate pipeline efficiency that warrants more investment.
Pipeline coverage ratio: Total pipeline value relative to revenue target. Healthy coverage sits at 3x to 4x targets. Below 2x signals a pipeline generation problem. Above 5x typically signals a qualification problem where too many weak opportunities are being carried forward.
Quota attainment rate: Percentage of reps hitting quota in a given period. Low attainment across the team signals a systemic problem with process, product, or market fit. Low attainment concentrated in specific reps or segments signals a coaching or territory problem.
Activity and behaviour metrics
Call and meeting connect rates: Connects per dials and meetings booked per outreach attempts. These separate effort from effectiveness at the top of the funnel and are the leading indicators most closely tied to pipeline generation.
Demo to proposal conversion rate: The percentage of demos that advance to a formal proposal. Low rates here indicate qualification problems or product-market fit issues in specific customer segments worth investigating before scaling outreach.
Proposal to close rate: The final conversion stage before revenue. Low rates here signal pricing, competitive positioning, or stakeholder alignment problems that coaching and enablement can address if identified early enough.
Response time to inbound leads: Speed to first contact with inbound leads correlates directly with close rate in most B2B categories. This metric is frequently absent from standard CRM dashboards despite being one of the most actionable levers available to sales operations.
Sales funnel performance analytics
Sales funnel performance analytics tracks conversion rates at every stage from lead to closed deal. It reveals exactly where deals are stalling and at what rate, rather than just showing the output at the bottom of the funnel.
Stage-by-stage conversion rates identify bottlenecks that quota attainment numbers hide. A team hitting 85% of quota with a broken mid-funnel is one pipeline problem away from a missed quarter, and the warning signs are visible weeks earlier in funnel conversion data.
Funnel velocity tracks the rate at which deals move through the pipeline. Slower velocity in specific stages or deal types signals where process intervention or sales enablement is needed before deals stall or go cold.
For a unified view of how marketing and sales funnel data connect across channels, see the guide to cross-platform ad tracking and how it feeds accurate lead source data into the sales funnel from the point of first touch.
See what's working. Fix what's not. Grow faster.
*No credit card required
How to use analytics to improve sales performance
Understanding how to use analytics to improve sales performance starts with recognising that most sales data already exists. The problem is not the collection. It is the absence of a structured process for turning that data into decisions.
Step 1: Align metrics to sales stage
Each stage of the funnel needs its own leading indicators. Using only lagging metrics like closed revenue to manage a sales team is the equivalent of driving by looking in the rearview mirror. The outcome is already set before you can act on it.
Map one to two metrics to each stage: lead to opportunity (connect rate, qualification rate), opportunity to proposal (demo conversion, stakeholder engagement), proposal to close (win rate, time in stage, competitive win rate).
Step 2: Connect CRM data to marketing attribution
Understanding how CRM analytics improve sales performance depends entirely on whether the CRM data connects back to the marketing channels that generated each opportunity. Without this connection, CRM analytics tells you how deals progressed but not why they were in the pipeline in the first place.
The guide to ad tracking explains how connecting marketing campaign data to revenue outcomes eliminates the attribution gap that costs both teams visibility into which channels are actually driving pipeline.
Step 3: Identify top rep patterns, not just outcomes
Top performers share behaviours that can be identified and replicated. Sales performance analytics surfaces what those behaviours are by connecting activity data to outcome data at the individual rep level. Win rate by rep by lead source is more actionable than win rate by team.
Step 4: Build a weekly cadence around leading indicators
Win rate and quota attainment are quarterly outputs. Call connect rate, demo conversion rate, and pipeline velocity are weekly inputs that predict quarterly outputs. Managing the inputs changes the outputs. Reviewing the outputs alone changes nothing.
Step 5: Use cohort analysis for channel quality
Not all leads are equal. Cohort analysis by lead source reveals which marketing channels produce leads that close fastest, close at the highest value, and retain longest after the initial sale.
This is where sales performance analytics and marketing attribution models create the most combined value. The channel that produces the most leads is rarely the same as the channel that produces the most revenue.
Sales performance dashboard: What good looks like
A sales performance dashboard is only as useful as the decisions it enables. Most CRM dashboards show everything. The best sales dashboards show the exceptions and leading indicators that require action before they become missed targets.
What a sales performance dashboard must answer
Four operational questions should drive every dashboard design. Is the pipeline healthy enough to hit the revenue target? Are individual reps performing consistently, or are a few carrying the team? Where are deals stalling, and how long have they been stalled? Which marketing channels are producing closeable pipeline versus lead volume that never converts?
Four views every sales dashboard needs
Pipeline health view covers coverage ratio, stage distribution, deal velocity, and time-in-stage flags for opportunities that have stalled. Rep performance view shows quota attainment, win rate, and key activity metrics broken down by individual.
Funnel conversion view tracks stage-by-stage conversion rates and identifies exactly where the team is losing deals at each transition. Revenue attribution view connects closed revenue to originating marketing channels, which is a view that most CRM dashboards do not include by default.
What separates a good dashboard from a bad one
A bad sales dashboard shows every field in the CRM organised by date. A good one surfaces the two or three numbers that tell a sales leader whether the quarter is on track and which specific action is needed before the next review.
The marketing attribution layer that most sales dashboards are missing
Most CRM dashboards show pipeline by stage and rep, but not pipeline by originating marketing channel. Adding this layer reveals which channels produce deals that close versus deals that clog the pipeline without converting.
The ad platform discrepancies guide explains why platform-reported lead attribution is unreliable as a source for this layer and why independent tracking produces a more accurate view of which channels are actually generating closeable pipelines.
Common sales analytics mistakes that cost revenue
Most sales analytics problems are not tool problems. They are process and set-up problems that produce data which looks credible but is not actionable.
1. Measuring activity without connecting to outcomes
Call volume and email sends are effort metrics. Without connecting them to pipeline generated and revenue closed, they measure busyness rather than effectiveness. A rep with 200 calls and zero new opportunities is not performing. The activity number hides the outcome number.
2. Relying on self-reported CRM data
CRM accuracy depends on rep discipline. When reps under-log or log inconsistently, the analytics built on that data are unreliable from the start. Automated data capture and CRM hygiene processes are not optional components of a sales analytics system. They are the foundation.
3. Ignoring the lead source in the pipeline analysis
A pipeline review that does not segment by lead source cannot identify which marketing channels are generating closeable deals. This is the most expensive blind spot in most sales analytics setups, and the one that data-driven attribution directly addresses by assigning credit based on actual contribution to closed revenue rather than last click attribution.
4. Reviewing only at the end of the period
Quarterly reviews of sales performance are post-mortems. They explain what happened after the result is already set. Weekly reviews of leading indicators are management tools. They create the opportunity to change the outcome before it is locked in.
5. Not segmenting by rep tenure and territory
Blended team metrics hide whether performance problems are systemic or concentrated. A team average quota attainment of 80% looks acceptable until segmentation reveals that two reps at 120% are masking six reps at 60%. The action required for each scenario is completely different.
Consistent UTM parameters across every marketing channel are the upstream requirement for clean lead source data in the CRM. Without UTM discipline at the marketing layer, sales analytics cannot segment pipeline by originating channel accurately.
How Usermaven delivers performance analytics for sales teams
Usermaven is an AI-powered marketing attribution platform that connects ad platforms, CRM, and website data to track the full customer journey in real time using first-party and server-side tracking.
For sales teams specifically, Usermaven solves the core visibility problem that makes most sales analytics incomplete: the disconnection between the marketing touchpoints that generated each lead and the sales outcome that closed or lost that deal. This is performance analytics for sales that goes beyond what the CRM can show on its own.
Which channels send deals that close
Most CRM dashboards show pipeline volume by source. Usermaven shows which sources produce deals that close at the highest win rate, shortest sales cycle, and highest average deal size.
Maven AI identifies these patterns automatically and surfaces them in plain language without SQL or analyst dependency. Which campaign drove the highest-value closed deals last quarter? Which lead source has the shortest average sales cycle? The answers change where the marketing budget goes and which leads sales teams to prioritize.
Independent attribution above CRM and platform reporting
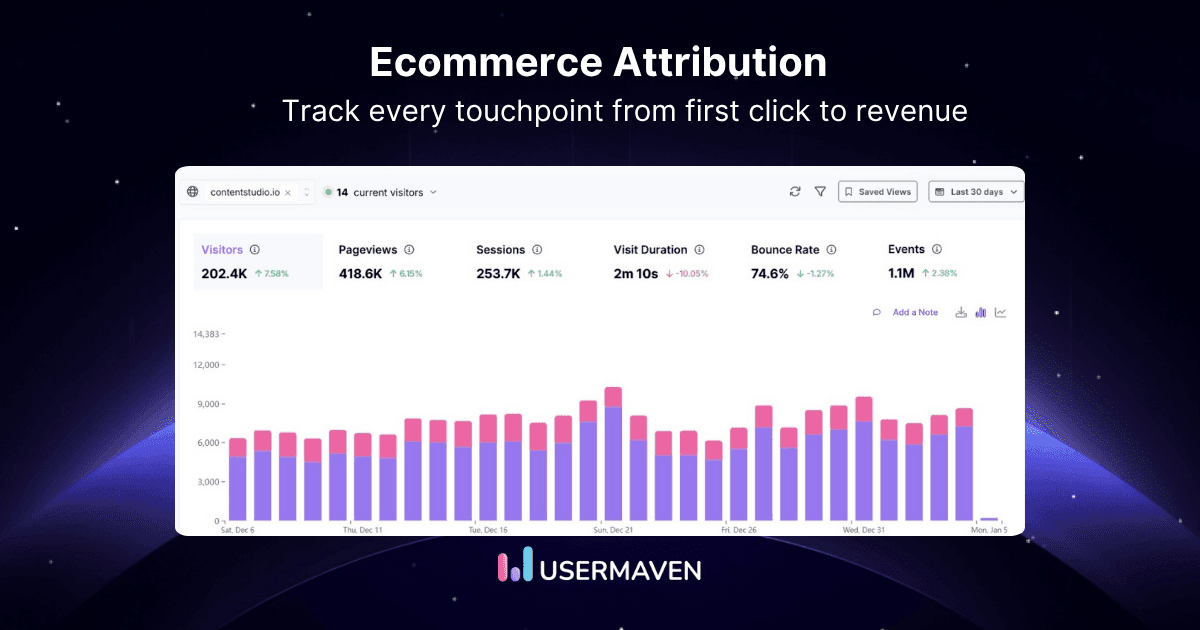
Usermaven’s revenue attribution software captures every touchpoint from the first anonymous visit using a first-party pixel that bypasses most ad blockers, then connects those touchpoints to revenue outcomes using seven attribution models.
Sales teams get a complete view of what drove each deal into the pipeline, independent of what any platform reports.
This fills the attribution gap that CRM data alone structurally cannot close. See how first-party data collection at the marketing layer feeds accurate lead source information into the sales funnel from the very first touchpoint.
Sales performance analytics software built for the full funnel
Sales performance analytics software built only on CRM data shows what happened inside the sales process. Usermaven extends that view upstream to the marketing channels that created the opportunity in the first place, giving sales leaders a complete picture of what is driving the pipeline they are being asked to close.
From the first anonymous visit to closed revenue, Usermaven provides the unified measurement layer that connects marketing performance to sales outcomes. See the guide to server-side tracking for how Usermaven captures conversions that platform pixels miss, ensuring the lead source data entering the CRM is as complete as possible.
Turn visitors into paying customers with funnel analysis
*No credit card required
Conclusion
Sales performance analytics is not a CRM feature. It is the measurement system that connects activity, pipeline, and revenue into a single view, telling sales leaders where to focus, what to change, and which deals to prioritise before the quarter is decided.
The five core KPIs, the dashboard structure, and the six-step improvement process in this guide are the foundation. But the foundation only works when the data feeding it is accurate, complete, and connected to the marketing layer that generated the pipeline in the first place.
Usermaven’s guided analytics setup gets your ad platforms, CRM, and website data connected and measuring the right things in minutes, no developer needed.
Start your free trial with no credit card required. Or book a demo to see exactly how Usermaven connects your marketing attribution data to your sales performance outcomes.
FAQs
1. What is sales performance analytics?
Sales performance analytics is the systematic practice of collecting, measuring, and analysing data across sales activity, pipeline health, and revenue outcomes to evaluate how a sales team is performing against its goals and identify decisions that improve results. It connects activity patterns to outcome data to answer not just what happened but why and what to do differently.
2. What are the 5 key performance indicators in sales?
The five core sales KPIs are win rate (percentage of opportunities that close as won), average deal size (average revenue per closed deal), sales cycle length (average days from first contact to closed deal), pipeline coverage ratio (total pipeline value relative to revenue target), and quota attainment rate (percentage of reps hitting quota in a given period). Each KPI becomes more useful when segmented by lead source, rep, and deal type rather than tracked as a single blended number across the whole team.
3. What is the 3-3-3 rule in sales?
The 3-3-3 rule is a prospecting framework that prescribes at least 3 calls, 3 emails, and 3 social touches across 3 weeks before marking a prospect as unresponsive. It is a minimum outreach sequence designed to ensure consistent follow-through before abandoning a lead. Sales performance analytics tracks whether this cadence is being applied across the team and whether prospects contacted at this frequency convert at a higher rate than those contacted less consistently. The data validates or challenges the framework based on actual outcomes rather than assumptions.
4. What is the 2-2-2 rule in sales?
The 2 2 2 rule is a follow-up framework: follow up 2 days after a meeting, 2 weeks after that, and 2 months after that for longer-cycle deals. It is designed to keep deals alive without overwhelming prospects during extended consideration periods. Analytics tracks which follow-up timing patterns correlate with closed deals in the actual pipeline data. If the 2-2-2 cadence is underperforming, a different timing pattern in your specific sales motion, the data will show it. Frameworks are starting points. Performance data is the authority.
5. How does CRM analytics improve sales performance?
CRM analytics improves sales performance by surfacing patterns in activity, pipeline progression, and outcome data that manual review misses. Stage conversion rates, time-in-stage flags, and rep-level win rate analysis are all available within CRM data when structured and reviewed consistently. But CRM analytics is limited to what happens after a lead enters the system. Connecting it to marketing attribution data is what produces the full picture: which channels generate leads that close, at what value, and how fast. That connection is what transforms CRM analytics from a reporting tool into a performance management system.
6. What is sales performance analytics software?
Sales performance analytics software is a category of tools that collect, measure, and visualise sales data to help teams track progress against revenue goals, identify pipeline risks, and make faster decisions. The category spans CRM-native analytics, dedicated sales intelligence platforms, and marketing attribution tools that connect the pre-CRM customer journey to sales outcomes. The most complete sales performance analytics software setups combine CRM pipeline data with independent marketing attribution to answer both how deals progressed and what drove them to the pipeline in the first place. For a full comparison of tools across use cases, see the guide to performance analytics tools.
Ruler Analytics pricing is based on monthly website traffic and the level of measurement a business needs. Current plans start at $400 per month for up to 10,000 visits and rise to $2,000 per month for more than 100,000 visits. The final cost can also depend on product, data, and integration requirements. Features such as […]
A shopper may discover a product through a Meta ad, return through Google Search, open an email, and complete the order by visiting the store directly. Every platform may claim credit for the same sale. Without reliable ecommerce attribution, teams cannot tell which interaction created demand, which one assisted the decision, and which one simply […]
An agency onboards a new ecommerce client and realizes the attribution tool built for their B2B SaaS clients does not handle Shopify data at all. Two months later, a different client asks for white-labeled reports, and the same platform cannot produce them either. Most attribution tools help marketers see performance. Agencies need tools that help […]