Understanding how your business generates revenue isn’t just a reporting task; it’s a strategic advantage. Revenue analytics goes beyond basic financial tracking by connecting product usage, customer behavior, and marketing performance directly to your income streams. For SaaS companies, it offers a clear view of what drives recurring revenue, where churn risks exist, and how to optimize every stage of the customer journey.
In this guide, you’ll learn what revenue analytics is, why it matters for SaaS, which metrics you should prioritize, and how to implement an analytics system that’s both privacy-friendly and easy to use. We’ll also explore how Usermaven helps you turn fragmented data into actionable insights, without relying on engineers or dealing with complex setups like GA4 or Mixpanel.
Power up your SaaS with perfect product analytics
*No credit card required
What is revenue analytics, and why does it matter?
Revenue analytics refers to the process of collecting, analyzing, and interpreting data related to a company’s income streams. For SaaS businesses in particular, it provides a detailed view of how revenue is generated, what drives or hinders growth, and where future opportunities lie.
Unlike basic financial reporting, revenue analytics goes deeper; it connects user behavior, marketing touchpoints, and product interactions with actual revenue outcomes. This allows companies to know not just what happened but also why it happened and how to improve it.
In today’s data-saturated environment, businesses that rely solely on spreadsheets or surface-level metrics often miss critical insights. With accurate revenue analytics in place, SaaS companies can:
Identify their most profitable customer segments.
Pinpoint which acquisition channels yield the highest lifetime value.
Detect early signs of churn and mitigate it with timely interventions.
Forecast revenue more reliably using historical and behavioral trends.
Usermaven brings revenue data together from across your customer journey, connecting product usage, marketing touchpoints, customer behavior, and revenue outcomes without complex configurations. It helps you move from guesswork to clarity, making revenue growth more predictable and scalable.
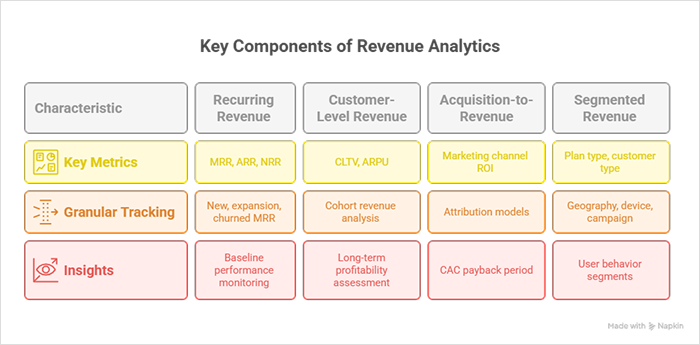
Key components of revenue analytics
Effective revenue analytics is built on a foundation of essential components that help you understand not just how much you’re earning, but where it’s coming from, what’s influencing it, and how it evolves over time. For SaaS businesses, these components go far beyond traditional financial metrics.
1. Recurring revenue metrics
Recurring revenue is the lifeblood of most SaaS companies. Key metrics include:
Monthly recurring revenue (MRR) and annual recurring revenue (ARR) to monitor baseline performance.
Net revenue retention (NRR) is used to measure expansion, churn, and contraction.
New MRR, expansion MRR, and churned MRR for granular tracking. If you serve customers across multiple states or countries where SaaS is taxable, connecting those tax calculations into your analytics stack gives you a much more accurate picture of profitable growth.
2. Customer-level revenue insights
Understanding how much each customer contributes over time is critical. This includes:
Track the CAC payback period to see how long it takes to recover acquisition costs.
4. Segmented revenue views
Not all revenue is created equal. Segmentation allows deeper insights:
By plan type (free, starter, pro, enterprise).
By customer type (e.g., startups vs. agencies).
By geography, device, or campaign source.
By user behavior segments, such as power users vs. dormant users.
Usermaven makes it easy to view and filter revenue through any of these lenses, helping teams make strategic decisions based on real-time insights.
Power up your SaaS with perfect product analytics
*No credit card required
Benefits of revenue analytics for SaaS companies
Revenue analytics empowers SaaS companies to move beyond surface-level metrics and focus on what truly drives growth. By connecting marketing performance, product usage, and customer behavior directly to revenue, teams can make faster, data-driven decisions that improve acquisition, retention, and expansion.
Smarter pricing and packaging decisions: Identify underperforming plans, understand which features lead to upgrades, and optimize pricing based on real revenue contribution by segment.
Visibility into growth vs. retention drivers: Distinguish between revenue from new and existing customers to better balance acquisition and expansion efforts, reduce churn, and drive sustainable growth.
Clear identification of high-value segments: Use revenue-linked segmentation to pinpoint your most profitable customer cohorts and tailor offers, onboarding, or campaigns for maximum impact.
Better timing for upsells and renewals: Spot usage patterns that indicate upgrade or renewal readiness, allowing you to automate timely outreach and proactively prevent churn.
Strategic decision-making across departments: Share revenue insights with marketing, product, and finance teams to align efforts, improve campaign ROI, product development, and forecasting accuracy.
Usermaven makes all of this seamless through a no-code, privacy-compliant platform that unifies revenue data and delivers actionable insights without technical overhead.
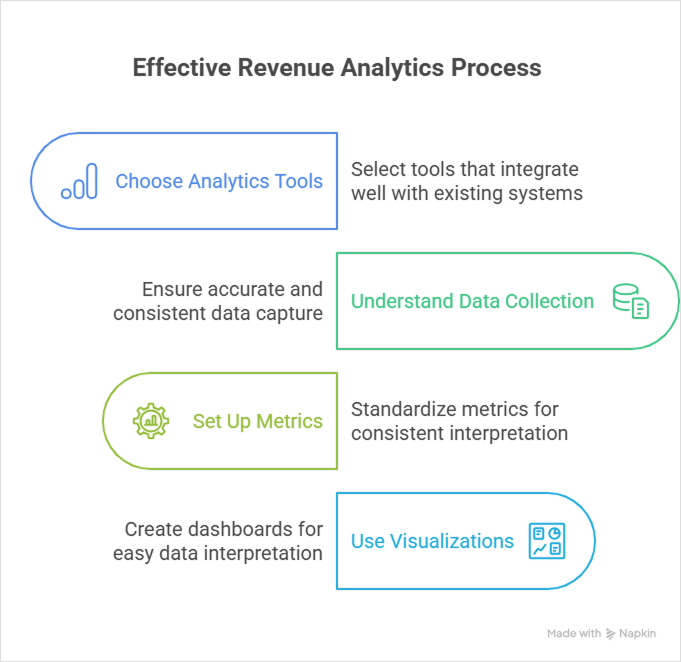
How to track and analyze revenue effectively
Tracking revenue accurately is essential for understanding where your business is growing, where it’s leaking value, and how customer behavior influences financial outcomes. But simply having access to revenue numbers isn’t enough; you need to know how those numbers were generated, what’s driving them, and what actions to take next.
For SaaS companies, effective revenue analytics bridges product, marketing, and finance data to create a unified view of performance. This requires the right tools, accurate data collection methods, standardized metrics, and insightful visualization.
1. Choose the right analytics tools
The foundation of effective revenue analysis starts with the tools you use. Without the right platform, data becomes fragmented, inconsistent, or overly complex to act on. As revenue attribution software, Usermaven helps teams connect transactions, user behavior, marketing activities, product features, and revenue outcomes in one place.
For SaaS teams, this means choosing a tool that is built for subscription models, supports easy integrations, and enables deep segmentation and attribution.
Look for product analytics platforms like Usermaven that combine behavioral tracking with revenue reporting.
Prioritize tools that integrate seamlessly with billing platforms (e.g., Stripe), CRMs, and ad platforms.
Ensure your analytics solution is privacy-friendly, supports cookie-less tracking, and doesn’t require engineering resources to implement.
2. Understand how revenue data is collected
To make confident decisions based on analytics, you must first understand where your revenue data comes from and how it’s being captured. Inaccurate or incomplete data collection can lead to misleading insights and poor strategic decisions.
SaaS companies typically collect revenue data through transactions, subscriptions, and user events, but unless these are consistently tracked, your reports can easily fall out of sync.
Revenue data is typically derived from payments, invoices, and subscription activity (e.g., plan upgrades, downgrades).
Behavioral events like onboarding completion, feature activation, or cancellation requests provide essential context.
Establish clear tracking conventions (event names, properties, etc.) to maintain consistency across teams and tools.
3. Set up clear and consistent metrics
Revenue analytics only delivers value when your metrics are standardized, actionable, and aligned with your business model. Without a shared understanding of what each metric means, teams can interpret the same data in conflicting ways.
Defining clear, consistent revenue metrics ensures alignment across departments and enables reliable benchmarking over time.
Define key metrics such as MRR, ARR, churn rate, LTV, ARPU, and CAC payback period.
Standardize how these metrics are calculated and ensure all teams refer to the same definitions.
Use these metrics to establish baselines and track progress toward specific revenue goals.
4. Use dashboards and visualizations for analysis
Revenue data can be complex, especially when broken down by segment, channel, or cohort. Dashboards help translate raw data into visual insights that are easier to interpret and act on. This is especially important for cross-functional teams who may not have time to dig into spreadsheets or raw reports.
Create real-time dashboards that highlight the most critical revenue KPIs.
Use trend charts to track growth over time and detect sudden spikes or drops.
Leverage cohort analysis to compare the behavior and revenue contributions of users acquired during different time periods or campaigns.
With Usermaven, these visualizations are pre-built, fully customizable, and accessible to marketers, founders, and product teams, no SQL or code required.
Revenue analytics metrics every SaaS company should track
Tracking the right metrics is the backbone of meaningful revenue analytics. While vanity metrics can create a false sense of progress, real growth comes from consistently monitoring KPIs that reflect both profitability and long-term sustainability.
For SaaS businesses, this means looking beyond top-line revenue and focusing on how revenue behaves over time, how it’s acquired, how long it lasts, and where it expands or contracts. These metrics allow teams to benchmark performance, identify red flags, and make precise, data-backed decisions.
Below are the essential revenue metrics every SaaS company should prioritize:
Monthly recurring revenue (MRR): MRR represents the total predictable revenue generated from active subscriptions each month. It reflects your business’s current performance and is essential for tracking monthly growth or decline trends.
Annual recurring revenue (ARR): ARR is the annualized version of MRR, often used for long-term revenue forecasting and high-level financial planning. It helps investors and stakeholders understand your business’s valuation trajectory.
Customer lifetime value (CLTV): CLTV estimates the total revenue a customer will generate over their entire relationship with your company. It combines ARPU and customer lifespan to help assess profitability and guide resource allocation.
Customer acquisition cost (CAC): CAC is the total cost associated with acquiring a new customer, including marketing and sales expenses. It’s essential for measuring acquisition efficiency and comparing against CLTV to ensure sustainable growth.
CAC payback period: This measures how long it takes to recover the cost of acquiring a customer. A shorter payback period indicates healthier cash flow and faster returns on marketing investments.
Net revenue retention (NRR): NRR reflects the percentage of revenue retained from existing customers, including upgrades and downgrades, minus churn. NRR above 100% shows that customer accounts are expanding and generating more value over time.
Churn rate (customer and revenue churn): Churn measures the percentage of customers or revenue lost in a given time period. High churn is a red flag for issues in product experience, customer support, or engagement strategy.
Expansion MRR: This tracks revenue gained from existing customers upgrading to higher-tier plans, adding seats, or purchasing add-ons. A healthy expansion MRR indicates strong product-market fit and upsell opportunities.
Contraction MRR: Contraction MRR captures the revenue lost when customers downgrade their plans or reduce usage. Monitoring this helps identify product or pricing issues that may impact retention.
Average revenue per user (ARPU): ARPU calculates the average monthly revenue earned per user. It’s useful for evaluating pricing effectiveness and understanding customer value across segments.
Cohort revenue analysis: Cohort analysis groups customers by acquisition date or campaign to track how their revenue contribution changes over time. It reveals retention patterns and long-term value trends by segment.
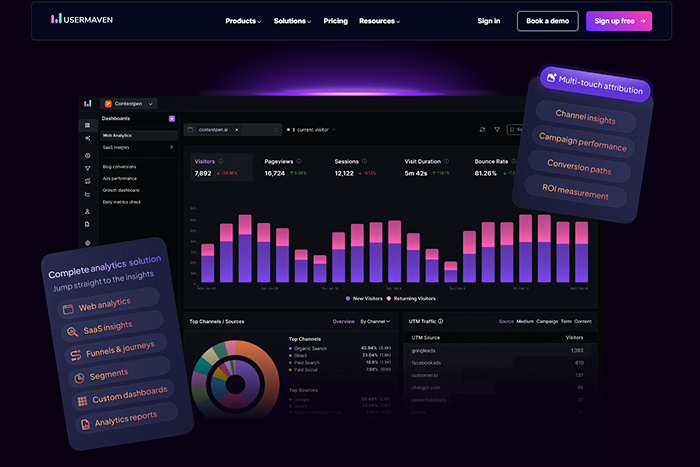
Usermaven makes revenue analytics simple, privacy-friendly, and truly actionable for SaaS teams. Instead of piecing together fragmented reports or relying on engineers to build dashboards, Usermaven brings everything you need into one intuitive platform.
It connects product usage, customer behavior, and marketing attribution with actual revenue, giving you insights you can trust, act on, and grow from.
Here’s how Usermaven empowers SaaS companies to take full control of their revenue data:
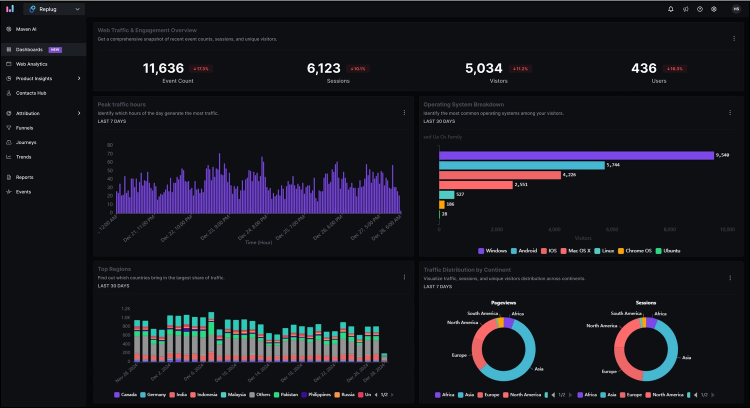
Real-time revenue dashboards
Monitoring your revenue should be fast, easy, and always up to date. Usermaven’s pre-built revenue dashboards give you an instant overview of all key financial metrics, without the need for manual setup or reporting delays.
Visualize core metrics like MRR, ARR, NRR, churn rate, and expansion revenue.
See changes as they happen with real-time data syncs.
Filter data by plan type, acquisition channel, or customer cohort.
Keep everyone aligned with a shared view of revenue performance.
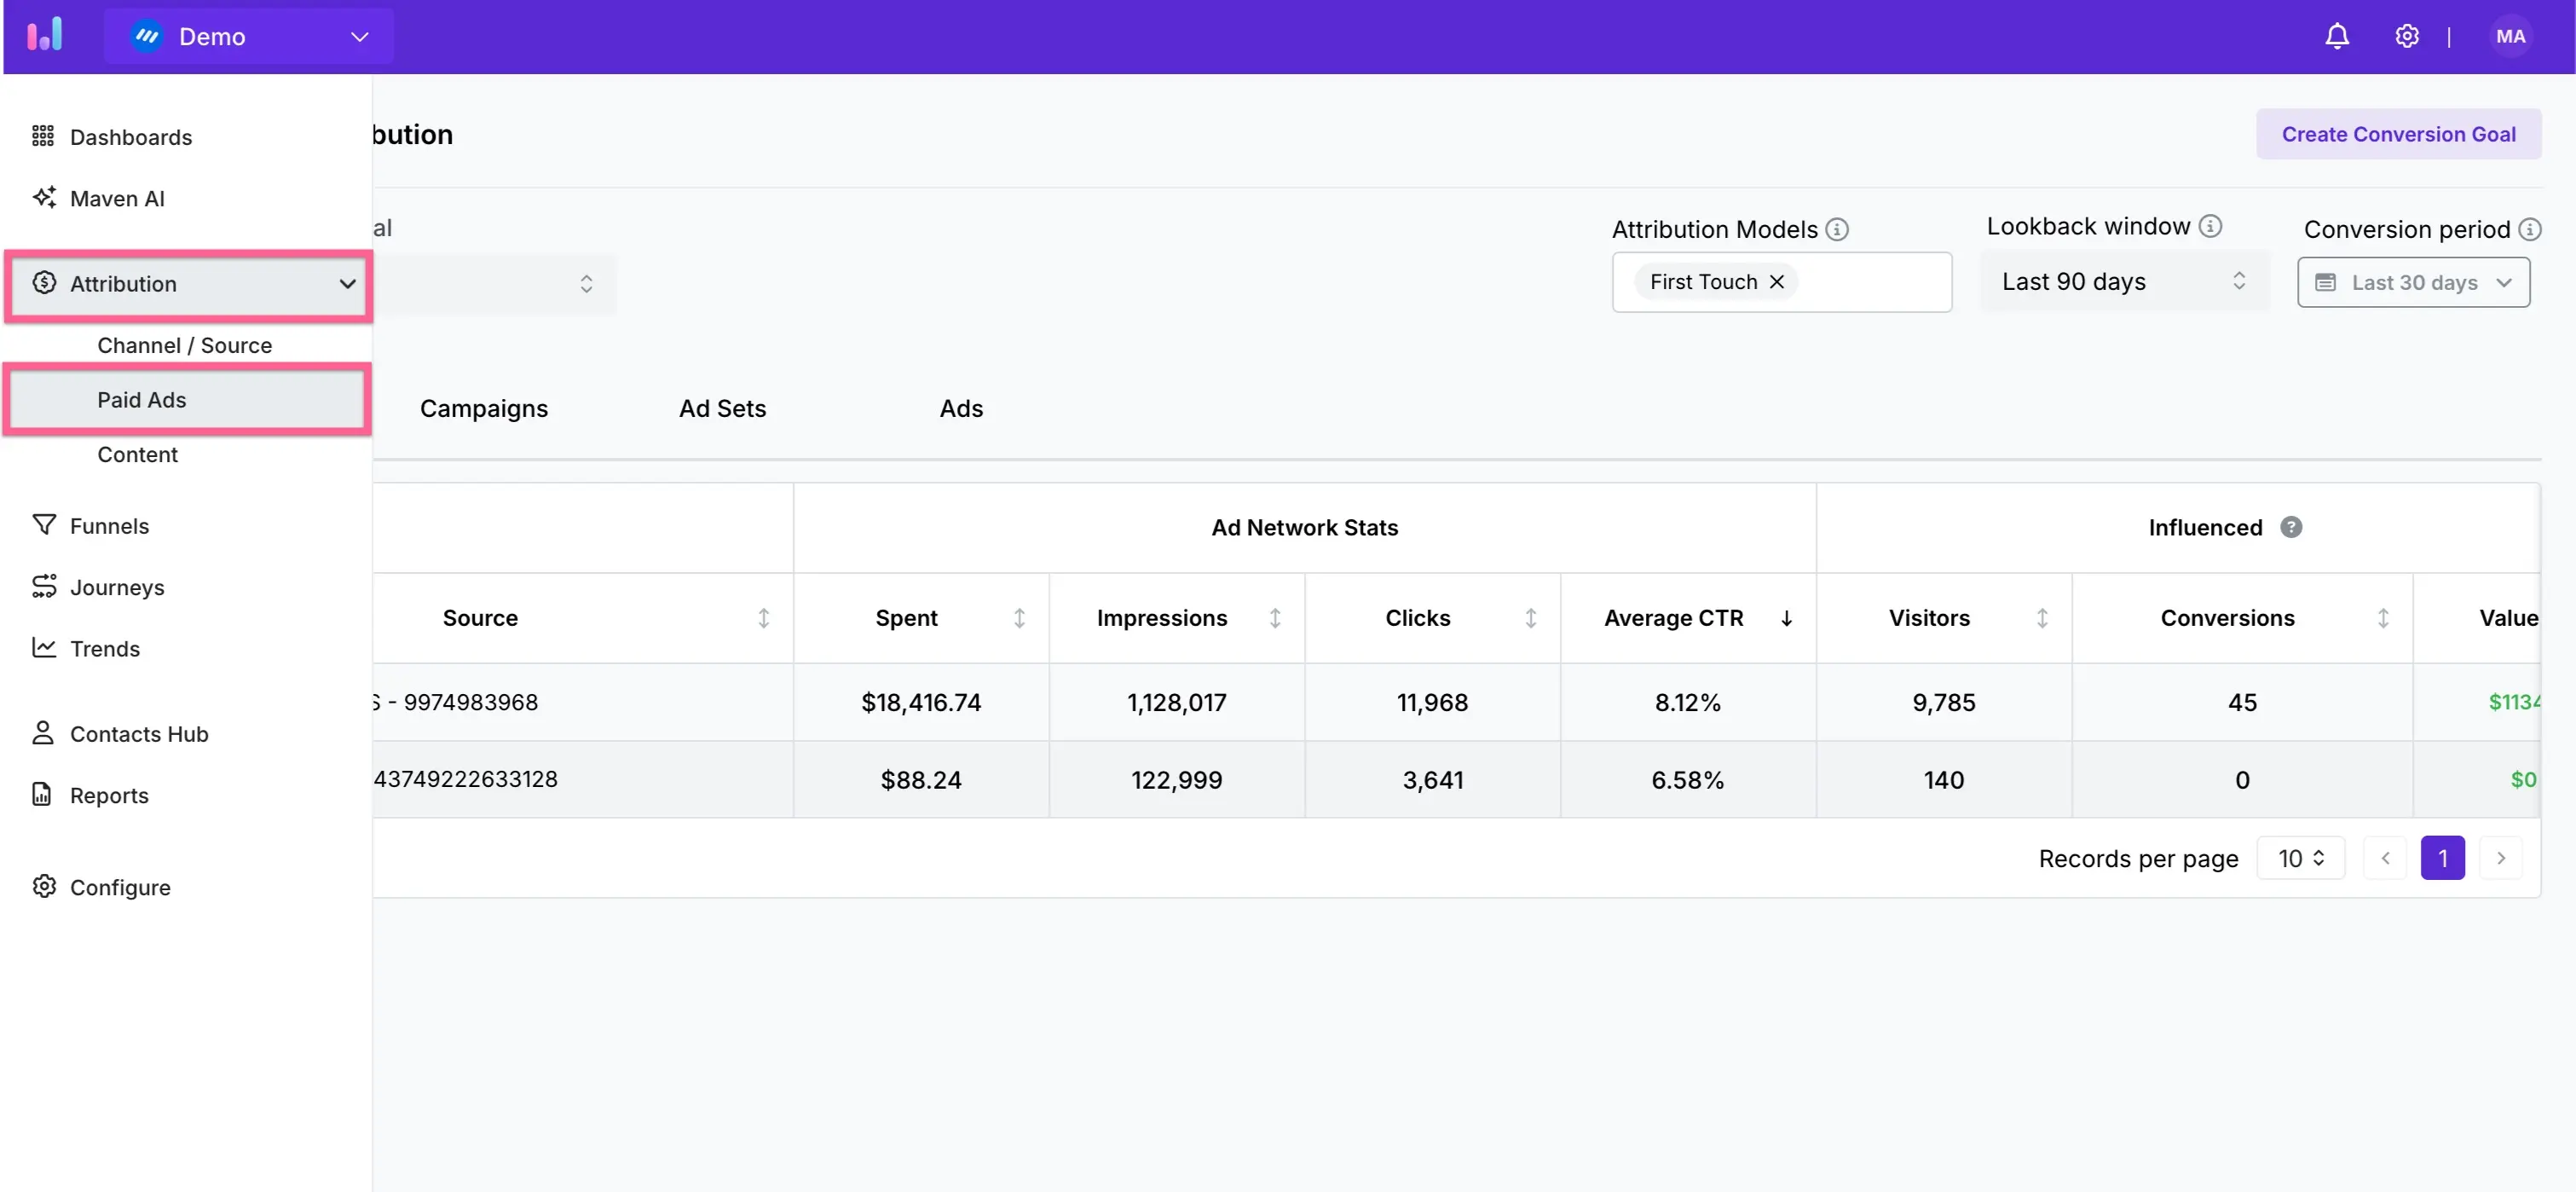
Attribution-based revenue insights
Knowing where your revenue is coming from is essential for scaling efficiently. Usermaven connects marketing attribution with revenue outcomes so you can invest in what drives real growth.
Analyze revenue by first-touch, last-touch, or multi-touch attribution models.
See which campaigns, traffic sources, and landing pages deliver the highest-value customers.
Track ROI on paid channels like Google Ads, Facebook, and LinkedIn.
Attribute not just conversions, but actual revenue to marketing efforts.
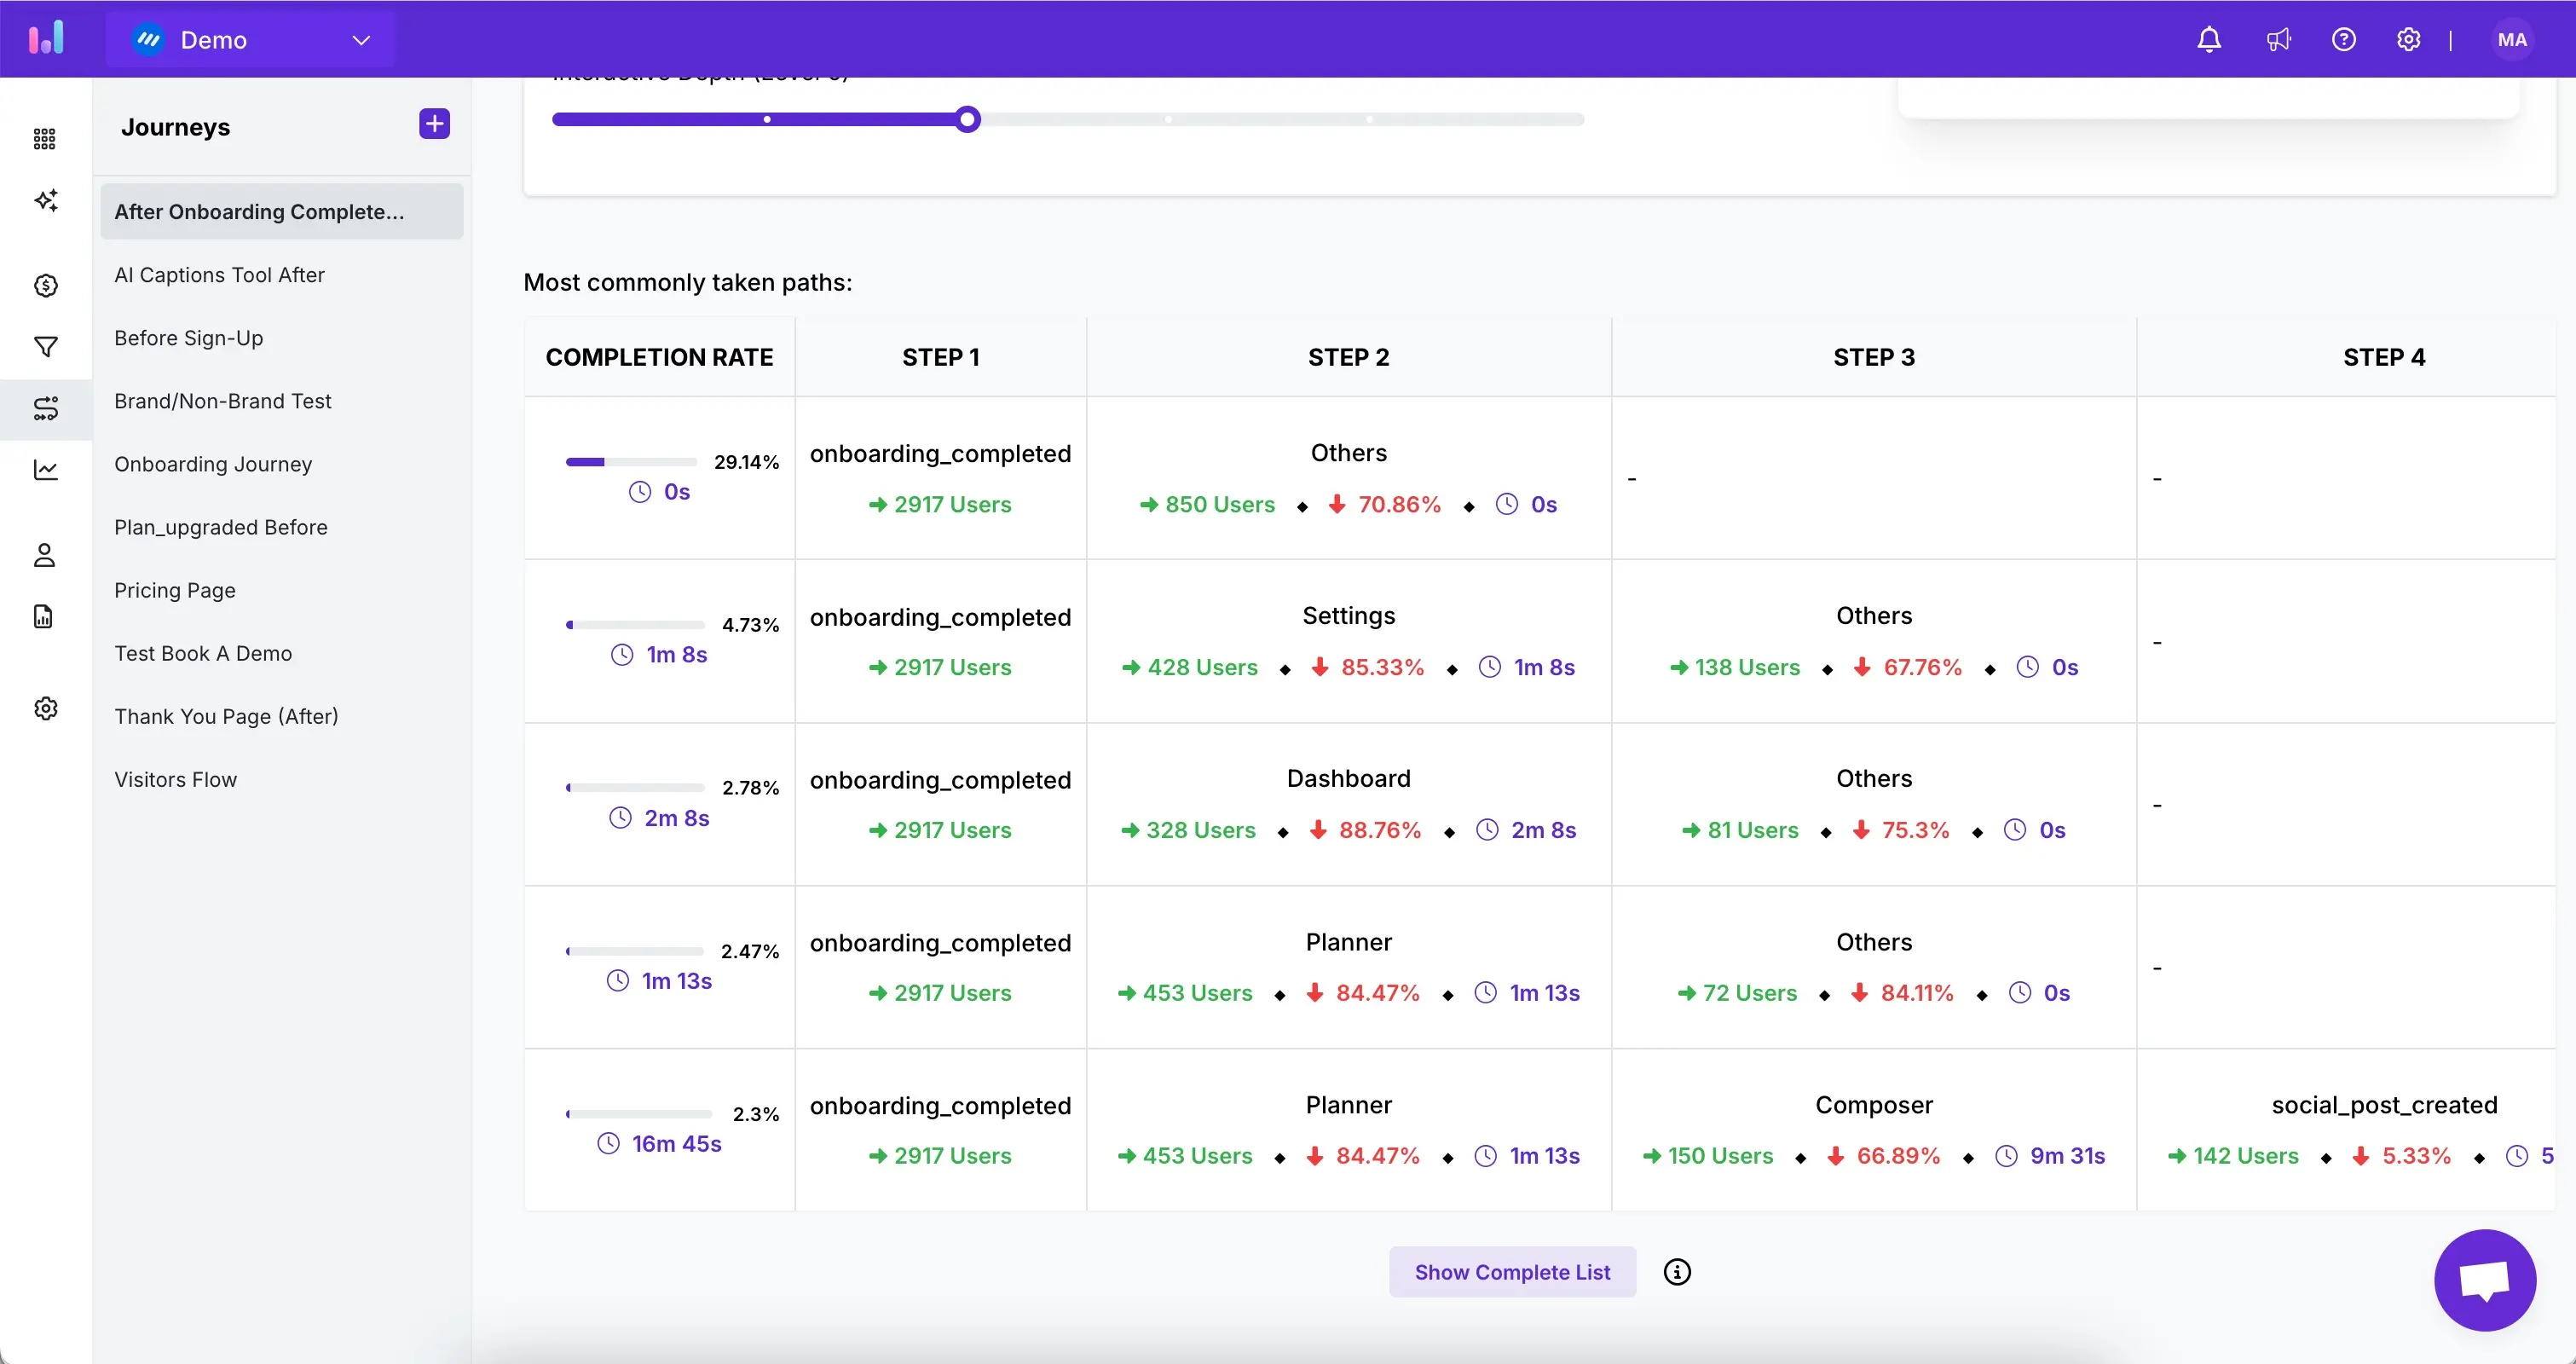
User-level revenue journeys
Beyond totals and segments, Usermaven shows you how each customer contributes to revenue over time. This user-level visibility helps you understand what behaviors lead to upgrades, retention, or churn.
Track individual customer journeys from acquisition to activation, upgrade, renewal, or drop-off.
Visualize how in-product actions relate to revenue events.
Identify power users and at-risk customers based on behavior trends.
Enable customer success teams to act on high-value insights in real time.
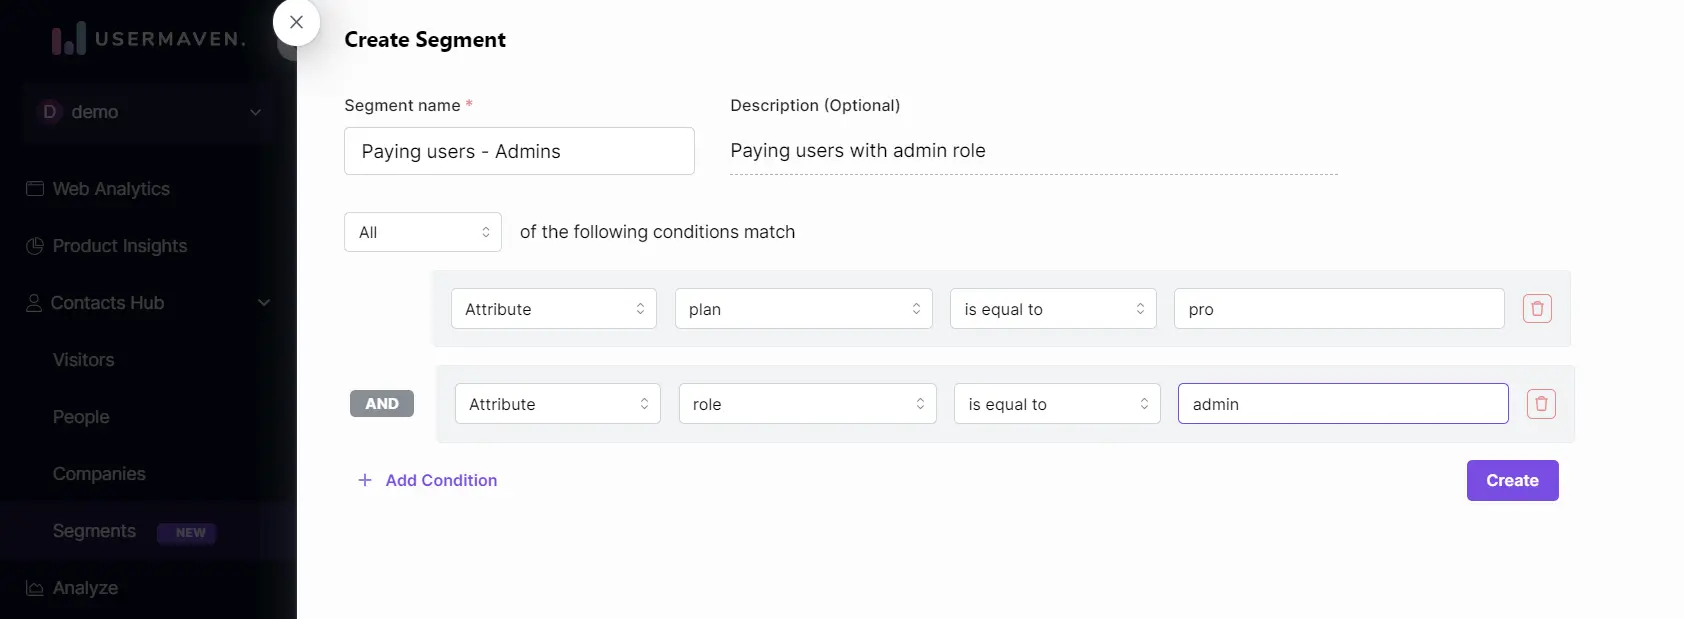
Segmentation by plan, source, or behavior
Not all revenue is equal, and not all customers behave the same. Usermaven allows you to segment your revenue analytics across key business dimensions to surface hidden opportunities.
Break down revenue by pricing plan (e.g., free, starter, pro, enterprise).
Segment customers by acquisition channel, campaign, or lifecycle stage.
Analyze revenue by behavior (e.g., usage frequency, feature adoption).
Compare revenue trends between different user cohorts to refine targeting and messaging.
No-code setup and compliant tracking
Unlike legacy tools that require dev teams or compromise user privacy, Usermaven is built for modern SaaS companies that need speed, simplicity, and compliance.
100% cookie-less tracking with full GDPR compliance.
No-code event tracking setup, perfect for marketers and founders.
Integrates easily with billing tools like Stripe, CRMs, and ad platforms.
Enables fast, secure deployment with minimal engineering involvement.
Maximize your ROI
with accurate attribution
*No credit card required
Comparing revenue analytics tools: Usermaven vs. other platforms
Choosing the right revenue analytics tool is critical for SaaS teams that want accurate insights without complexity or data compliance risks. While GA4, Mixpanel, and Amplitude are commonly used, they were not designed with revenue-first analytics or privacy in mind. Below is a clearer comparison of how Usermaven stacks up against these alternatives.
1. Usermaven
Usermaven is purpose-built for SaaS teams that need actionable revenue insights without relying on engineers. It combines product, marketing, and subscription data into real-time, privacy-friendly dashboards.
Designed for non-technical users with a no-code setup.
GA4 is a general-purpose web analytics tool from Google. While useful for traffic insights, it’s not ideal for SaaS companies looking to tie product behavior to revenue.
Steep learning curve with complex event setup.
Lacks built-in revenue dashboards for SaaS models.
Attribution models are limited and session-focused.
Heavily reliant on cookies, with privacy concerns in many regions.
Requires engineering or external tools for accurate revenue reporting.
3. Mixpanel
Mixpanel offers strong behavioral analytics but was not designed to natively support revenue metrics or attribution.
Advanced segmentation and funnel tracking.
Revenue insights require custom setup and integrations.
Attribution is limited and not revenue-native.
Pricing escalates quickly as event volume grows.
Not fully cookie-less, with potential compliance gaps.
4. Amplitude
Amplitude is a powerful product analytics tool focused on user behavior, but revenue tracking is not a core feature.
Excellent for cohort and retention analysis.
Revenue data needs to be manually connected and maintained.
Attribution models are limited or require workarounds.
More suited for product teams than cross-functional revenue tracking.
Premium pricing for advanced usage.
Comparison table: Usermaven vs. GA4, Mixpanel, and Amplitude
Feature/Capability
Usermaven
Google Analytics 4 (GA4)
Mixpanel
Amplitude
Setup & usability
No-code, built for marketers and founders
Complex, requires technical setup
Developer support is needed for a full setup
Requires technical setup for advanced tracking
Revenue dashboards
Built-in, real-time, focused on MRR, ARR, CLTV
Not revenue-focused, requires custom configuration
Revenue metrics require setup and integrations
Revenue tracking is not central, and needs customization
Event-based, limited visibility into financial outcomes
Path analysis only, disconnected from revenue
Segmentation & cohorts
Segment by plan, source, behavior, and lifecycle stage
Basic segmentation, session-based
Advanced but not revenue-native
Advanced but disconnected from billing data
Privacy & compliance
100% cookie-less, GDPR & CCPA compliant
Cookie-based, facing legal scrutiny
Not fully privacy-first
Privacy varies, relies on cookies
Pricing model
Transparent, startup-friendly, no data caps
Free, but requires costly add-ons for insights
Free tier, but expensive as usage scales
Expensive for high-volume teams or advanced features
Maximize your ROI
with accurate attribution
*No credit card required
Best practices for optimizing revenue analytics
To get true value from revenue analytics, SaaS teams must go beyond surface-level tracking. These best practices help ensure your data is aligned with your strategy, actionable across teams, and optimized for long-term growth.
Align analytics with business goals: Tie every tracked metric to a specific outcome, like churn reduction, LTV growth, or pricing optimization, to ensure analytics drive meaningful decisions.
Establish clear benchmarks and KPIs: Use historical data and industry context to define realistic performance targets, so you can measure improvement and spot issues early.
Monitor revenue across the full customer journey: Track revenue from acquisition to activation, conversion, upsell, and renewal to understand where value is created or lost.
Keep reporting actionable and focused: Avoid overwhelming dashboards, focus on a core set of revenue metrics that influence key decisions, and eliminate noise.
Review analytics consistently, not occasionally: Make revenue analytics part of weekly or monthly team reviews to ensure insights are applied, not just collected.
Common challenges and how to overcome them
Even with the right tools in place, many SaaS teams face roadblocks that prevent them from getting full value out of their revenue analytics. These challenges often stem from fragmented data, unclear ownership, or technical complexity. Below are the most common obstacles and how to solve them effectively.
Data silos between departments: When marketing, product, and finance teams use different tools, it leads to inconsistent insights, solve this by centralizing revenue tracking in a unified platform like Usermaven.
Inaccurate attribution models: Relying on last-click or incomplete attribution skews your understanding of what drives revenue. Overcome this by using multi-touch attribution tied to actual customer journeys.
Limited visibility into recurring revenue: Generic analytics tools don’t track MRR, churn, or CLTV natively; use SaaS-specific solutions that support these metrics out of the box.
Lack of internal alignment on metrics: Different teams may define metrics like “active user” or “churn” differently; standardize definitions across the organization to ensure consistency.
Complex or developer-heavy setup: Tools that require engineering support slow down analysis; choose no-code platforms like Usermaven that empower marketers and founders to access insights directly.
Bottom line: Getting started with revenue analytics
Revenue analytics is one of the most powerful levers SaaS companies can use to drive sustainable growth. It transforms raw transaction data into actionable insight, helping you understand which users bring the most value, which campaigns convert profitably, and where revenue is gained or lost across the journey. But starting doesn’t require complex infrastructure or a full data team.
Begin by focusing on the foundational metrics that reflect your business health, such as MRR, churn, customer lifetime value (CLTV), and CAC. These give you the clarity needed to make informed decisions about pricing, marketing, and customer success.
Next, choose a platform that’s purpose-built for SaaS revenue visibility. Usermaven stands out by offering real-time dashboards, attribution models, and user-level revenue tracking, all in a privacy-compliant, no-code environment. It removes the barriers of technical complexity and gives marketers and founders direct access to the insights that matter.
Finally, integrate revenue analytics into your regular workflows. Whether you’re planning a product update, launching a new campaign, or preparing for a board meeting, your revenue insights should guide the strategy. Using revenue attribution alongside your analytics setup helps you clearly connect revenue outcomes to specific channels, campaigns, and touchpoints. With the right tools and a consistent review process, revenue analytics can become a competitive advantage, driving clarity, alignment, and measurable growth.
Maximize your ROI
with accurate attribution
*No credit card required
FAQs about revenue analytics
What is revenue analytics in SaaS?
Revenue analytics in SaaS refers to the process of tracking and analyzing financial performance metrics like MRR, ARR, churn, LTV, and expansion revenue. It helps businesses understand how revenue is generated, retained, and grown across the customer journey.
Why is revenue analytics important for SaaS companies?
It enables SaaS companies to make data-driven decisions on pricing, customer segmentation, acquisition strategies, and retention efforts. By linking user behavior and marketing performance to actual revenue, teams can focus on what drives long-term growth.
Which revenue metrics should I prioritize first?
Start with monthly recurring revenue (MRR), customer lifetime value (CLTV), churn rate, and customer acquisition cost (CAC). These core metrics provide a complete picture of profitability, sustainability, and growth efficiency.
Can I use revenue analytics without a data team?
Yes. Tools like Usermaven offer no-code setup and pre-built dashboards that make revenue insights accessible to marketers, product teams, and founders without needing engineering support.
How does Usermaven differ from tools like GA4 or Mixpanel?
Unlike GA4 or Mixpanel, Usermaven is built specifically for SaaS businesses. It focuses on real-time revenue tracking, attribution, user journeys, and privacy compliance, without the complexity, cookies, or need for custom integrations.
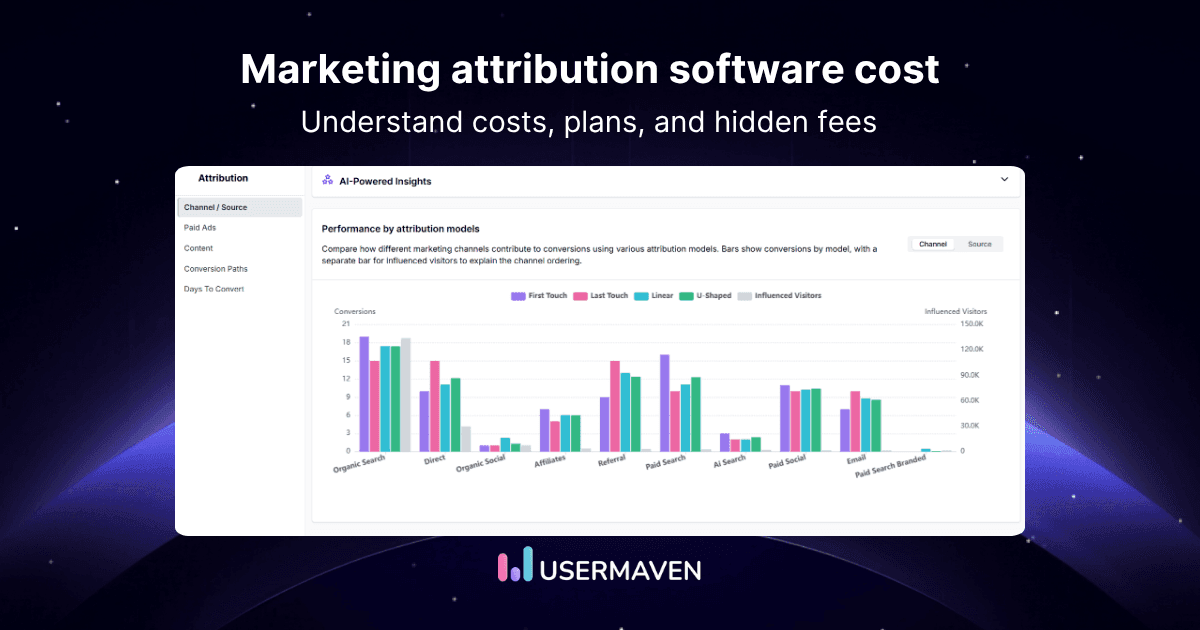
A growing marketing team requests pricing from three attribution vendors. One quotes a number through an interactive calculator that jumps as they adjust a slider. Two others say to contact sales with no figure attached at all. Three conversations later, the team still does not know whether attribution software costs $80 or $8,000 per month […]
Marketers like to think of the buyer’s journey as linear: someone finds your website through Google, signs up for your newsletter, and buys your product. Except, in real life, it looks more like this: a new subscriber opens your welcome email while commuting to work, gets distracted, and forgets about your offer. A few days […]
A SaaS marketing team evaluates six attribution tools over three months and signs a $ 24,000-a-year contract. Eight weeks into implementation, they realize the tool tracks pipeline beautifully but has no idea what happens to a customer after the deal closes. Choosing the wrong attribution tool is expensive twice, once in the contract, once in […]