Marketing teams generate more data than ever before, but data alone does not drive better decisions. Without a clear way to connect campaigns, channels, and customer interactions to revenue, it becomes difficult to know which marketing efforts deserve more investment and which are draining your budget.
A marketing attribution dashboard brings all of your attribution data into one place, helping you measure campaign performance, track customer journeys, compare attribution models, and understand how every touchpoint contributes to pipeline and revenue. Instead of switching between ad platforms, analytics tools, and CRM reports, you get a unified view of marketing performance that supports faster, more confident decisions.
In this guide, you’ll learn what a marketing attribution dashboard is. You’ll see why it matters, plus the key metrics and KPIs to track. We’ll cover how to build one, common mistakes to avoid, and how to choose the right software.
Maximize your ROI
with accurate attribution
Key takeaways
- A marketing attribution dashboard connects marketing channels, customer touchpoints, and revenue into a single view, making it easier to measure campaign performance.
- Tracking KPIs such as marketing attributed revenue, pipeline, ROAS, and assisted conversions helps marketers make smarter budget and optimization decisions.
- Comparing multiple marketing attribution models provides a more accurate understanding of how different channels influence the customer journey.
- Building an effective attribution dashboard requires clean tracking, connected data sources, and regular optimization to maintain reporting accuracy.
- A well designed marketing attribution dashboard helps teams move beyond vanity metrics and focus on the marketing activities that drive real business growth.
What is a marketing attribution dashboard?
A marketing attribution dashboard is a centralized reporting dashboard that shows how your marketing channels, campaigns, and customer touchpoints contribute to conversions, pipeline, and revenue. Instead of switching between ad platforms, CRMs, and analytics tools, it brings all your attribution data into one place, giving you a complete view of the customer journey.
Unlike traditional marketing dashboards that focus on clicks or traffic, a marketing attribution dashboard connects marketing activities to real business outcomes. It helps you understand which channels, campaigns, and touchpoints drive leads, conversions, and revenue, so you can make smarter marketing decisions.
Platforms like Usermaven make this easy by combining first-party data, multi-touch attribution, customer journey analysis, and revenue reporting into a single, easy-to-use dashboard.

Importance of marketing attribution dashboard
Modern customer journeys rarely follow a straight path. A prospect might discover your business through an organic search, return after seeing a LinkedIn ad, read several blog posts, join your email list, attend a webinar, and finally request a demo weeks later. Looking at only the first or last interaction hides most of that journey.
A marketing attribution dashboard gives marketers the visibility needed to understand how every touchpoint contributes to conversions. Rather than relying on disconnected reports from multiple platforms, teams can analyze the user journeys in one place and make more informed decisions about where to invest their marketing budget.
Some of the biggest benefits include:
- Understanding which marketing channels generate qualified pipeline and revenue.
- Measuring the contribution of every touchpoint across complex customer journeys.
- Identifying high-performing campaigns and eliminating wasted ad spend.
- Comparing attribution models to understand marketing performance from different perspectives.
- Aligning marketing, sales, and leadership around a single source of truth.
- Improving budget allocation based on revenue instead of vanity metrics.
- Tracking marketing-attributed revenue, assisted conversions, and return on investment more accurately.
Marketing attribution dashboard vs. traditional analytics dashboards
Both marketing attribution dashboards and traditional analytics dashboards help measure marketing performance, but they answer very different questions. Traditional analytics focus on what happened, while marketing attribution helps you understand why it happened by connecting customer touchpoints to pipeline and revenue.
| Marketing attribution dashboard | Traditional analytics dashboard |
|---|---|
| Connects marketing efforts to pipeline and revenue | Focuses on traffic, sessions, clicks, and page views |
| Measures the complete customer journey | Reports individual website or campaign metrics |
| Supports multi-touch attribution models | Primarily relies on last-click or channel-specific reporting |
| Identifies which channels and campaigns drive conversions | Shows where visitors come from and how they interact |
| Helps optimize marketing spend and budget allocation | Helps monitor website and campaign performance |
| Combines marketing, CRM, product, and revenue data | Data is often limited to a single platform or source |
What questions should a marketing attribution dashboard answer?
A marketing attribution dashboard should do more than display charts and numbers. Its purpose is to answer the questions marketers ask every day when evaluating campaign performance and planning future investments.
An effective dashboard should help you answer questions such as:
- Which marketing channels generate the most pipeline and revenue?
- Which campaigns consistently produce the highest return on ad spend (ROAS)?
- What does the complete customer journey look like before a conversion?
- Which touchpoints assist conversions even if they are not the final interaction?
- Which attribution model best reflects how your customers actually buy?
- Where do prospects drop off during the marketing and sales funnel?
- How long does it typically take for visitors to become customers?
- Which landing pages, content assets, or campaigns influence purchasing decisions the most?
- Which marketing activities deserve additional investment, and which should be optimized or discontinued?
Answering these questions allows marketers to move beyond reporting metrics and start making strategic decisions backed by reliable attribution data.
Key features of a marketing attribution dashboard
A strong marketing attribution dashboard does more than just display numbers. It helps teams understand performance quickly and decide what to do next.
The most effective dashboards include the following features.
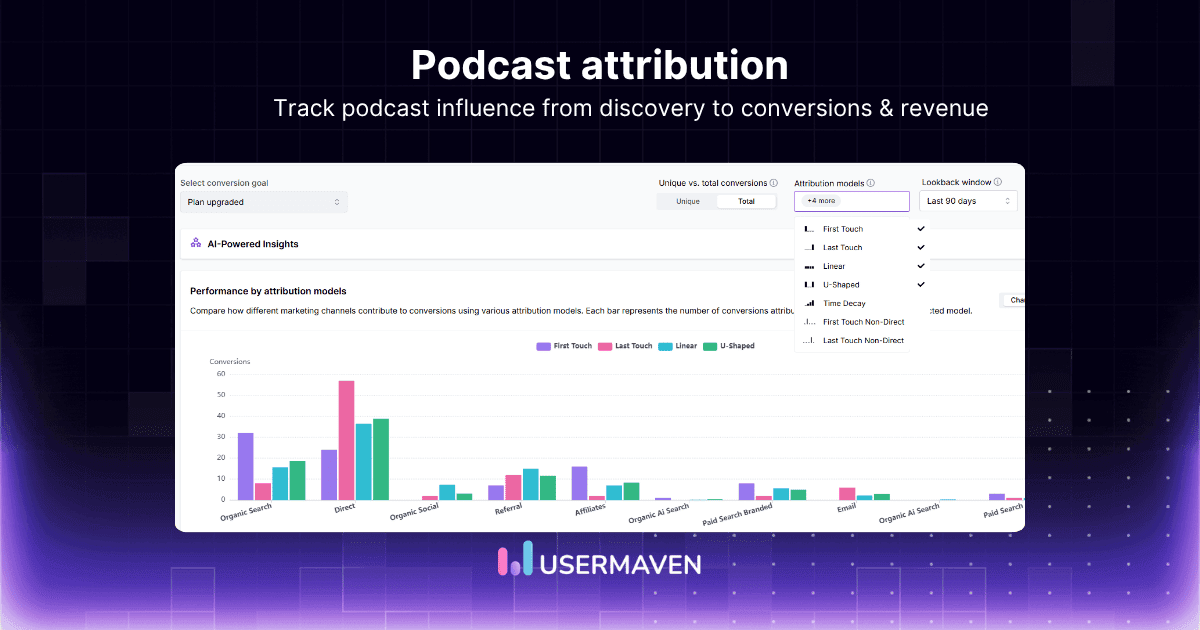
- Multi-touch attribution support: Capture every step of the customer journey with models like first-touch, last-touch, linear, time decay, U-shaped, and W-shaped. This enables multi-touch attribution comparison so you can see how performance looks under different models.
- Real-time performance insights: View conversion and revenue data as it comes in so you can spot trends, anomalies, or tracking issues early, instead of waiting for end-of-month reports.
- Customizable metrics and filters: Drill down by channel, campaign, keyword, creative, landing page, audience, user segment, geography, or account for personalized reporting. This granular view makes it easier to diagnose why a channel is performing well or poorly and where to focus optimization efforts.
- Funnel and journey visualization: See how users move from first touch to sign-up, trial, opportunity, and customer with clear, step-by-step funnel reports and journey visualizations. This is the core of customer journey analysis.
- Cohort and segmentation analysis: Track how different groups behave over time, such as cohorts by acquisition channel, signup date, or plan type. This helps identify high-value segments and where churn or drop-off starts.
- Revenue attribution and assisted conversions: Attribute actual revenue, not just form fills or clicks, back to touchpoints. Show assisted conversions so upper-funnel campaigns and brand programs receive fair credit.
- AI-powered attribution insights: Use machine learning to surface patterns you might miss manually. See which channel combinations tend to precede high-ACV deals. Spot messages that consistently appear in winning journeys. This area is explored through made with intelligent agents. These insights make it easier to spot optimization opportunities and waste.
Maximize your ROI
with accurate attribution
Attribution models in a marketing attribution dashboard
A marketing attribution dashboard is only as effective as the attribution model behind it. Attribution models determine how conversion credit is distributed across customer touchpoints, helping you understand which marketing channels and campaigns influence revenue.
The right model depends on your sales cycle, marketing strategy, and reporting goals. A modern marketing attribution software like Usermaven, lets you compare multiple models to gain a more balanced view of performance.
| Attribution model | Best for | How it assigns credit |
|---|---|---|
| First-touch | Brand awareness | Gives 100% credit to the first interaction. |
| Last-touch | Conversion optimization | Gives all credit to the final touchpoint before conversion. |
| Linear | Multi-channel campaigns | Distributes credit evenly across every touchpoint. |
| Time-decay | Longer buying journeys | Gives more credit to interactions closer to conversion. |
| U-shaped (Position-based) | Lead generation | Prioritizes the first and last touchpoints while sharing the remaining credit across the middle interactions. |
| Data-driven attribution | Advanced marketing analysis | Uses machine learning to assign credit based on historical customer behavior. |
Rather than relying on a single attribution model, compare multiple models to understand how different channels contribute throughout the customer journey. This provides a more complete picture of performance analytics, campaign attribution, and revenue attribution.
Marketing attribution dashboard example
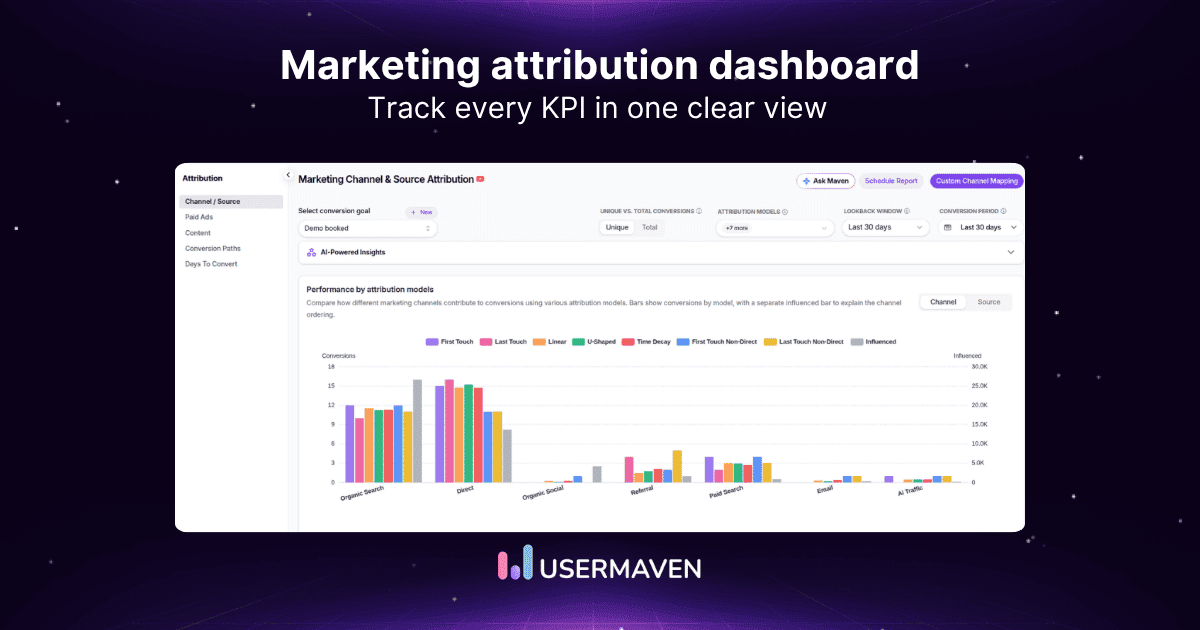
A marketing attribution dashboard gives marketers a single place to monitor campaign performance, customer journeys, attribution models, and revenue. Instead of switching between multiple platforms, it combines marketing, sales, and product data into one unified reporting view.
A typical marketing attribution dashboard may include:
- Executive overview with marketing-attributed revenue and pipeline
- Channel performance reports
- Campaign performance dashboards
- Customer journey visualization
- Conversion funnel analysis
- Attribution model comparison
- Revenue trends over time
- Conversion path reports
- Assisted conversion reports
- Custom filters for channels, campaigns, audiences, and date ranges

With a platform like Usermaven, these reports update automatically as new customer interactions occur, allowing marketing teams to analyze attribution, optimize campaigns, and measure revenue impact from a single dashboard.
10 KPIs every marketing attribution dashboard should track
Here’s an example of the key attribution metrics and reports commonly included in a marketing attribution dashboard:
| Dashboard metric | What it measures | Why it matters |
|---|---|---|
| Marketing-attributed revenue | Revenue generated from marketing campaigns | Measures marketing’s contribution to business growth. |
| Pipeline value | Total pipeline influenced by marketing | Shows how marketing contributes to future revenue. |
| Return on ad spend (ROAS) | Revenue generated for every dollar spent on advertising | Helps optimize advertising budgets and campaign performance. |
| Return on investment (ROI) | Overall profitability of marketing campaigns | Evaluates whether marketing investments generate positive returns. |
| Campaign performance | Conversions, revenue, and engagement by campaign | Identifies the campaigns driving the best results. |
| Channel attribution | Revenue and conversions by marketing channel | Compares the impact of organic search, paid ads, email, social media, referrals, and direct traffic. |
| Customer journey | Every touchpoint before conversion | Reveals how prospects move from discovery to purchase. |
| Conversion funnel | User progression through each funnel stage | Highlights where prospects abandon the buying journey. |
| Assisted conversions | Touchpoints that influenced conversions without being the final interaction | Gives credit to channels that support the buying decision. |
| Attribution model comparison | Performance across first-touch, last-touch, linear, time-decay, and data-driven models | Helps compare marketing performance from multiple attribution perspectives. |
How to build a marketing attribution dashboard in 6 steps
Building a marketing attribution dashboard starts with clean data and clear reporting goals. Rather than trying to track every possible metric, focus on creating a dashboard that helps you measure marketing’s contribution to pipeline and revenue.
Step 1. Define your marketing goals
Start by identifying what you want to measure. Your dashboard should support business objectives such as increasing pipeline, improving ROAS, reducing customer acquisition costs, or understanding the customer journey.
Step 2. Map the customer journey
List every important touchpoint across your marketing funnel, including paid ads, organic search, email campaigns, referrals, social media, website interactions, demos, and product usage. This ensures every meaningful interaction can be attributed correctly.
Step 3. Choose the right attribution model
Select an attribution model that reflects how your customers buy. First-touch and last-touch models work well for simpler journeys, while multi-touch models provide better visibility into longer, more complex buying cycles.
Step 4. Connect your data sources
Integrate your advertising platforms, CRM, website analytics, product analytics, and revenue data into a single source of truth. Consistent UTM parameters and first-party tracking improve attribution accuracy.
Step 5. Build reports around business KPIs
Create reports that focus on metrics like marketing-attributed revenue, pipeline, ROAS, conversion rate, CAC, and assisted conversions. Organize your dashboard so stakeholders can quickly understand marketing performance.
Step 6. Validate and optimize continuously
Review your attribution reports regularly to verify data accuracy, identify tracking gaps, and refine your dashboard as campaigns, channels, and business goals evolve.
Build your marketing attribution dashboard with Usermaven
Usermaven is an AI-powered marketing attribution software that helps businesses understand which marketing channels, campaigns, and touchpoints drive pipeline and revenue. By combining marketing, product, CRM, and revenue data into a single platform, it gives you a complete view of the customer journey without the complexity of traditional analytics tools.
Building a marketing attribution dashboard from scratch often means connecting multiple tools, maintaining spreadsheets, and manually combining data from advertising platforms, CRMs, and analytics software. Even then, attribution gaps and incomplete customer journeys can make it difficult to trust your reports.
Usermaven eliminates that complexity with automatic first-party tracking, unified reporting, and multi-touch attribution, so you can spend less time building dashboards and more time optimizing the campaigns that drive business growth.

With Usermaven, you can:
- Automatically capture first-party customer data that improves attribution accuracy.
- Connect your entire marketing stack, including advertising platforms, CRM systems, product analytics, and revenue data, into one unified dashboard.
- Compare multiple attribution models such as first-touch, last-touch, linear, U-shaped, time-decay, and data-driven attribution to understand marketing performance from every angle.
- Visualize complete customer journeys to see how every touchpoint contributes to conversions, pipeline, and revenue.
- Analyze funnels, assisted conversions, and channel performance to uncover bottlenecks and optimize the customer journey.
- Measure marketing-attributed pipeline, revenue, ROAS, and ROI with customizable reports built for marketers and revenue teams.
- Use AI-powered insights to identify high-performing channels, improve campaign performance, and make more confident budget decisions.
Maximize your ROI
with accurate attribution
Whether you’re optimizing paid advertising, content marketing, email campaigns, or product-led growth, Usermaven gives you a complete view of what drives customer acquisition, pipeline, and revenue. Instead of relying on fragmented reports and assumptions, you get actionable attribution insights that help you make smarter marketing decisions and scale with confidence.
Best practices for using a marketing attribution dashboard
Building a marketing attribution dashboard is only the first step. To generate reliable insights, you need consistent tracking, accurate data, and regular performance reviews.
Follow these best practices to get the most value from your dashboard:
- Align KPIs with business goals. Focus on metrics like marketing-attributed revenue, pipeline, ROAS, and customer acquisition cost instead of vanity metrics.
- Compare multiple attribution models. Reviewing first-touch, last-touch, linear, and data-driven attribution helps you understand marketing performance from different perspectives.
- Maintain consistent campaign tracking. Use standardized UTM parameters and naming conventions to keep attribution reports accurate across every channel.
- Connect your complete marketing stack. Combine advertising platforms, CRM, product analytics, and revenue data to build a complete customer journey.
- Review reports regularly. Analyze dashboard performance weekly or monthly to identify trends, validate tracking, and optimize marketing spend before small issues become larger problems.
- Continuously refine your dashboard. As your marketing strategy evolves, update reports, KPIs, and attribution settings to ensure they reflect your current business objectives.
Following these practices helps transform your marketing attribution dashboard from a reporting tool into a decision-making system that supports long-term business growth.
Looking for the right platform? Explore our guide to the best marketing attribution tools to compare leading solutions and choose the right software for your business.
Common marketing attribution dashboard mistakes
Even a well-designed marketing attribution dashboard can produce misleading insights if it’s built on inaccurate data or poor tracking practices. Avoid these common mistakes to keep your reports reliable.
- Relying on a single attribution model: Compare multiple models to get a complete view of the customer journey.
- Focusing on vanity metrics: Prioritize revenue, pipeline, ROAS, and conversions over clicks and impressions.
- Using inconsistent UTM parameters: Standardize campaign tracking to improve attribution accuracy.
- Ignoring assisted conversions: Consider every touchpoint, not just the first or last interaction.
- Leaving data disconnected: Combine marketing, CRM, product, and revenue data into one dashboard.
- Not validating tracking regularly: Review events, conversions, and integrations to maintain accurate reporting.
- Using the wrong attribution window: Match your attribution window to your typical sales cycle.
- Failing to update the dashboard: Refine KPIs and reports as your marketing strategy evolves.
Bottom line
A marketing attribution dashboard is more than a reporting tool. It helps you connect marketing efforts to pipeline and revenue, understand the complete customer journey, and make smarter decisions about where to invest your budget. With the right KPIs, attribution models, and reporting strategy, you can optimize campaigns with confidence and demonstrate the true impact of your marketing.
Usermaven is a leading marketing attribution platform that brings your marketing, product, CRM, and revenue data into one unified platform. With multi-touch attribution, AI-powered insights, customer journey analysis, funnel reporting, assisted conversions, and first-party tracking, Usermaven gives you everything you need to build an accurate marketing attribution dashboard and measure what truly drives business growth.
Ready to move beyond fragmented reports and last-click attribution?
Ready to see Usermaven in action? Explore the platform or book a demo for a closer look.
FAQs
What is the difference between a marketing attribution dashboard and a marketing performance dashboard?
A marketing performance dashboard provides a broad overview of campaign metrics such as traffic, clicks, impressions, and engagement. A marketing attribution dashboard goes further by connecting those activities to conversions, pipeline, and revenue, helping marketers understand which channels and touchpoints actually influence business outcomes.
Can a marketing attribution dashboard track offline conversions?
Yes. Modern marketing attribution platforms can combine online interactions with offline events such as sales calls, demos, in-store purchases, or CRM updates. This provides a more complete view of the customer journey and improves attribution accuracy for businesses with longer or hybrid sales cycles.
How can I improve the accuracy of my marketing attribution dashboard?
Accurate attribution starts with consistent UTM tracking, reliable first-party data collection, connected marketing and CRM systems, and regular validation of events and conversion tracking. Comparing multiple attribution models also helps reduce reporting bias and provides a more balanced view of marketing performance.
Which teams benefit most from a marketing attribution dashboard?
Marketing attribution dashboards are valuable for growth marketers, demand generation teams, marketing operations, RevOps, sales leaders, and company executives. By providing a shared view of marketing-attributed pipeline and revenue, they improve collaboration and support more informed business decisions.
Can small businesses benefit from a marketing attribution dashboard?
Absolutely. Small businesses often have limited marketing budgets, making it even more important to understand which campaigns generate the highest return. An attribution dashboard helps prioritize high-performing channels, reduce wasted spend, and invest confidently as the business grows.
Updated

Written by
Imrana Essa
SaaS Marketing Lead
Imrana Essa is a marketing lead and content strategist with 8+ years of experience creating and leading content for B2B and SaaS brands. She specializes in marketing analytics, attribution, content strategy, and organic growth, translating complex marketing concepts into clear, actionable insights. Her work focuses on helping marketers understand performance, make data-informed decisions, and build strategies that contribute to sustainable growth.
All articles by Imrana →