Have you ever opened a report and wondered, “What exactly am I supposed to do with this?”
You’ve got the numbers, the charts, but they don’t exactly tell you where to go next.
That’s the classic gap between reporting and analytics. Reporting gives you the basics: what happened, the numbers, the charts. Analytics takes it a step further, digging into why it happened and what actions to take next.
Now, let’s break down the key differences, why both matter, and how using them together can turn raw data into real analytics insights.
What is reporting?
Reporting is about collecting and presenting data to give you a clear view of what’s happening. It tracks key metrics such as user behavior, product usage, and customer engagement, so you can stay informed.
Good reporting helps you see what’s working, what’s not, and where to focus next. It’s essential for tracking progress, spotting trends, and making sure you’re aligned with your goals.
Without reporting, you risk making decisions based on assumptions rather than facts.
What is analytics?
Analytics is the process of examining your data to uncover deeper insights. It goes beyond tracking numbers to understand why things are happening.
Think of it like putting together a puzzle. Each data point is a clue, and analytics helps you connect the dots to get the full picture.
It answers questions like: Why are users dropping off? What’s driving more engagement? Analytics helps you make smarter, more informed decisions based on real insights.
And speaking of understanding your data better, if you’re curious about where you stand with marketing analytics, we’ve got a quiz for you! It’s a fun little challenge, and you might just surprise yourself with what you know!
Reporting vs. analytics
Let’s take a closer look at how reporting and analytics differ and how they complement each other.
The purpose
Reporting is all about tracking performance and showing what’s happening. Whether you’re tracking daily sales, user activity on websites, or product engagement, reporting keeps you up to date on what’s happening right now. It’s the clean, organized view of your key metrics.
Analytics, on the other hand, is your guide to the why. It analyzes data to identify patterns, trends, and insights that help you make better decisions and drive growth.
Data interaction
Reporting is all about clean, simple summaries. You get key metrics through analytics dashboards or reports that keep you updated without the extra complexity.
Analytics goes further. It’s about digging into the data with tools like predictive and diagnostic analysis, looking for patterns and trends, and understanding why things are happening.
The outcome
Reporting gives you visibility and confidence by providing a clear view of your performance. It makes goal tracking simpler and ensures you stay aligned with your broader objectives.
Analytics gives you insights and direction. By digging into the data, you can identify the why behind what’s happening, empowering you to make informed, strategic decisions.
When to use it
Knowing when to rely on reporting vs. analytics comes down to what you need from your data at that moment.
Reporting is best when you need a clear, timely view of your performance. It keeps everyone aligned and informed without overwhelming them with detail. You might use it to:
Get real-time updates on user behavior or product engagement.
Keep stakeholders informed with automated, customizable reports that reflect performance across multiple channels.
Analytics is what you reach for when you need to go beyond the basics. It helps you move from what happened to why it happened and what to do next. For example, you can use analytics to:
Investigate a sudden drop in conversion or traffic.
If you’re thinking about whether to build your own analytics solution or buy one off the shelf, check out our blog on build vs. buy analytics for some helpful insights.
Aspect
Reporting
Analytics
Purpose
Tracks performance and shows what’s happening.
Uncovers patterns, trends, and insights to drive growth.
Involves deeper exploration using tools such as predictive and diagnostic analysis.
Outcome
Offers visibility and confidence with clear metrics.
Provides insights and direction for informed decisions.
When to use
When you need a clear, real-time view of performance.
When you need to understand why something happened and plan future actions.
Types of reports
Reports come in many forms, each serving a unique purpose. Here are some of the most common ones:
Sales report: Shows your revenue growth rate, sales pipeline, and performance against targets, helping you gauge the success of your sales efforts.
Marketing report: Measures the effectiveness of your marketing campaigns, including traffic sources, conversions, and overall ROI.
Customer engagement report: Monitors user behavior, including login frequency, feature usage, and customer activity, to improve retention and satisfaction.
Financial report: Provides a snapshot of your company’s financial health, including revenue, expenses, and profits to track overall performance.
User growth report: Tracks the growth of your user base over time, including acquisition channels, retention rates, and factors driving growth.
Performance report: Evaluates team or individual performance across various metrics, helping you assess productivity and areas that need improvement.
Types of analytics
Analytics comes in different forms, each offering a unique perspective on your data. Let’s dive into the main types of analytics and what they can do for you:
Descriptive analytics: Shows you what has happened. Analyzing historical data helps you understand past performance, whether it’s sales numbers, traffic patterns, or user engagement. It’s all about identifying trends, behaviors, and patterns that have already occurred.
Diagnostic analytics: Explains why something happened. If there’s a sudden drop in conversions or engagement, diagnostic analytics digs into the data to understand the root cause. It’s the investigative part of data analysis, helping you identify issues that need attention.
Predictive analytics: Gives you a glimpse of what is likely to happen. By analyzing past data and trends, predictive analytics forecasts future outcomes such as sales growth, customer behavior, and market shifts. Leveraging both predictive behavioral analytics and predictive customer analytics helps you see what’s coming next with much more clarity.
Prescriptive analytics: Takes things a step further by suggesting what to do about it. After predicting outcomes, prescriptive analytics offers clear recommendations and strategies. It enables you to make informed decisions to optimize strategies across marketing campaigns, customer experiences, and operational improvements.
💡 Curious about how predictive and prescriptive analytics differ? Check out our blog on predictive vs. prescriptive analytics for a quick, easy-to-understand rundown.
Why do you need both reporting and analytics?
Using both analytics and reporting together is like having a map and a compass. You need both to navigate and make the best decisions.
Here’s why they work so well together:
Balanced perspective: Reporting gives you the facts, while analytics helps you understand the story behind those facts. With both, you’re not just seeing the numbers; you’re gaining the insights that drive your decisions.
Holistic view: Reporting alone gives you a snapshot of what’s happening at a given moment. But when you add analytics, you get a clearer understanding of trends and patterns over time. Together, they provide a complete, well-rounded view of your performance.
Better decision making: Reports track what’s been done, while analytics helps you predict what’s next. Having both tools allows you to base your decisions on a solid foundation, knowing the past and planning for the future.
See Usermaven in action
Book a free demo and discover how powerful analytics can grow your business.
*No credit card required
Bridging reporting and analytics with Usermaven
Usermaven is built to connect the dots between reporting and analytics, providing a smoother experience for tracking performance and highlighting the insights that matter. Let’s break down how Usermaven helps you leverage both.
Attribution
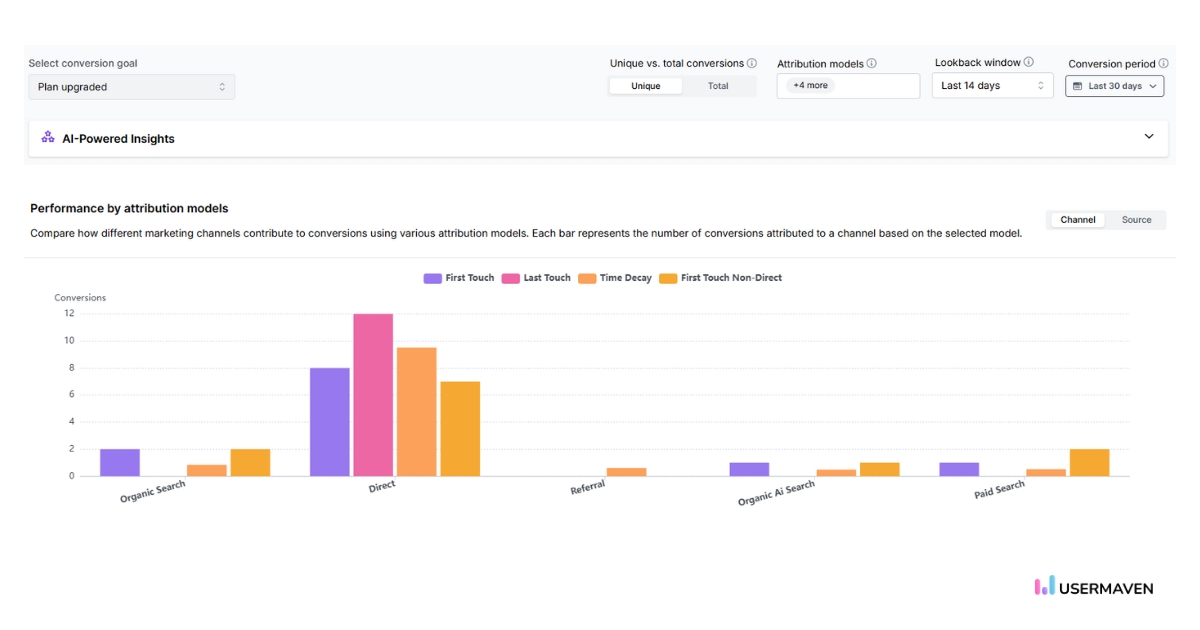
Usermaven’s marketing attribution platform gives you the clarity of reporting and the depth of analytics. You can see which channels are driving conversions and follow the whole customer journey to understand the influence behind each touchpoint. It supports multiple attribution models, giving you various perspectives on performance and helping you move beyond surface-level results to decisions backed by real insight.
Website analytics
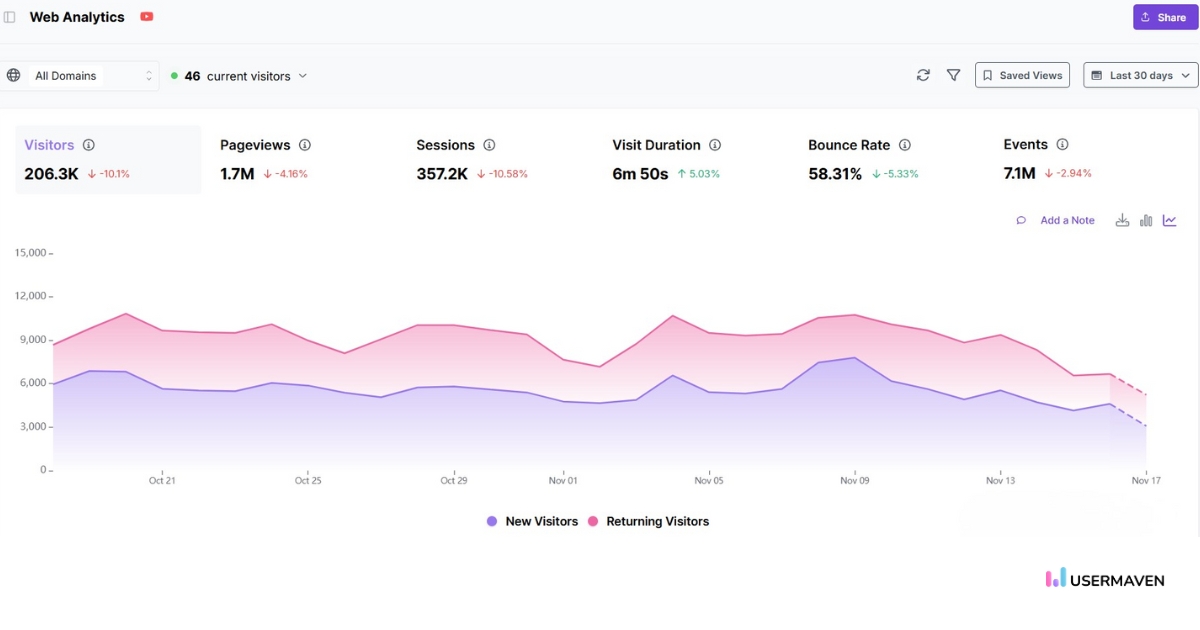
Usermaven’s website analytics cover all your key reporting metrics, such as page views, bounce rates, and session duration, so you always know how your site is performing. But it doesn’t stop there. You can analyze behavior patterns to understand which pages attract attention and which ones lose it, making it easier to optimize both content and experience.
Funnel analysis
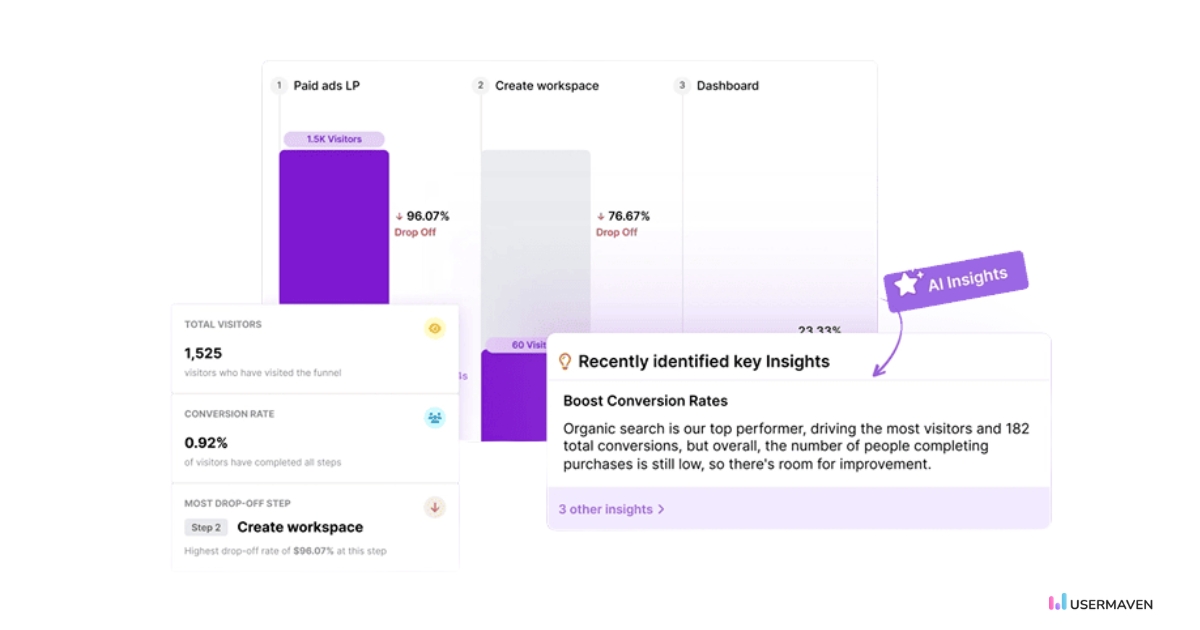
Funnel analysis naturally brings reporting and analytics together. Usermaven shows you where users drop off and lets you analyze why those friction points exist. By combining both perspectives, you can optimize your funnel with greater clarity and intention, leading to smoother paths and stronger conversions.
Retention
Tracking retention metrics gives you a reliable reporting baseline: how often users return, how long they stay active, and where engagement dips. Usermaven then helps you analyze the patterns behind that behavior, so you can figure out what keeps users coming back and where to strengthen your retention strategy.
Customizable dashboards
Customizable dashboards let you build the exact reporting setup you need without the noise. At the same time, they surface real-time insights that support ongoing analysis. Whether you’re tracking KPIs or campaign performance, you see everything in one place and can act faster.
Product engagement
Usermaven helps you track active users and understand how often they engage with your product. These reports help you identify power users and enhance their product experience. At the same time, you’ll uncover opportunities to boost product engagement with less active users.
Feature adoption
Feature adoption metrics give you a quick read on how new features are performing. Usermaven goes further by helping you understand why adoption looks the way it does. You can analyze usage patterns, identify barriers, and make informed decisions about improving or iterating on features with confidence.
Conversion path analysis
Conversion path analysis reports on the steps users take before converting, while also giving you the analytical context behind their choices. Usermaven helps you spot patterns in users’ journeys, identify moments of hesitation, and refine the overall experience to improve conversions.
Wrapping it up
So, here’s the deal: you need both reporting and analytics to make the best decisions. Reporting keeps you grounded and shows you where you stand. Analytics helps you understand the why behind the numbers, giving you the power to act.
With Usermaven, you don’t have to choose between power and simplicity. As the best performance attribution software, it gives you the complete package: real-time reporting, deep analytics, and a seamless experience. It’s the easiest way to understand your data and take action (no more jumping between tools!).
Ready to see how it all works? Book a demo and let’s show you how Usermaven can turn your data into your greatest asset.
FAQs
1. How does analytics add value beyond basic reporting?
Analytics goes beyond the surface by answering why something is happening. It reveals patterns, trends, and insights that help you understand the reasons behind performance, allowing you to make proactive, data-driven decisions.
2. Can I track customer behavior with both reporting and analytics?
Yes! Reporting provides an overview of customer interactions, while analytics helps you dive deeper into customer behavior, including identifying high-value users, tracking churn, and understanding engagement patterns.
3. Can reporting replace analytics, or vice versa?
No, they complement each other. Reporting shows how things are performing, while analytics brings forward insights that guide stronger strategies and improved outcomes.
4. How can Usermaven help me improve my reporting and analytics process?
Usermaven streamlines your reporting and analytics, offering customizable dashboards, detailed user engagement reports, and predictive analytics. It simplifies the process, helping you access all the data you need to make strategic decisions without the hassle of managing multiple tools.
Ruler Analytics pricing is based on monthly website traffic and the level of measurement a business needs. Current plans start at $400 per month for up to 10,000 visits and rise to $2,000 per month for more than 100,000 visits. The final cost can also depend on product, data, and integration requirements. Features such as […]
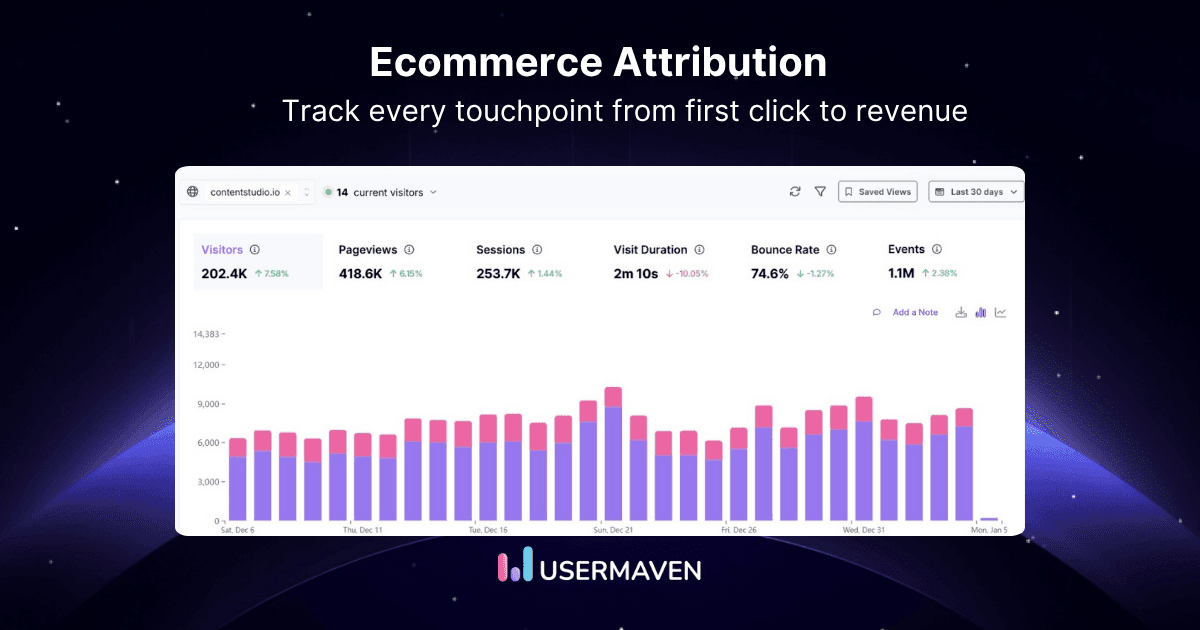
A shopper may discover a product through a Meta ad, return through Google Search, open an email, and complete the order by visiting the store directly. Every platform may claim credit for the same sale. Without reliable ecommerce attribution, teams cannot tell which interaction created demand, which one assisted the decision, and which one simply […]
An agency onboards a new ecommerce client and realizes the attribution tool built for their B2B SaaS clients does not handle Shopify data at all. Two months later, a different client asks for white-labeled reports, and the same platform cannot produce them either. Most attribution tools help marketers see performance. Agencies need tools that help […]