A campaign can deliver more clicks, lower cost per lead, and still produce fewer customers. The problem is not necessarily the campaign. It may be the metric used to judge it.
Marketing analytics is the process of collecting and analyzing marketing data to understand performance, explain changes, forecast outcomes, and improve decisions. It connects channel activity with customer behavior and business results.
When a decision depends on which interactions receive conversion credit, marketing attribution software adds a more specific measurement layer.
This guide explains the four types of marketing analytics, the metrics and formulas worth using, a practical implementation process, and a worked example that turns campaign numbers into an actual budget decision.
Key takeaways
- Marketing analytics turns data into decisions. Its purpose is not to collect the most numbers, but to decide what to improve, stop, or scale.
- Four analytical methods answer different questions: descriptive, diagnostic, predictive, and prescriptive analytics.
- Metrics must match the goal. Clicks and leads can indicate demand, while qualified pipeline, acquisition cost, and revenue reveal different parts of business performance.
- Attribution is not incrementality. Crediting a channel with revenue is different from showing that the channel caused additional revenue.
- Trust the measurement before acting. Check definitions, event collection, CRM joins, and reporting windows before reallocating budget.
What is marketing analytics?
Marketing analytics is the systematic use of data to evaluate marketing activity and improve outcomes such as qualified demand, customer acquisition, retention, and revenue.
It covers measurement, interpretation, and decisions across channels, audiences, campaigns, and customer journeys.
For example, a marketer may see that paid search generates 100 leads and LinkedIn generates 40.
Marketing analytics asks what happens next: how many leads qualify, how many become customers, what they cost to acquire, and whether the outcome justifies the investment.
The data comes from more than one place.
Ad platforms record spend and delivery; website analytics records visits and events; CRM systems record lead stages and deals; billing or ecommerce systems confirm purchases and revenue.
Product analytics may add activation and retention signals. The answer is only as complete as the sources that can be reliably connected.
Data sources used in marketing analytics
| Source | Typical data | Best question answered |
|---|---|---|
| Ad and email platforms | Spend, impressions, clicks, sends, campaign IDs | What did the campaign cost and reach? |
| Website and app tracking | Sessions, landing pages, events, signups | What did people do after arriving? |
| CRM and sales records | Lead stage, accounts, opportunities, won deals | Which demand became qualified pipeline? |
| Billing or ecommerce | Orders, subscriptions, refunds, recognized revenue | What commercial outcome occurred? |
| Surveys and experiments | Brand lift, customer feedback, test results | What might have changed because of marketing? |
An important distinction: linked reporting can show an observed relationship between marketing activity and outcomes. Proving that a campaign created additional outcomes generally requires an experiment or another credible causal method.
Why marketing analytics matters
Better reporting is a means to an end. Marketing analytics becomes valuable when it changes the decisions a team makes about acquisition, messaging, website experience, and customer value.
- Smarter budget allocation: Compare channels using comparable outcomes instead of shifting spend toward the channel with the most clicks.
- Better lead quality: Track whether leads progress to meetings, qualified opportunities, and customers, rather than treating every form fill equally.
- Improved conversion journeys: Use funnels to identify where visitors abandon an important step, then investigate the cause.
- Stronger retention: Connect acquisition sources with activation and repeat behavior to learn whether a channel brings customers who stay.
- Shared decisions across teams: Give marketers, product teams, and sales teams common definitions for leads, conversions, and revenue.
A useful analytics practice also makes uncertainty visible. A campaign may look promising but have too few customers to judge reliably. Another may have strong reported attribution but no evidence of incremental sales.
Good analysis flags both limits.
The four types of marketing analytics
The four core analytical approaches describe how a question is investigated. They are different from application areas such as social media analytics, product analytics, or email analytics, which describe where data comes from.
| Type | Question | Marketing example | Typical output |
|---|---|---|---|
| Descriptive | What happened? | LinkedIn generated 40 leads last month. | Performance summary |
| Diagnostic | Why did it happen? | Lead quality differed between LinkedIn and search. | Segment or funnel analysis |
| Predictive | What might happen next? | Expected customers at the current conversion rate. | Forecast with assumptions |
| Prescriptive | What should we do? | Test a measured budget increase for LinkedIn. | Decision or experiment plan |
Descriptive analytics
Descriptive analysis summarizes what already happened. Teams use it to monitor traffic, spend, conversions, campaign response, and revenue over a consistent period.
A dashboard that shows changes in leads or cost per acquisition is performing descriptive analytics.
It is an essential first step, but by itself it cannot explain why a metric changed. A 20% increase in leads could reflect better targeting, seasonality, tracking changes, or higher spend.
Diagnostic analytics
Diagnostic analysis investigates the likely reasons for an observed change. Marketers compare segments, traffic sources, audiences, landing pages, cohorts, and funnel steps, while checking for broken tracking or changes in definitions.
For example, if signups increase but paid conversions fall, compare activation rates by campaign and look for an onboarding drop-off. That comparison suggests where to investigate; it does not automatically establish causality.
Predictive analytics
Predictive analytics estimates likely future outcomes from historical patterns and relevant drivers. A team might forecast monthly qualified leads using planned spend, seasonal variation, and observed conversion rates.
Forecasts should include assumptions and uncertainty. Results may become unreliable when pricing, tracking, demand, or the customer mix changes. Treat a prediction as a planning input, not a guaranteed outcome.
Prescriptive analytics
Prescriptive analytics uses evidence and constraints to recommend a next action. It could suggest a test budget split, identify which audience to prioritize, or propose a change to an underperforming funnel step.
The strongest recommendations are testable. State the proposed action, expected effect, guardrail metrics, evaluation window, and decision threshold before implementing the change.
Understanding the difference between predictive and prescriptive analytics helps marketers move beyond forecasting future outcomes to identifying the best actions for improving campaign performance.
Marketing analytics metrics that matter
There is no universal list of metrics every team should optimize. The right set depends on whether the objective is reach, qualified demand, purchases, retention, or profitable growth.
The table below connects common metrics to their calculation and interpretation.
| Metric | Formula or definition | What it reveals |
|---|---|---|
| Click-through rate (CTR) | Clicks ÷ impressions × 100 | Creative and audience response |
| Conversion rate | Target conversions ÷ eligible visits or users × 100 | Performance of a defined funnel step |
| Cost per lead (CPL) | Marketing spend ÷ leads | Cost of producing a lead |
| Lead-to-customer rate | New customers ÷ leads × 100 | Downstream lead quality and sales progression |
| Customer acquisition cost (CAC) | Relevant acquisition costs ÷ new customers | Cost to acquire a customer |
| Return on ad spend (ROAS) | Attributed revenue ÷ ad spend | Revenue associated with advertising cost |
| Customer lifetime value (CLV) | Modeled or observed lifetime customer value | Long-term customer economics |
| Retention rate | Customers retained from starting cohort ÷ starting cohort × 100 | Whether acquired customers stay |
For precise comparisons, keep the numerator and denominator consistent. A campaign-level CAC based only on media spend is not identical to a fully loaded CAC that includes salaries, tools, and agency fees.
Likewise, a platform-reported ROAS may use different attribution windows from CRM revenue.
Acquisition and engagement metrics
Impressions, reach, sessions, CTR, and engaged visits help teams diagnose exposure and response. They are especially useful early in the funnel, but they should not be interpreted as proof of commercial value.
For example, a high-CTR campaign that sends visitors to a slow or mismatched landing page can generate interest without producing qualified demand. Pair traffic metrics with landing-page conversion and lead-quality measures.
Conversion and revenue metrics
Conversions, qualified leads, cost per lead, lead-to-customer rate, CAC, pipeline, and revenue show whether marketing activity progresses toward business goals.
Define the conversion event clearly: a newsletter signup, demo request, paid order, and closed-won opportunity are not interchangeable.
Marketing teams that report revenue should also distinguish attributed revenue from incremental revenue. Attribution assigns observed credit using a model; incrementality asks what would have happened without the activity.
Retention and customer-value metrics
Retention, churn, repeat purchases, upgrades, and CLV help evaluate the quality of acquired customers. For subscription businesses, post-signup product analytics helps reveal whether customers activate and keep using the product.
If one channel generates cheap trials that rarely activate, and another produces fewer trials but higher retention, the second channel may have better economics.
Avoid comparing lifetime value estimates built from different time horizons or incomplete cohorts.
How to implement marketing analytics
A useful implementation process starts with a business question and ends with a documented decision.
These six steps create a repeatable cycle that can be used by a small marketing team or a larger revenue organization.
1. Define the decision before the dashboard
Ask one specific question, such as “Which channel produces the lowest cost per new customer?” or “Why are demo requests not turning into qualified pipeline?” Choose an owner, time period,
and action the team can take once the evidence is available.
2. Define conversions and metric ownership
Write down what counts as a lead, marketing-qualified lead, activated account, opportunity, and customer. Specify which system owns each metric and how duplicates, refunds, or reactivated customers are handled.
A measurement dictionary prevents a common reporting failure: marketing celebrates 300 leads while sales reports only 180 eligible prospects because the teams are counting different events.
3. Instrument the customer journey
Use consistent UTM naming, configure meaningful events, and connect campaign and CRM identifiers where appropriate. Map the path from landing page to form, signup, activation, opportunity, and purchase.
Customer journey analysis becomes more useful when every important transition has a defined event.
Where data is missing, label the gap. Consent choices, browser restrictions, cross-device behavior, offline interactions, and CRM matching limitations can all create incomplete paths.
4. Audit data quality before interpreting results
Compare platform totals with source systems. Check duplicate conversions, bot traffic, missing UTMs, mismatched time zones, revenue currency, identity joins, and reporting delays.
Review whether a campaign changed its attribution window or conversion definition mid-period.
These are measurable sources of disagreement, not reasons to assume that any one analytics platform is always correct.
Usermaven offers a Measurement Trust Center that checks tracking and connection health, but every organization still needs its own reconciliation process.
5. Analyze differences and test hypotheses
Segment results by campaign, audience, location, device, funnel stage, and customer cohort. Look for differences large enough to investigate, then test an explanation when possible.
A landing-page experiment, holdout group, or geo test can help distinguish a real effect from an observed association.
6. Decide, document, and review
Capture the finding, proposed action, expected result, constraints, owner, and date of the next review. Maintain a decision log so the team can learn from actions rather than repeatedly rebuilding last month’s dashboard.
- Weekly: Watch spend, tracking health, campaign changes, and critical funnel steps.
- Monthly: Compare channel quality, acquisition cost, pipeline progression, and customer outcomes.
- Quarterly: Revisit attribution assumptions, lifetime-value estimates, channel mix, and experiment results.
Marketing analytics example: Leads vs. customers
Consider two paid channels running during the same reporting period. Each spent $5,000. One generated much more traffic and more leads, but the other produced more paying customers.
The example is hypothetical and assumes the customer and revenue totals are associated with the listed channels under the same reporting method.
| Measure | Google Ads | LinkedIn Ads |
|---|---|---|
| Ad spend | $5,000 | $5,000 |
| Website visits | 2,000 | 800 |
| Leads | 100 | 40 |
| New customers | 5 | 8 |
| New customer revenue | $10,000 | $24,000 |
| Cost per lead | $50 | $125 |
| Lead-to-customer rate | 5% | 20% |
| Media-only cost per customer | $1,000 | $625 |
| Revenue-based ROAS | 2.0× | 4.8× |
Descriptive finding: Google Ads produces 2.5 times as many leads. A report focused on CPL would favor Google Ads because its leads cost $50 compared with $125 on LinkedIn.
Diagnostic finding: LinkedIn converts 20% of leads into customers, compared with 5% for Google Ads. Its media-only cost per customer is therefore lower, and its associated revenue is higher.
Predictive question: If LinkedIn received more budget, would lead quality and conversion rates remain stable? That needs testing because marginal performance can differ from past averages.
Prescriptive next step: Run a controlled budget test with an agreed evaluation window, comparable lead definitions, sales-cycle lag, and a profitability guardrail.
Do not permanently reallocate budget on the basis of one short observation period.
This is also where the difference between credited and caused revenue matters. A field experiment published by the National Bureau of Economic Research found substantial variation in returns to advertising across advertisers.
That supports treating performance assumptions as hypotheses to test, rather than assuming one channel or strategy produces the same incremental return for every business.
A second practical application is content marketing: measure which articles attract visitors, which readers request demos, and how those opportunities progress in the CRM.
A high-traffic article may provide awareness value even when it rarely receives last-click conversion credit.

Marketing analytics vs. related measurement
Marketing analytics is the broad discipline. Several neighboring approaches answer narrower questions, and most teams use more than one. They overlap rather than forming perfectly separate software categories.
| Approach | Main question | Typical evidence |
|---|---|---|
| Marketing analytics | Is marketing performing and what should change? | Campaigns, behavior, costs, customers |
| Website analytics | What do visitors do on our website? | Sessions, events, pages, funnels |
| Product analytics | What do users do after signup? | Activation, feature use, retention |
| Marketing attribution | Which touchpoints receive credit? | Journeys, model rules, conversions, revenue |
| Marketing mix modeling (MMM) | How do marketing inputs relate to outcomes over time? | Aggregated spend, sales, controls |
| Incrementality experiments | What extra outcome did marketing cause? | Treatment and control comparisons |
The distinction between marketing analytics vs. attribution matters for budget conversations. Last-click and multi-touch reports distribute credit across observed interactions, while well-designed experiments estimate the effect of running the marketing activity at all.
Attribution can still be very useful for discovering journeys, comparing campaigns within consistent rules, and finding promising channels. Its results should be interpreted alongside experiments, sales-cycle realities, and data-quality checks.
Common marketing analytics challenges
Most reporting problems are operational, not mathematical. The same team can have sophisticated dashboards and still make weak decisions if definitions, event collection, or attribution assumptions are inconsistent.
| Symptom | Likely cause to check | Practical response |
|---|---|---|
| Ad platform and CRM disagree | Different windows, event definitions, identity joins | Reconcile dates, IDs, and conversion rules |
| Lead volume rises, customers fall | Audience quality, sales delay, onboarding friction | Track cohort progression from lead to customer |
| Direct traffic suddenly spikes | Missing UTMs or referrer information | Audit campaign tagging and redirects |
| A dashboard shows duplicate revenue | Repeated events or mixed gross/net fields | Deduplicate and define the revenue source |
| Forecast accuracy collapses | Changed channel mix or outdated assumptions | Retrain or simplify forecast with uncertainty |
| Teams cannot act on reports | Too many metrics without decision owners | Assign one question and action to each report |
Privacy controls are part of this assessment. Tracking configurations must respect consent and applicable rules. Cookieless or server-side methods do not automatically eliminate legal obligations, and no single collection technique guarantees complete measurement.
Marketing analytics tools and software
Choose software by the data it can reliably collect and the decisions it supports.
A low-cost traffic tool, a CRM platform, and an enterprise data warehouse may all be useful in the same stack without serving the same purpose.
| Tool category | Examples | Most useful for |
|---|---|---|
| Website and campaign analytics | Google Analytics, Matomo | Traffic, acquisition sources, conversions |
| Product analytics | Mixpanel, Amplitude | Activation, funnels, cohorts, retention |
| Marketing attribution and revenue analytics | Usermaven, Dreamdata | Touchpoints, channel contribution, connected revenue |
| CRM and marketing automation | HubSpot, Salesforce | Contacts, pipeline, lifecycle stage outcomes |
| Dashboards and data infrastructure | Looker, BigQuery, Supermetrics | Reporting and combining multiple sources |
Before choosing a platform, test five things: integration coverage, conversion definitions, identity and account matching, access to raw or exportable data, and how the tool handles uncertainty or missing records.
A polished dashboard does not compensate for incomplete tracking.
To compare marketing channels with customer outcomes, analytics dashboards should show acquisition source, customer stages, and supporting revenue records. Avoid relying on a single top-line score.
How AI supports marketing analytics
AI can make marketing analysis faster by turning questions into reports, finding unusual patterns, and helping teams investigate changes. It is useful when marketers need more than a static dashboard.
Maven AI: Ask questions and build reports
With Maven AI, marketers can ask plain-language questions about traffic, conversions, attribution, funnels, and retention. Maven can generate charts, reusable reports, and dashboards from supported workspace data.
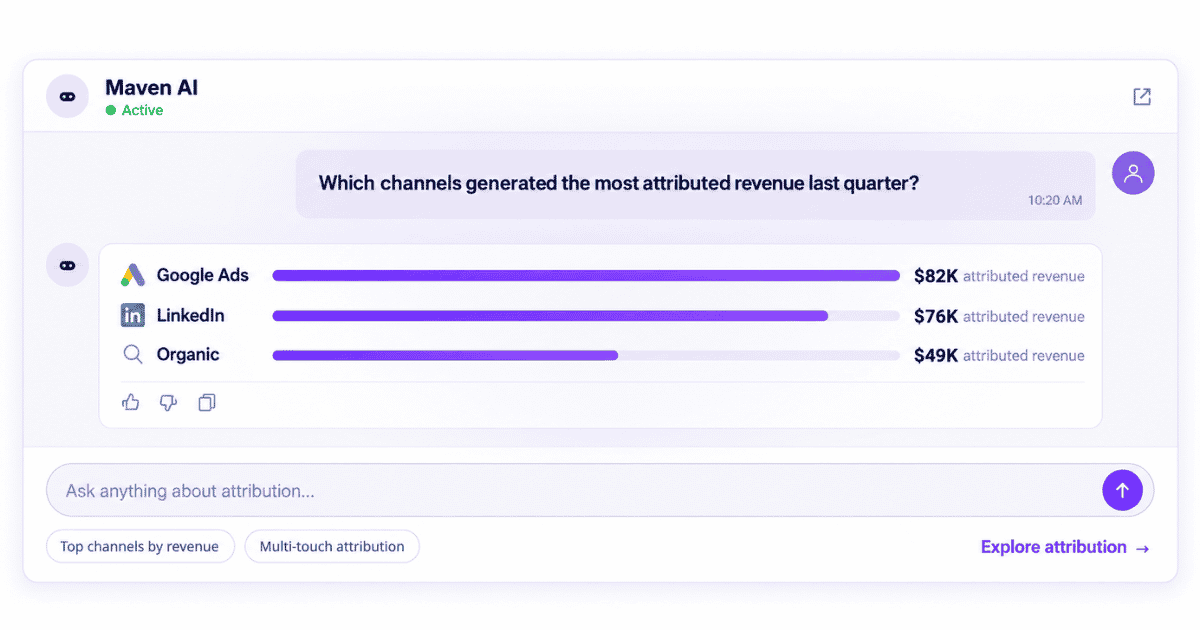
For example, ask which acquisition channel produced the most signups last month. Then request a conversion funnel to compare where visitors from different channels drop off.
Maven AI also supports images, screenshots, PDFs, and spreadsheets in conversations alongside analytics data. This can help investigate reporting discrepancies without assuming the attached materials are automatically correct.
Maven AI Agents: Scheduled investigations
Maven AI Agents run read-only analytics investigations on a recurring schedule. They can check changes in feature adoption, retention cohorts, and user-journey drop-offs, then report findings for review.
A weekly Agent could examine signup-to-activation performance and flag a sudden decline. The team should verify event definitions, sample sizes, and campaign changes before acting on the finding.
Agents investigate and report; they do not independently edit analytics data or execute marketing changes. AI findings are not proof of causation, and consequential budget decisions still require human review.
Sharing findings across teams
Analytics also fails when the evidence is available but sales, finance, and product teams cannot find the same context.
Cross-team knowledge tools such as Glean’s AI for every team can help employees retrieve relevant documents and shared decisions. They complement measurement systems rather than replacing the underlying marketing event or revenue data.
Connecting marketing activity to revenue
Usermaven combines website and product analytics with marketing attribution, conversion paths, customer journeys, and connected CRM outcomes.
For B2B SaaS teams, this can link campaign activity to account and opportunity stages rather than ending the report at a form fill.
Usermaven also supports Salesforce opportunity and stage data, HubSpot attribution workflows, and MCP connections with compatible AI clients. Enterprise workspaces can configure custom attribution models. Availability depends on plan and integration setup.
For example, Usermaven customer ContentStudio reported a 128% increase in signups, 92% more plan upgrades, and 242% more demo bookings in its published case study after improving visibility into paid campaign performance.
These are results from one customer case, not outcomes every company should expect.

For B2B SaaS teams, the most useful view combines source, signup, activation, qualified opportunity, and revenue, with definitions that remain consistent across marketing and sales.
Usermaven is one option for bringing these measurements together when a business needs both behavioral and marketing-to-revenue analysis.
See Usermaven in action
Book a free demo and discover how powerful analytics can grow your business.
Getting started: A practical checklist
A small, trustworthy analytics setup is more valuable than a large dashboard nobody uses. Start with one journey and extend your coverage after the numbers reconcile.
- Choose one outcome. For example, qualified demos, new paying customers, or ecommerce orders.
- Define the conversion. Specify the event, owner, source of truth, and reporting window.
- Tag acquisition consistently. Standardize campaign names and UTM parameters.
- Track the next two meaningful steps. A lead without qualification or purchase context is only part of the result.
- Validate source data. Reconcile samples against the CRM, billing system, and ad platforms.
- Review and act. State a hypothesis, make a measured change, and document the outcome.
The goal is a short decision loop: ask a focused question, collect trustworthy evidence, interpret it with the correct method, and measure what happens after taking action.
Conclusion
Marketing analytics works when it connects campaign activity to customer outcomes and makes the next decision clearer.
Learn the four analytical methods, choose metrics that match the decision, check measurement quality, and use experiments when you need evidence of incremental impact.
If the challenge is connecting campaigns, website activity, product behavior, and revenue in one view, book a demo to see how Usermaven can support a more connected marketing analytics workflow.
FAQs about marketing analytics
1. What is marketing analytics, and why is it important?
Marketing analytics means collecting and analyzing marketing performance data to guide decisions. It matters because it helps teams evaluate channels, customer behavior, acquisition costs, and business outcomes rather than relying only on clicks or assumptions.
2. What are the four types of marketing analytics?
The four main methods are descriptive analytics (what happened), diagnostic analytics (why it happened), predictive analytics (what may happen next), and prescriptive analytics (what to do about it).
3. How do you use marketing analytics?
Start with a business question, define relevant conversion events, collect data from channels and customer systems, check accuracy, analyze the results, and test a specific improvement. Review performance again after making the change.
4. Which marketing analytics metrics matter most?
The right metrics depend on the goal. Common examples include conversion rate, qualified leads, customer acquisition cost, return on ad spend, revenue, retention, and lifetime value. Use consistent definitions and reporting periods.
5. What is an example of marketing analytics?
A team compares two advertising channels and finds that the one generating fewer leads actually produces more customers at a lower cost per acquisition. It tests a budget shift while monitoring customer quality and profit.
6. How is marketing analytics different from attribution?
Marketing analytics evaluates overall marketing performance and opportunities to improve it. Attribution assigns credit for observed conversions or revenue across marketing interactions using an attribution model. Attribution does not, by itself, establish incremental impact.

Written by
Ryan Mitchell
Marketing Analytics Strategist
Ryan Mitchell is a marketing analytics strategist specializing in campaign measurement, customer journeys, and marketing performance. He writes about analytics, reporting, and data-driven marketing strategies, helping SaaS and B2B teams measure what matters across every stage of the customer journey.
All articles by Ryan →