Your traffic is up. But revenue isn’t. What’s going on?
When marketers open their web analytics dashboard, sessions are usually the first number they check. It tells you how many times people visited your site, but a rising session count doesn’t always mean things are going well.
In analytics, the number of sessions is the count of distinct visit windows users start on your site within a given time period. Each session ends after 30 minutes of inactivity, or when your tracking rules say it should.
In this guide, you’ll learn how to calculate sessions per user, spot tracking issues that inflate your numbers, and find better ways to earn more meaningful return visits.
What is the number of sessions in analytics?
The number of sessions in analytics is the total count of visit windows users open on your site or app in a chosen period. Each session groups all the hits, events, and pageviews from one continuous visit into a single record.
Instead of staring at raw pageview totals, this metric tells you how many real visits your marketing, product, or content actually earned.
A session begins when a user lands, and it ends when the timeout passes, a new campaign source appears, or some tools reach a date boundary. The standard timeout is 30 minutes of inactivity, though teams can change this.
Think of a session like a visit to a coffee shop. You walk in, order, maybe check email, and leave; that counts as one visit. Come back two hours later for an afternoon coffee, and that is a second session, even though it is the same person.
In tools like Usermaven, the number of sessions chart shows how active your audience really is. When you pair it with web analytics concepts and other important website metrics, you can separate simple traffic spikes from meaningful user behavior.
Sessions vs users vs pageviews: What is the difference?
Sessions, users, and pageviews answer different questions, even though people often lump them together. Understanding the gap between them keeps you from misreading retention or acquisition trends.
Metric
What it measures
Example
Users
Distinct individuals
600 users = 600 distinct people
Sessions
Individual visit windows
1,000 sessions = 1,000 distinct visits
Pageviews
Pages loaded across all sessions
3,500 pageviews = total pages viewed in all visits
When users grow while sessions stay flat, you are attracting new people who seldom return, which is a weak loyalty signal. If sessions grow while users stay steady, you are building a stronger habit among an existing audience.
How do you calculate the number of sessions per user?
The number of sessions per user is calculated by dividing total sessions by total users for the date range you care about. This simple ratio shows how often an average person returns, which makes it a clearer engagement signal than raw traffic alone.
Formula:
Sessions per user = Total sessions / Total users
Imagine your SaaS site records 4,200 sessions from 2,800 distinct users over 30 days. Sessions per user equals 4,200 divided by 2,800, which comes out to 1.5 visits per person.
A value near 1.0 means most visitors come once and never return. Higher ratios point toward stronger repeat behavior.
Even a small improvement in retention typically drives more growth than the same effort spent on new acquisition, which is why tracking this ratio over time matters. When you pair sessions per user with user behavior tracking and digital marketing metrics and KPIs, you start to see which channels and features actually build loyalty.
What counts as a good vs a bad number of sessions?
A good or bad number of sessions per user always depends on your business model, but some ranges are commonly used as reference points. Treat these as directional, not firm targets, then adapt them to your own product or site.
Sessions/user ratio
What it signals
Likely cause
3.0 and above
Strong return habit
High product value, daily use case
1.6 to 2.9
Healthy engagement
Good content or product stickiness
1.2 to 1.5
Moderate, room to improve
Mixed audience intent
Below 1.2
Most visitors are one-and-done
Poor UX, weak SEO targeting, or slow load
For a daily SaaS dashboard or news app, teams often aim for 3.0 sessions per user or higher within a month. A B2B consulting site or high-ticket ecommerce store may be happy around 1.6, because buyers research deeply before committing.
Always segment by channel and device, then compare against your own history instead of chasing a single universal number.
How to increase your number of sessions: 4 proven strategies
Raising your number of sessions in a healthy way means giving people strong reasons to come back, not just buying more clicks. The strategies below focus on improving the experience for returning visitors so the sessions per user ratio climbs for the right reasons.
For each one, pay attention to the suggested signal so you know progress is happening even before the headline metric moves.
Strategy 1: Optimize for mobile and Core Web Vitals
Mobile visitors often make up the majority of your traffic, especially for content sites and B2C products. According to Statista, more than half of global web traffic now comes from phones and tablets. If those visitors face slow loads or clumsy layouts, they are very unlikely to return for a second session.
Slow mobile load times are one of the most common causes of abandoned visits and low return session rates.
Improve mobile load speed so pages appear quickly on 4G and congested networks. Compress images, defer non-essential scripts, and use a content delivery network to cut latency. Faster first paint encourages deeper exploration within each session.
Make tap targets large and well spaced for thumbs. Buttons or links that are too small cause mis-taps and general frustration. When navigation feels smooth, users are more likely to move from awareness pages into demos, docs, or pricing on the same visit.
Reduce layout shifts that cause content to jump while loading. Sudden moves disrupt reading and often lead to accidental taps on wrong buttons. Cleaning up these shifts creates calmer sessions where visitors can focus on your message.
The signal to watch is mobile bounce rate and average session duration by device in your analytics dashboard or broader web analytics strategy. When mobile sessions stop ending after a single quick view, your retention work has a solid base.
Strategy 2: Fix your SEO to attract users who will come back
Search traffic can look impressive in volume while still bringing visitors who never return. That often happens when your content targets broad keywords instead of the specific questions your best customers search for.
Improving intent alignment usually matters more than simply ranking for bigger terms.
Map each key page to a clear, narrow search intent. A guide focused on “SaaS onboarding email examples” attracts people far closer to purchase than a vague “SaaS marketing” article. Visitors who find exactly what they expected are more likely to explore further.
Review high-traffic, low-engagement pages in your content analytics reports. Look at the queries that bring users to those pages and ask whether the content truly answers them. If not, improve the page or retarget the keyword.
Build topical clusters rather than one-off posts. When someone finishes a helpful article and sees several related pieces, they have an easy path into a second or third session later in the week.
Search and content are among the strongest sources of high-intent leads for most B2B and SaaS companies, but only when traffic quality is high. The signal to watch is sessions per user for organic traffic. If it lags far behind other channels, your SEO keywords likely attract the wrong audience.
Strategy 3: Use personalisation and retargeting to pull users back
The first visit gives you rich first-party data about what a person cares about, and you can use that to bring them back. Rather than sending the same generic messages to everyone, personalize follow-ups and ads based on in-session behavior.
Personalize on-site content for returning visitors. If someone viewed product analytics pages and your pricing table, highlight deeper guides or a demo banner the next time they arrive. This makes every new session feel relevant.
Build remarketing audiences based on key events, such as viewing the pricing page, starting signup, or using a feature once. A pricing-page visitor who did not convert should see very different ads from a casual blog reader.
Use funnel analysis, audience segmentation, and behavioral segmentation inside Usermaven to define the right groups before exporting them to ad platforms. Target users who reached a step but did not complete signup, or those whose session frequency is slipping.
When return visits feel relevant and personalized, the value of how to calculate conversion rate figures tends to be higher than with generic campaigns. The signal to watch here is the returning visitor rate and conversion rate by segment.
Strategy 4: Build omnichannel touchpoints that create re-entry moments
People rarely remember to revisit a site on their own, so you need gentle prompts across channels. Consistent email, social, and product communication creates many small chances for users to start another session.
Treat your email list as a session engine, not just a promotion channel. Weekly newsletters, product update digests, and educational sequences all pull subscribers back to your site. You can track which email types lead to the longest or most frequent sessions in omnichannel analytics reports.
Use LinkedIn and other social platforms to keep your brand visible between visits, especially for B2B SaaS. Short threads that link back to case studies or feature walkthroughs give followers specific reasons to click. Tag links with cross-channel marketing UTM codes so you can attribute the sessions correctly.
For product-led companies, in-app messages and lifecycle marketing emails can bring inactive users back into meaningful sessions. With the campaign analytics, you can see which touchpoints actually drive repeat visits.
Segmented email campaigns consistently outperform generic broadcasts in click-through rates and revenue per recipient, and that difference usually appears as more frequent site visits. The signal to watch is sessions per user for email and owned channels.
What factors affect your session count?
Several technical settings and tracking choices can change your session count without any real shift in user behavior. To read the number of sessions correctly, you need to know how timeouts, UTM tags, cross-domain rules, and date boundaries work inside your analytics tool.
Tracking setup problems are one of the most common causes of bad decisions in UX and marketing, so this is worth fixing early.
Session timeout settings change how long a single visit can last before it becomes a new session. If you shorten the timeout from 30 minutes to 10, long reading or video visits are suddenly split into several sessions. Two teams using the same product can report very different session counts just because they picked different timeout values.
UTM parameters on internal links can also inflate the number of sessions. Many tools start a new session whenever campaign parameters change, even if the user never left the site. Reviewing your UTM parameters and critical UTM mistakes is one of the fastest ways to calm noisy session charts.
Cross-domain tracking gaps appear when visitors move between your main domain, subdomains, and external payment providers. If identity is not passed correctly, your analytics platform treats each hop as a new session. Check out the guide on cross-domain tracking to learn how to maintain a continuous view of each visitor journey.
Midnight boundary resets end all active sessions at midnight, then start new ones a second later. A reader who scrolls your article from 11:50 pm to 12:10 am appears as two sessions, even though the experience felt like one visit. This matters most for global products where visitors cross many time zones.
How ad-blockers and tracking gaps corrupt your session data
According to Statista, more than a third of internet users now use ad-blocking tools. Ad-blockers and browser privacy tools can quietly break your session tracking. In some cases, visits are never recorded at all.
Many users now browse with ad-blockers or privacy-focused browsers like Brave and Firefox. When tracking scripts fail to load, sessions go missing from reports.
This often undercounts technical and privacy-conscious audiences, especially in B2B SaaS analytics, where buyers are more likely to block trackers.
At the same time, issues like UTM resets, cross-domain problems, and session timeouts can artificially increase session counts.
These tracking gaps make session trends harder to trust unless your analytics setup is
How does Usermaven track sessions more accurately than GA4?
Usermaven tracks the number of sessions more accurately than Google Analytics 4 by capturing visits that GA4 often misses and counting them without sampling. The platform is built for privacy-first, cookieless measurement, so ad-blockers, browser limits, and cross-domain flows have far less impact on your numbers.
That means your team can trust that a rise or fall in sessions reflects real behavior, not tracking quirks.
Ad-blocker bypass and near-complete data give you a truer session count. Usermaven uses tracking methods designed to avoid common filter lists, so even privacy-conscious users still appear in your reports. Internal tests and customer feedback show around 99% data accuracy, compared with much lower coverage in standard tag-based tools.
Quick setup replaces complex custom code. A simple JavaScript snippet or plugin gets Usermaven running in a few minutes on platforms such as WordPress and Webflow. From that point, it automatically records sessions, pageviews, clicks, and form submissions without waiting for developer resources.
Cookieless and privacy-first tracking make your session data both accurate and compliant. Instead of relying on fragile third-party cookies, Usermaven uses first-party data and modern techniques such as cookieless attribution. That keeps reports stable even as browsers such as Safari and Firefox restrict older tracking methods.
If you care about GDPR and CCPA, posts on privacy-first analytics tools explain why this approach matters.
No data sampling avoids the guesswork that GA4 sometimes adds to large reports. When traffic or event counts pass certain limits, GA4 may model or sample data instead of storing every hit. Usermaven stores every session as a real event, so funnels and cohorts stay precise.
What does Usermaven actually show you about sessions?
Accurate collection is only helpful if the data is easy to read, and Usermaven focuses strongly on that part. The platform gives you dedicated views that connect session trends with behavior, funnels, and individual user profiles.
A web analytics dashboard shows total sessions, sessions per user, bounce rate, visit duration, and top channels in one place. You can filter by device, geography, or campaign to spot where return visits are strongest.
The website analytics software product tracks sessions across multiple domains and subdomains from a single login. That keeps the visit together when users move from your marketing site to your app or a checkout provider.
Auto-tracked events record in-session actions such as pageviews, button clicks, and form submissions without manual tag setup. This gives you a full picture of what happened during each visit, not just that a session existed.
Session timelines and the Contacts Hub map each person’s complete session history into a single profile. You can open an account and see every visit, page, and key event in order.
The product analytics software focuses on funnels, cohorts, and feature adoption inside your app. It highlights exactly where sessions tend to end, such as a slow onboarding step or a confusing pricing screen.
Conclusion: Start measuring sessions accurately
The number of sessions tells you how often people truly visit your site or product, not just how many pages they load. When you pair it with sessions per user and related engagement metrics, it becomes a clear view of retention instead of a vanity chart.
Getting that view right depends on clean tracking. A privacy-first platform such as Usermaven gives you accurate, unsampled data and clear dashboards so you can finally trust what your analytics say.
A climbing session count is only good news if the data behind it is clean.
Most analytics tools give you a partial picture. Usermaven gives you the complete one.
Start a free trial and see what your sessions actually look like when nothing is missing. For a deeper view into how sessions fit inside your broader marketing analytics, try Usermaven free with no credit card required.
Frequently asked questions
1. What is the difference between a session and a visit in analytics?
Session and visit usually mean the same thing, but only session has a strict technical definition. In GA4 and Usermaven, a session is a period of activity with a timeout, such as 30 minutes of inactivity. The word visit is informal and does not specify those rules. To see why accuracy matters, review the advantages of using web analytics.
2.Does refreshing a page count as a new session?
Refreshing a page does not start a new session while the current one is still active. The refresh simply adds another pageview to the existing visit. A new session begins only after the timeout passes, midnight splits it in some tools, or a new campaign source is detected.
3. How long does a session last by default in most analytics tools?
Most analytics platforms, including GA4, use 30 minutes of inactivity as the default session timeout. Teams can usually adjust this in settings. Longer timeouts work better for long-form content or video, while shorter ones fit quick ecommerce actions. Changing the timeout will directly change your reported number of sessions.
4. Can one user have multiple sessions in a single day?
Yes, a single user can create many sessions in one day. Each time they leave and come back after the timeout, the tool starts a new session. A person might visit at 9 am, 2 pm, and 9 pm, which counts as three sessions. Some legacy tools even split a single long visit into two when it crosses midnight.
5. Why does my session count in Usermaven differ from GA4?
Session counts of Usermaven differ because tools handle timeouts, ad-blockers, and cross-domain flows in different ways. GA4 relies on client-side tags that ad-blockers often stop, and it can inflate counts when UTM parameters reset. These GA4 data delay challenges and Google Analytics limitations are many reasons for this difference.
6. Is a high number of sessions always a good sign?
A high number of sessions is only helpful when quality metrics look good, too. Sudden spikes can come from bots, broken redirects, or hyper-aggressive remarketing. Always check the good vs bad bounce rate and vanity metrics guides to avoid false wins.
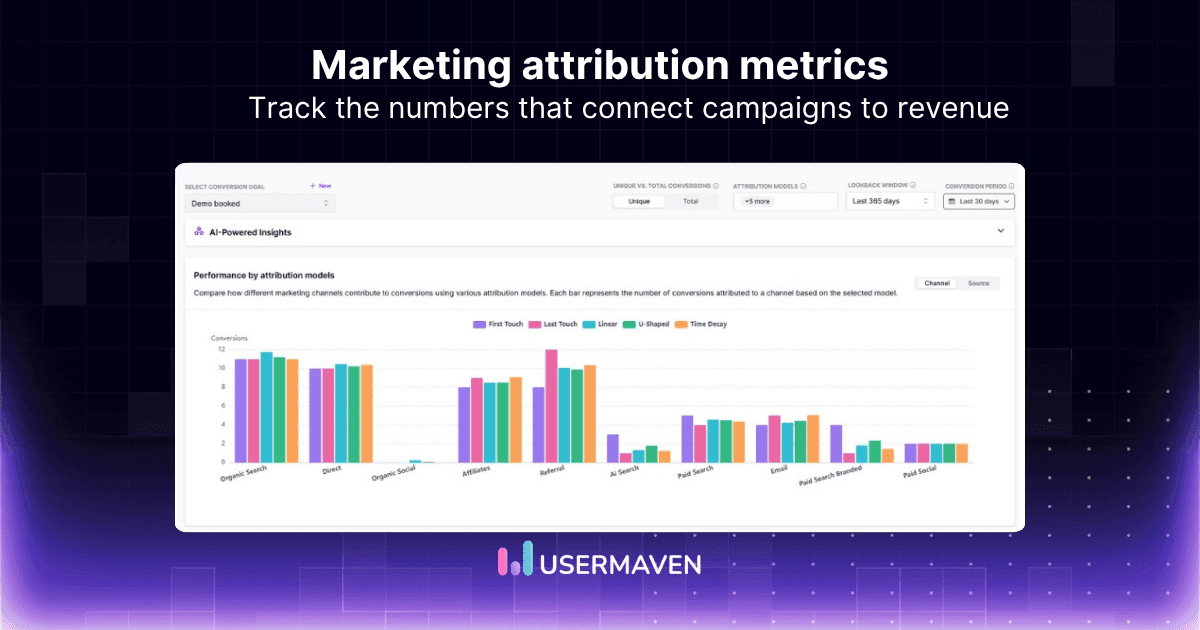
A campaign produces thousands of clicks, hundreds of conversions, and a low cost per lead. The advertising dashboard looks successful. The CRM tells a different story. Few leads become qualified opportunities, closed revenue remains low, and many of the customers acquired through the campaign cancel within their first few months. This difference exists because campaign […]
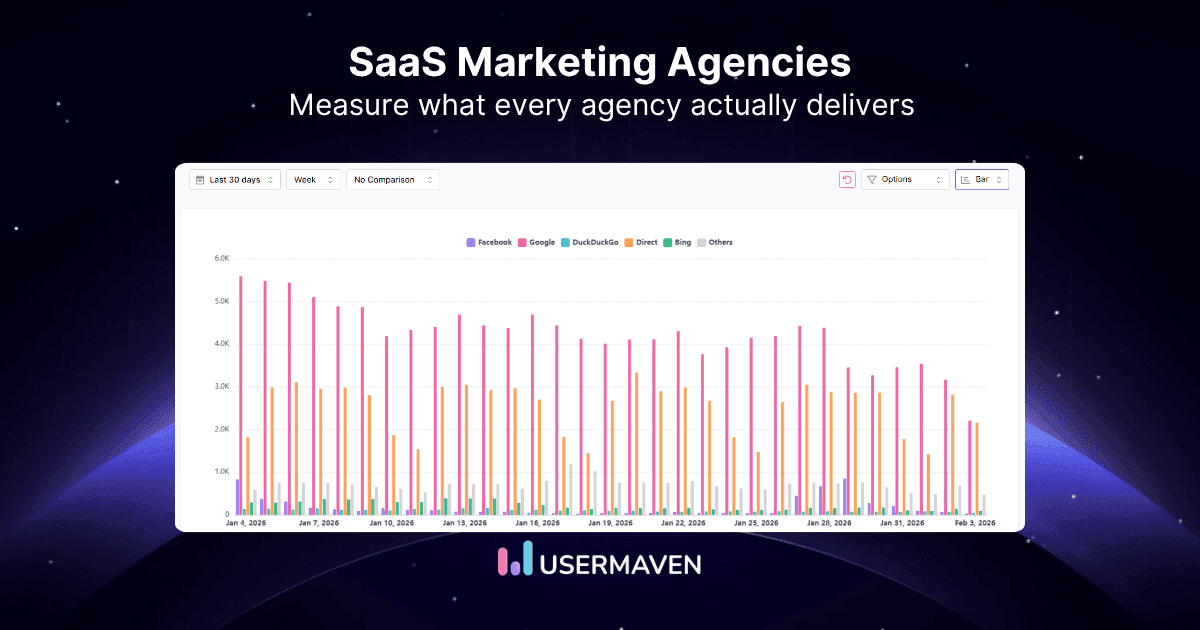
A typical SaaS buying journey has nothing to do with the classic seven touches. Today, the environment is so crowded that you need to build trust, stay visible across multiple channels, and show up everywhere your buyers are researching. Most SaaS teams do not have the resources or specialist depth to do all of this […]
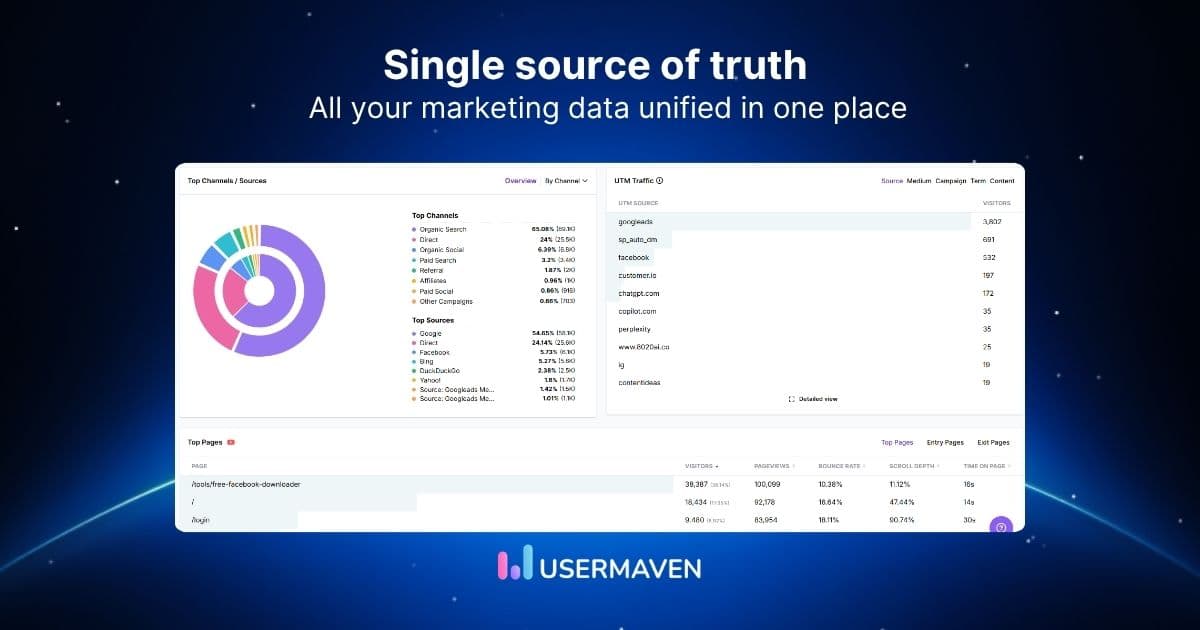
Monday morning. The marketing team opens five tools and still cannot agree on last week’s conversions. Google Ads, GA4, Meta Ads Manager, the CRM, and a revenue spreadsheet all show different numbers. The meeting ends with guesses, not decisions. A single source of truth is a shared, authoritative data layer where every important marketing and […]