Two advertising platforms can observe the same customer journey and report different results. The difference often comes from the attribution model, eligibility window, identity signals, and conversion definition used by each system.
An ad attribution model determines how conversion credit is distributed across eligible interactions. Reliable marketing attribution software must also show which channels were included and whether the outcome was a lead, purchase, opportunity, revenue, or retained customer.
This guide explains the main ad attribution models models, applies them to one customer journey, and shows how to choose a reporting view without treating any model as absolute truth.
Key takeaways
Models distribute credit: The model determines how much credit each eligible interaction receives.
Windows control eligibility: The window determines how long a click, view, or engaged view can receive credit.
No universal winner: The right model depends on the campaign objective, journey length, data volume, and business question.
Platform reports have boundaries: Each ad network measures the interactions and identities available inside its own ecosystem.
Attribution is not causality: Credit assignment does not prove that an ad created incremental demand.
Downstream value matters: Strong attribution follows campaigns into qualification, revenue, retention, and lifetime value.
What is an ad attribution model?
An ad attribution model is the rule or method used to assign conversion credit across eligible advertising interactions. It is a paid-media application of broader marketing attribution models, with added attention to ad clicks, impressions, engaged views, campaign identifiers, and platform-specific reporting rules. For a complete overview of attribution in advertising (including ROI considerations), read the full guide to attribution in advertising.
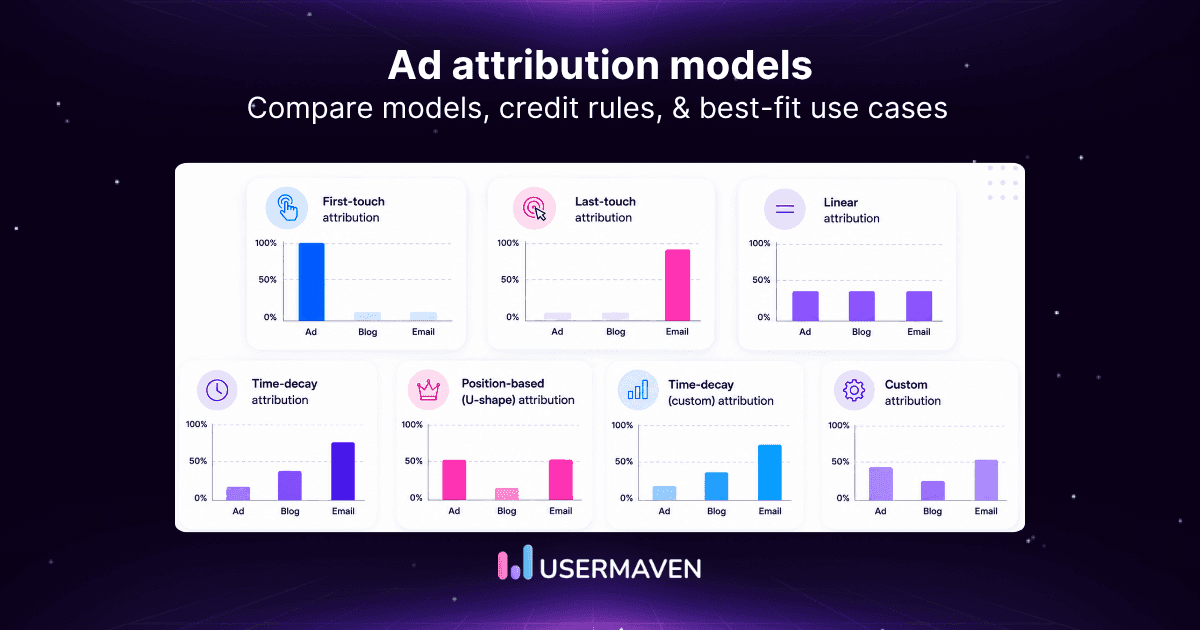
Models are usually grouped into three categories. Single-touch models assign all credit to one interaction, rule-based multi-touch models distribute credit using fixed weights, and algorithmic models estimate contribution from observed patterns.
Single-touch models
First-click, last-click, and last non-direct attribution place all credit on one eligible interaction. They are easy to explain, but they reduce a multi-step journey to one reported winner.
Rule-based multi-touch models
Linear, time-decay, and position-based models divide credit across several touchpoints. Their weighting is transparent, but it reflects predefined assumptions rather than measured causal impact.
Algorithmic models
Data-driven and custom algorithmic approaches use historical paths, conversion outcomes, or business-defined logic to estimate contribution. They can reflect more complexity, but their value depends on data quality, scope, and explainability.
Table 1: Ad attribution models compared
| Model | Credit assignment | Best used for | Main limitation |
| First-click | 100% to the first interaction | Discovery and acquisition | Ignores later influence |
| Last-click | 100% to the final interaction | Conversion and closing analysis | Undervalues discovery |
| Last non-direct | 100% to the last known non-direct source | Return and branded journeys | Ignores assisting touches |
| Linear | Equal credit across all touches | Complete recorded journeys | Assumes equal influence |
| Time decay | More credit to recent touches | Long nurturing journeys | Undervalues early demand |
| Position based | More credit to selected stages | B2B and lead-generation funnels | Uses fixed assumptions |
| Data driven | Credit based on observed patterns | Larger datasets and complex paths | Depends on data quality and scope |
| Custom | Business-defined rules or weights | Specialized lifecycle models | Can formalize weak assumptions |
The comparison shows how each model works, not which one is universally superior. The same company may use different views for discovery, optimization, pipeline, and revenue decisions.
One journey under different attribution models
Consider one recorded path: Meta ad → organic search → Google ad → email → direct visit → purchase. Each model uses the same history but distributes credit differently.
Table 2: How each model assigns credit
| Model | Credit result |
| First-click | Meta ad receives 100% |
| Last-click | Direct visit receives 100% |
| Last non-direct | Email receives 100% |
| Linear | Every interaction receives equal credit |
| Time decay | Email and direct receive more credit |
| Position based | The first and final key interactions receive more credit |
| Data driven | Credit depends on observed conversion patterns |
| Custom | Credit follows the company’s weighting rules |
1. First-click attribution

How it works
First-click attribution gives all credit to the first eligible advertising interaction. In the example journey, the Meta ad receives 100% because it introduced the customer.
Best for
Use it to study initial discovery, new-customer acquisition, awareness campaigns, and the channels creating the first measurable interaction.
Main limitation
It ignores every later touchpoint that educated, nurtured, retargeted, or closed the customer. It is useful as a discovery lens, not a complete account of influence.
2. Last-click attribution

How it works
Last-click attribution gives all credit to the final eligible interaction before conversion. In the example journey, direct receives credit unless the platform excludes direct traffic.
Best for
It works for short journeys, direct-response campaigns, closing-channel analysis, and teams that need a simple reporting baseline.
Main limitation
It can overvalue branded search, retargeting, email, and other late-stage interactions while hiding the advertising that created initial demand.
3. Last non-direct attribution
How it works
Last non-direct attribution ignores a final direct return and gives credit to the most recent known source. In the example journey, email receives 100% rather than direct.
Best for
It helps with repeat sessions, branded journeys, and situations where direct traffic would otherwise overwrite a known acquisition source.
Main limitation
The model still chooses one winner. It protects a known source from direct overwrite but does not recognize the earlier ads and organic interactions that assisted the conversion.
4. Linear attribution

How it works
The linear attribution model divides credit equally across every eligible touchpoint. A five-touch journey gives each interaction 20% of the conversion.
Best for
It is useful for teams beginning with multi-touch reporting and for journeys where no lifecycle milestone is clearly more important than the others.
Main limitation
Equal credit is easy to explain but rarely reflects equal influence. A brief retargeting impression can receive the same credit as the ad that created demand or the email that closed the sale.
5. Time-decay attribution

How it works
Time-decay attribution gives progressively more credit to interactions closer to conversion. Earlier ads still receive value, but recent touches receive a larger share.
Best for
It fits longer sales cycles, nurture campaigns, subscription journeys, and situations where recent interactions are expected to have stronger conversion influence.
Main limitation
The model systematically discounts early demand generation. A high-value awareness campaign can look weaker simply because it occurred farther from the conversion date.

6. Position-based attribution
Position-based models place more credit on selected stages. The model family is popular in lead generation and B2B because teams can emphasize discovery, lead creation, opportunity creation, and conversion.
U-shaped attribution
U-shaped attribution usually emphasizes the first interaction and the lead-conversion touchpoint, with the remaining credit spread across assisting interactions.
W-shaped and Z-shaped attribution
W-shaped models add substantial credit to opportunity creation. Z-shaped models extend the logic to more lifecycle milestones, which can suit longer revenue journeys with several meaningful stage changes.
Main limitation
The weights are business rules rather than causal evidence. They can be useful when the lifecycle is clear, but they may turn assumptions into permanent reporting logic.
7. Data-driven attribution
How it works
Data-driven attribution compares historical converting and non-converting paths to estimate which eligible interactions are associated with conversion. Credit can be fractional and vary by path.
Best for
It is useful for larger datasets, complex advertising journeys, automated bidding, and teams that want to reduce dependence on fixed first-click or last-click assumptions.
Main limitation
The output is bounded by the platform’s available data, identities, channels, and conversion volume. A sophisticated algorithm cannot recover missing touchpoints or disconnected revenue outcomes.
How can AI-powered attribution simplify multi-touch analysis?
AI-driven marketing attribution can reduce the manual work required to compare long paths, channel combinations, conversion stages, and model outputs. It helps analysts move from building reports to investigating the patterns that deserve attention.
AI can group similar journeys, identify recurring assisting sequences, flag sudden changes, and summarize how credit shifts between models. A deeper guide to how multi-touch attribution works provides the measurement foundation that these automated explanations still depend on.
Natural-language interfaces can also answer questions such as which ads assisted high-value deals, which paths produce retained customers, or why a channel gained credit after a model change.
AI should support, not replace, judgment. Missing campaign tags, duplicate conversions, incomplete identities, and disconnected CRM records can produce confident-looking explanations that are not reliable enough for budget decisions.
8. Custom attribution
How it works
A custom attribution model applies company-defined weights, lifecycle milestones, or algorithmic rules. A business might emphasize first contact, qualified lead creation, opportunity creation, and closed revenue differently.
Best for
Custom models fit specialized sales processes, account-based marketing, CRM stages, and businesses with enough historical evidence to justify a tailored weighting system.
Main limitation
Customization can make internal preferences appear more scientific than they are. Teams should document every assumption and compare the custom view with simpler models and experiment results.
How Google Ads applies attribution models
Google Ads now centers model selection on data-driven attribution and last click. Google removed first-click, linear, time-decay, and position-based options from new selectable conversion models, although those approaches remain useful in independent and cross-channel reporting. See Google Ads Help on attribution models.
Data-driven attribution in Google Ads
Google uses eligible account conversion-path data to assign fractional credit across supported interactions. The model can inform automated bidding because credit is distributed beyond the final Google ad click.
Last-click attribution in Google Ads
Last click assigns the conversion to the final eligible Google Ads interaction. It remains simple and transparent but gives little visibility into earlier Google ad assistance.
Why broader models still matter
Independent platforms can compare Google with Meta, LinkedIn, Bing, email, organic search, and CRM outcomes. Teams choosing a Google-specific view can also review the best attribution model for Google Ads before applying the result to wider budget decisions.
Model vs. window vs. scope vs. outcome
Marketers often use these terms interchangeably, even though each setting answers a different question. A report is only comparable when the model, window, scope, and outcome are aligned.
Attribution model
The model controls how credit is distributed among eligible interactions. First-click gives all credit to discovery, while linear distributes it across the recorded path.
Attribution window
The attribution window controls how long a click, impression, or engaged view remains eligible. Short windows emphasize recent influence, while longer windows capture delayed conversions.
Attribution scope
The scope determines which channels, campaigns, placements, and touchpoints are included. A platform-level report may cover only its own advertising inventory, while an independent report can compare paid and organic sources.
Conversion outcome
The outcome is the event receiving credit, such as a form submission, qualified lead, opportunity, purchase, closed revenue, or retained customer. A useful model applied to the wrong outcome can still produce poor decisions.
Click-through vs. view-through attribution
Click-through and view-through attribution describe the eligible ad interaction, not the credit-distribution logic. Either interaction type can be evaluated within a platform model and window.
Click-through attribution
A click receives credit when the user selects the ad and converts within the eligible click window. This is usually stronger evidence of direct engagement than an impression alone.
View-through attribution
A view receives credit when the person sees an ad, does not click it, and later converts. Adjust’s view-through attribution guide explains why impression-based measurement is common in display, video, social, mobile, and connected-TV campaigns.
Engaged-view attribution
Engaged-view attribution is relevant to video advertising where a person watches meaningfully without clicking. It sits between a simple impression and a direct click in the platform’s evidence hierarchy.
Why the distinction matters
View-based credit can materially increase reported campaign contribution. Marketers should compare click and view results separately instead of merging them into one performance number without context.
Attribution windows explained
The lookback window determines how long an interaction remains eligible. Two reports using the same model can still disagree when one uses a one-day view window and another uses a seven-day click window.
Short windows
Short windows emphasize recent response and reduce the chance of crediting distant interactions. They can undercount channels that influence longer consideration journeys.
Long windows
Long windows capture delayed decisions but increase the chance of assigning credit to an interaction with limited influence. The window should reflect the buying cycle rather than a convenient platform default.
Interaction date vs. conversion date
Some reports place conversions on the date of the ad interaction, while others use the conversion date. The totals may match across a long period but disagree sharply by day or week
How ad platforms apply attribution differently
Google, Meta, LinkedIn, Amazon, TikTok, and other platforms use their own identities, eligible interactions, windows, modeled data, and reporting logic. This is why every platform can claim credit for the same conversion.

Google Ads
Google measures eligible interactions within its own advertising inventory. A deeper Google Ads attribution review helps separate Google-reported credit from a wider cross-channel journey.
Meta Ads
Meta can include click-through and view-through influence within its attribution settings. Marketers should interpret Facebook Ads attribution alongside independent conversion and revenue data.
Amazon and closed ecosystems
Commerce platforms can connect ad activity with purchases inside their own environments. This creates strong closed-loop reporting but does not automatically explain touchpoints that occurred outside the platform.
Why totals conflict
Different windows, identities, conversion dates, and eligible interactions create ad platform discrepancies even when every tracking tag is technically working.
Platform attribution vs. independent attribution
Platform attribution
A network evaluates performance through the ads, identities, and conversion signals available inside its own ecosystem. The result is useful for platform optimization but is not a neutral comparison of the full media mix.
Independent attribution
Cross-platform marketing attribution applies a more consistent framework across advertising networks, email, organic search, referrals, direct traffic, and downstream business outcomes.
Independent attribution is not absolute truth. It provides a consistent comparison layer, but the result still depends on tracking coverage, identity resolution, model settings, and the selected conversion outcome.
Which ad attribution model is best?
No model is best for every decision. The useful question is which model matches the business question, data coverage, journey length, and action the team plans to take.
Table 3: Choose a model by business question
| Business question | Useful model |
| Which ads introduce new customers? | First-click |
| Which ads close conversions? | Last-click |
| Which source preceded a direct return? | Last non-direct |
| Which interactions appeared across the journey? | Linear |
| Which recent touches influenced conversion? | Time decay |
| Which funnel stages matter most? | Position based |
| Which interactions contribute based on observed data? | Data driven |
| Which lifecycle stages need custom weights? | Custom |
Factors to consider
Campaign objective and funnel stage
Journey length and number of interactions
Conversion volume and identity coverage
CRM, offline, and revenue integration
Reporting purpose and audience
Model transparency and implementation capacity
Ad attribution models by channel

Paid search
Paid search attribution should distinguish branded and non-branded queries, repeat searches, closing keywords, and automated bidding inputs. Last-click can overvalue branded search when another channel created demand.
Paid social
Paid social often influences discovery through both clicks and impressions. View-through eligibility, retargeting, modeled conversions, and cross-platform overlap require careful interpretation.
Ecommerce advertising
Ecommerce attribution should connect ads with orders, revenue, repeat purchases, products, retention, and LTV rather than treating every purchase as equally valuable.
Mobile advertising
iOS attribution and other mobile measurement approaches must handle installs, deep links, re-engagement, app events, consent, and privacy-aware identity methods.
CTV and video advertising
CTV and video measurement often relies on impressions, engaged views, household exposure, delayed response, and cross-device matching. These journeys require more uncertainty than click-heavy search campaigns.
B2B advertising
B2B models should connect ads with contacts, companies, qualified leads, opportunities, sales activity, and closed revenue. Marketing attribution CRM integration prevents the website form from becoming the final reported outcome.
Attribution models and CRM outcomes
Ad attribution should not stop at the first form submission. The useful lifecycle is ad click → lead → qualified lead → opportunity → customer → revenue.
Ad-spend attribution for CRM systems
A connected system should preserve the original source, campaign history, contact and company identity, opportunity stages, deal value, and closed status. This allows marketing to compare cost per lead with cost per qualified opportunity and revenue.
Revenue attribution
Revenue attribution evaluates campaigns through closed revenue, repeat purchases, expansion, retention, and customer value. It prevents high-volume but low-quality sources from appearing more successful than they are.
How models affect advertising decisions
Changing the attribution model can change reported conversions, fractional credit, CPA, ROAS, keyword performance, campaign rankings, budget recommendations, and automated bidding inputs.
The model changes how recorded credit is distributed. It does not change the historical customer journey, create missing interactions, or prove that the credited campaign caused the outcome.
Attribution vs. incrementality
Attribution asks
Which recorded interactions should receive conversion credit?
Incrementality asks
Did the advertising create additional results that would not otherwise have happened?
Why both are needed
A campaign can appear frequently in converting journeys because it reaches people already likely to buy. Attribution identifies the journey pattern, while experiments test whether the campaign created lift.
Marketing mix modeling can add an aggregate planning layer where user-level tracking is incomplete. Larger budget decisions are stronger when attribution, incrementality, and planning models support one another.
What common mistakes should you avoid with attribution models?
Most failures come from the measurement setup rather than the model name. The following challenges with attribution models should be checked before a team changes budget or declares one channel the winner.

Using one model for every decision: Discovery, conversion, pipeline, and revenue questions may require different views.
Ignoring attribution windows: Two reports can use the same model and disagree because their eligibility windows differ.
Trusting platform totals blindly: Each network measures within its own identities, inventory, and reporting logic.
Stopping at leads: Lead volume does not show qualification, revenue, retention, or lifetime value.
Overvaluing view-through credit: Impression-based evidence should be reviewed separately from direct click engagement.
Letting direct overwrite known sources: Return visits can hide the earlier campaign that introduced or nurtured the customer.
Changing settings without documentation: Historical comparisons become misleading when models or windows change silently.
Treating attribution as causality: Conversion credit does not prove incremental impact.
Using incomplete conversion data: Duplicate events, missing UTMs, and disconnected CRM records weaken every model.
A practical attribution checklist can help teams validate sources, identities, conversions, windows, and business outcomes before relying on model results.
See what's working. Fix what's not. Grow faster.
How Usermaven supports ad attribution
Usermaven acts as an independent attribution layer that connects paid advertising with organic acquisition, website behavior, product activity, customer journeys, CRM outcomes, revenue, and retention.
Cross-channel source and campaign tracking
Usermaven applies consistent source and campaign definitions across Google, Meta, LinkedIn, Bing, email, referrals, organic search, and direct traffic. This gives teams a neutral comparison beyond each ad platform’s self-reported totals.

First-touch, last-touch, and multi-touch views
Attribution reporting shows how discovery, closing, and assisting touchpoints connect to the same customer and conversion data, without piecing together separate spreadsheets.
Complete customer journeys
User journeys preserve the sequence of sources, pages, return visits, product events, and conversions. Marketers can inspect the path behind a model result rather than viewing credit in isolation.
Website and product behavior
Website analytics explains landing-page and content behavior, while product analytics connects acquisition with activation, adoption, upgrades, and retention.
CRM, pipeline, and revenue attribution
Campaigns can be evaluated through qualified opportunities, deal values, closed revenue, retention, and customer quality. This gives paid-media teams a stronger outcome than clicks or form submissions alone.
Conversion synchronization
Conversion syncs return verified first-party outcomes to ad platforms so bidding can optimize toward qualified leads, purchases, customers, or other meaningful events.
AI-assisted analysis
Maven AI helps teams query connected journeys, attribution paths, campaigns, and outcomes in natural language. The result supports faster investigation without replacing data validation or strategic judgment.
Final verdict
An ad attribution model controls how conversion credit is divided, but the model is only one part of the measurement setup. Reliable decisions also depend on windows, platform scope, identity coverage, conversion definitions, CRM integration, and data quality.
First-click explains discovery, last-click explains closing, rule-based multi-touch models show the recorded path, and data-driven models estimate contribution from observed patterns. Comparing several views is usually more useful than forcing every decision into one model.
Ready to see Usermaven in action? Explore the platform or book a demo for a closer look.
See Usermaven in action
Book a free demo and discover how powerful analytics can grow your business.
FAQs
1. What is an ad attribution model?
An ad attribution model is the rule or method used to assign conversion credit among eligible advertising interactions. It determines whether credit goes to one touchpoint, several touchpoints, or an algorithmically estimated combination.
2. What are the main types of ad attribution models?
The main types are single-touch models, rule-based multi-touch models, and algorithmic models. Common examples include first-click, last-click, last non-direct, linear, time decay, position based, data driven, and custom attribution.
3. Which attribution model is best for advertising?
No model is best for every purpose. First-click supports discovery analysis, last-click supports closing analysis, multi-touch models explain recorded journeys, and data-driven models estimate contribution when enough reliable data is available.
4. What attribution models are available in Google Ads?
Google Ads primarily centers model selection on data-driven attribution and last click. First-click, linear, time-decay, and position-based models remain useful in independent cross-channel attribution platforms.
5. What is the difference between first-click and last-click attribution?
First-click gives all credit to the interaction that introduced the customer. Last-click gives all credit to the final eligible interaction before conversion.
6. What is multi-touch ad attribution?
Multi-touch attribution distributes credit across several interactions in the recorded customer journey. Linear, time-decay, position-based, and data-driven models are common multi-touch approaches.
Updated

Written by
Junaid Ahmed
Content Writer & Digital Marketer
Junaid Ahmed is a content and copywriter with 3+ years of experience creating research-driven content across SaaS, B2B, ecommerce, and digital marketing. He specializes in turning complex topics into clear, practical content that helps marketers better understand their challenges, evaluate solutions, and make informed decisions. His work spans educational content, industry insights, and actionable marketing guides.
All articles by Junaid →