What is web analytics? How it works, metrics & tools
Feb 12, 2026
7 mins read
Written by Imrana Essa

Your website gets traffic. But do you really know what visitors are doing once they arrive?
Are they scrolling? Clicking? Dropping off halfway through checkout?
That’s where web analytics comes in.
Web analytics is the process of collecting, measuring, and analyzing website data to understand user behavior and improve performance. It helps you see what’s working, what’s not, and where revenue opportunities are hiding.
In this article, we’ll break down what web analytics is, why it matters, and how to use website analytics data to make smarter business decisions.
What is web analytics?
Web analytics in digital marketing is the process of collecting, measuring, analyzing, and reporting website data to understand how users interact with a website. It helps businesses track visitor behavior, traffic sources, engagement levels, and conversions so they can improve performance and make informed decisions.
In simple terms, web analytics shows you:
- Who is visiting your website
- Where visitors come from
- Which pages they view
- What actions do they take
- Where they leave
Every interaction on your site creates website analytics data. This includes pageviews, clicks, scroll depth, form submissions, purchases, and session duration. That data is collected through tracking scripts and transformed into reports that reveal patterns in user behavior.
For example, an ecommerce store can use web analytics to identify which products receive the most attention, which campaigns and different marketing initiatives drive the highest conversions, and where customers abandon checkout. A SaaS company can analyze onboarding flows to understand what increases activation and retention while also measuring how different marketing initiatives influence user behavior and subscription growth.
Importance of web analytics
Here are the key benefits of using web analytics:
- Better decision-making: You make choices based on real data instead of assumptions.
- Improved user experience: You can identify friction points and optimize navigation, design, and content.
- Higher conversion rates: Website analytics shows which pages and campaigns drive results.
- Smarter marketing investment: You can focus on traffic sources that generate leads and revenue.
- Stronger customer retention: Understanding behavior patterns helps reduce churn and improve lifetime value.
Website analytics tool for modern marketers & agencies
*No credit card required
How do web analytics tools work?
Most web analytics platforms follow a structured process.
1. Tracking setup
The process starts when you install a tracking code on your website. This is usually a small JavaScript snippet placed in the header of your pages or added through a tag manager.
Once installed, the tracking code loads every time someone visits your site. It begins monitoring user interactions in real time. Without this step, no website analytics data can be collected.
2. Data collection
After the tracking code is installed, the web analytics tool begins recording user activity. In addition to on-site interactions, many businesses also analyze conversations handled by tools like an AI call assistant, which can capture customer intent, call outcomes, and lead qualification insights that complement website analytics data.
Most website analytics tools collect data in two ways:
Client-side tracking: A script runs in the visitor’s browser and records actions such as page views, clicks, form submissions, and purchases.
Server-side tracking: User actions are first sent to your server and then forwarded to the analytics platform. This improves accuracy and reduces data loss.
During data collection, the tool captures details like:
- Device and browser
- Traffic source
- Session duration
- Location
3. Visitor identification and session tracking
To make sense of raw activity, the tool needs to group actions into sessions and users.
Web analytics tools typically use first-party cookies or unique identifiers to:
- Distinguish new visitors from returning users
- Track how long a session lasts
- Understand how users navigate between pages
- Attribute actions to specific traffic sources
Campaign performance is tracked using UTM parameters.
Modern web analytics also relies on event tracking to measure meaningful actions such as button clicks, product views, and checkout steps.
This step allows businesses to analyze user journeys instead of isolated clicks.
4. Data processing and validation
Raw data often contains noise. Web analytics platforms process and clean the data before it appears in reports.
During this stage, the system may:
- Filter out bot traffic
- Remove duplicate events
- Normalize event names
- Attribute conversions to the correct channel
- Organize actions into funnels
Processing ensures that reported metrics are accurate.
5. Data aggregation and metric calculation
Once cleaned, the data is stored and aggregated into measurable metrics. The system calculates:
- Total users and sessions
- Traffic sources
- Engagement metrics
- Conversion rates
- Funnel drop-off percentages
- Campaign performance
Instead of looking at thousands of individual clicks, businesses see structured website analytics reports.
6. Reporting and insights
Finally, the analytics tool presents the processed data in dashboards, charts, and visual reports. These dashboards help teams:
- Compare performance across time periods
- Identify high-performing pages
- Detect sudden traffic changes
- Spot funnel bottlenecks
Advanced web analytics tools may also provide automated insights that highlight unusual patterns or growth opportunities.
Types of web analytics
Web analytics is not limited to tracking traffic. It can be divided into different types based on how data is used.
There are four main types of web analytics.
1. Descriptive analytics
Descriptive analytics answers the question: What happened?
It focuses on historical data such as:
- Total visitors
- Page views
- Conversion rate
- Traffic sources
This type of website analytics helps you understand overall performance.
2. Diagnostic analytics
Diagnostic analytics answers: Why did it happen?
It looks deeper into user behavior to identify causes behind changes in traffic, engagement, or conversions. For example, a sudden drop in conversions may be linked to a broken checkout page or a campaign change.
3. Predictive analytics
Predictive analytics answers: What is likely to happen next?
It uses historical web analytics data and patterns to forecast future trends, such as expected traffic growth or customer churn.
4. Prescriptive analytics
Prescriptive analytics answers: What should you do about it?
It suggests actions based on data insights. For example, if funnel analysis shows high drop-off at checkout, prescriptive insights may recommend simplifying the form.
Together, these types of web analytics help online businesses move from basic reporting to strategic decision-making.
If you want a deeper comparison, read our guide on predictive analytics vs prescriptive analytics to understand how both approaches support smarter decisions.
The most important web analytics metrics
To use web analytics effectively, you need to focus on the right metrics. These website analytics metrics help you measure traffic, engagement, and conversions.
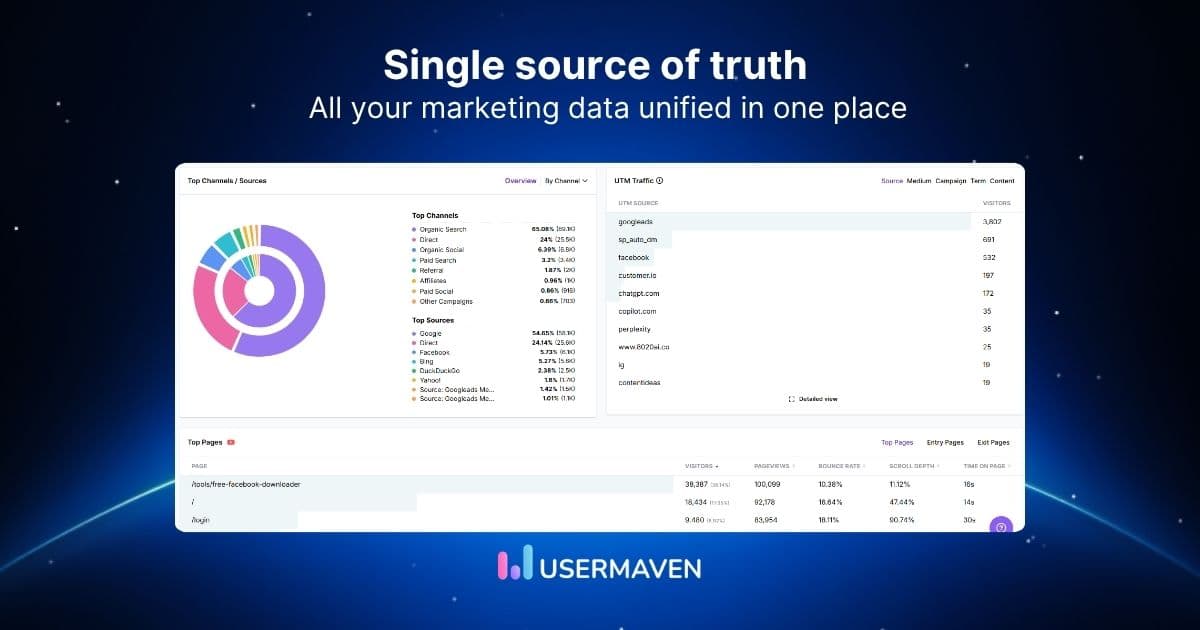
Traffic metrics
These show how many people visit your website and where they come from.
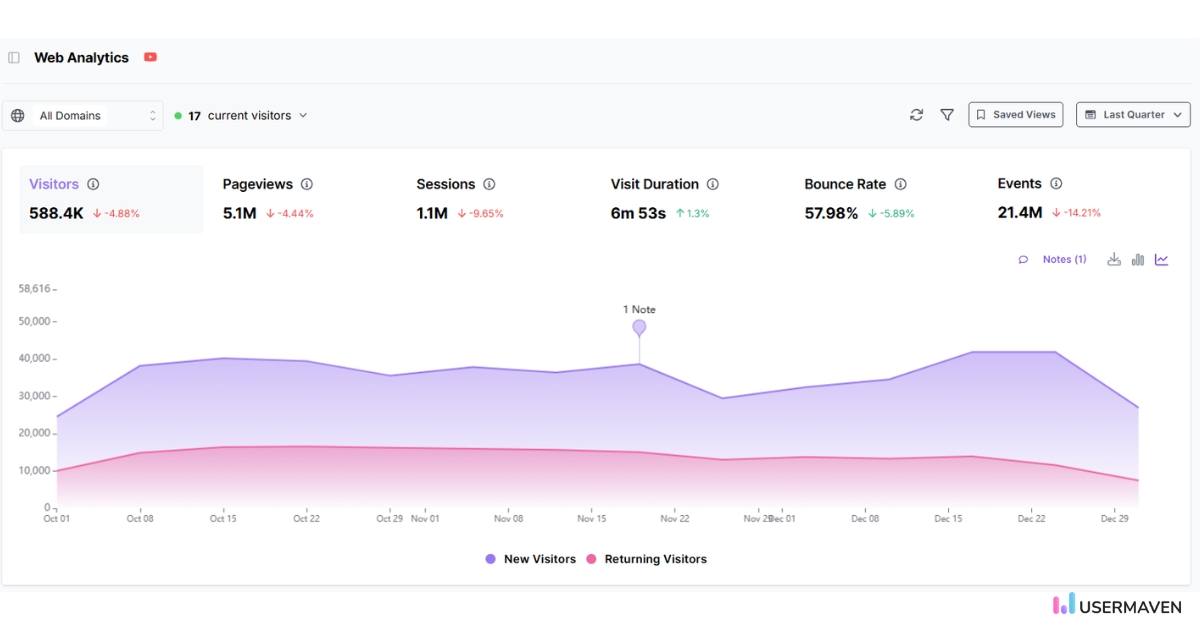
- Users and sessions
- New vs returning visitors
- Traffic sources
- Device and location data
Traffic metrics help you understand audience reach and acquisition channels.
Engagement metrics
These measures show how visitors interact with your content.
- Page views
- Time on page
- Engagement rate
- Bounce rate
- Scroll depth
Engagement metrics reveal whether your content holds attention.
Conversion metrics
These track how well your website turns visitors into leads or customers.
- Conversion rate
- Goal completions
- Revenue
- Cost per acquisition
Conversion metrics show how effectively your website supports business goals.
Funnel metrics
Funnel analysis helps you understand the customer journey.
- Step completion rate
- Drop-off rate
- Funnel conversion rate
These metrics highlight bottlenecks in the buying or signup process.
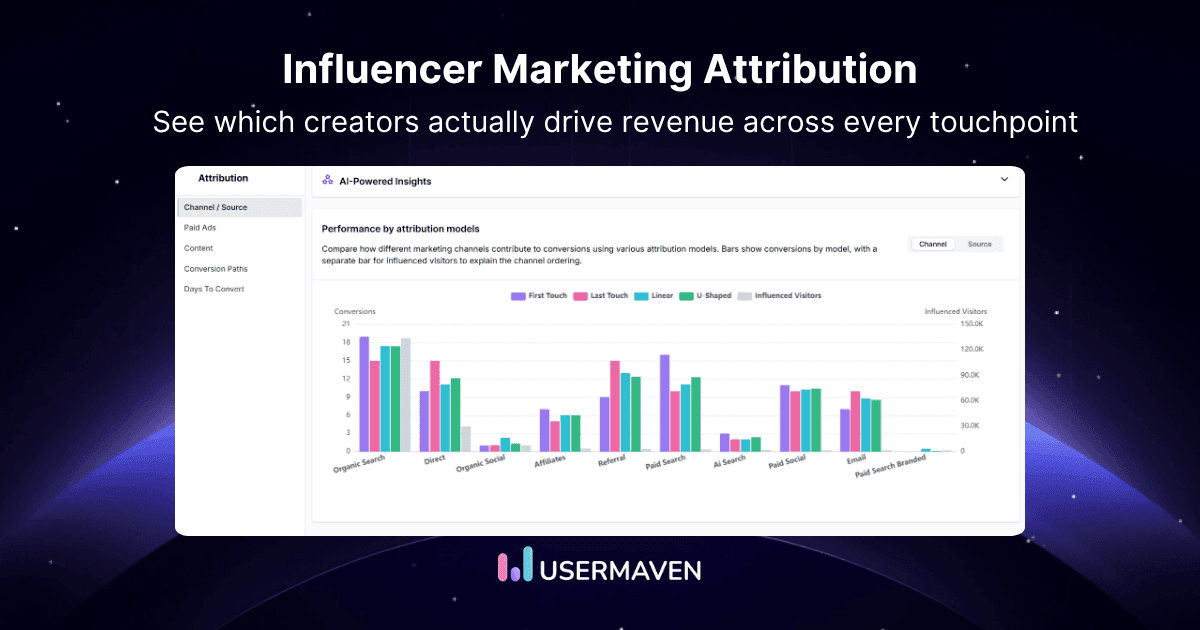
Attribution metrics
Attribution metrics measure marketing performance.
- Channel performance
- Campaign conversions
- Assisted conversions
They help you identify which marketing efforts drive the most value.
When analyzing these web analytics reports, it is important to interpret the data clearly. For example, you may compare traffic sources to see which channel drives more engaged users, or contrast funnel steps to identify where drop-offs increase. Using compare and contrast transition words in your reporting helps explain similarities and differences between metrics, making your analysis easier to understand and more actionable.
Web analytics examples
Understanding web analytics becomes clearer when you see real data in action.
Below are practical examples that show how website analytics insights lead to measurable improvements.
1. Ecommerce conversion optimization
An online store notices strong traffic but low sales. Funnel analysis reveals a major drop-off between “Add to Cart” and “Checkout Completion.”
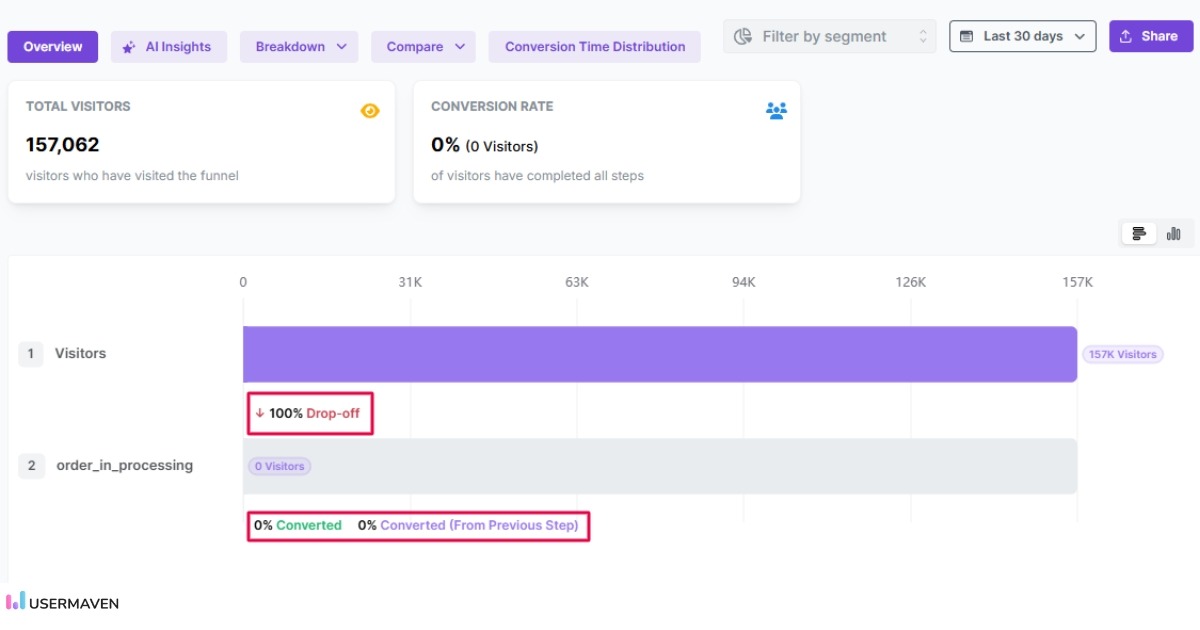
The data highlights exactly where users leave. After simplifying the checkout form and reducing required fields, the store sees an improvement in conversion rate.
For instance, imagine you used an online store builder to start an e-commerce business. This example shows how web analytics identifies friction points that directly impact revenue.
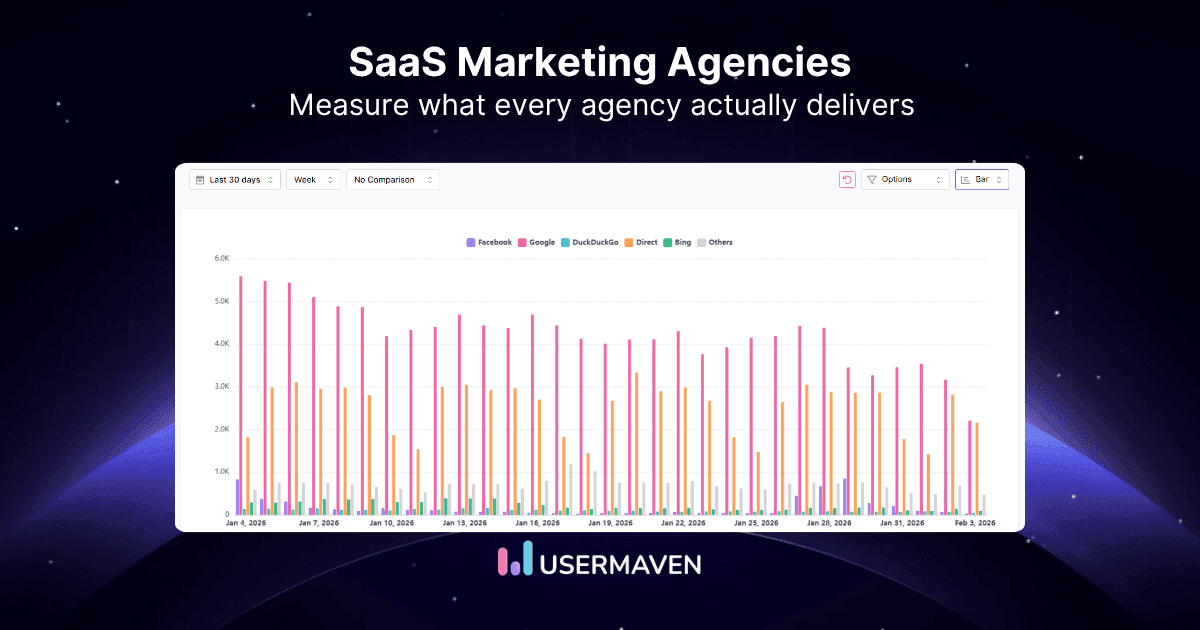
2. Marketing campaign performance
A company runs campaigns across search, paid ads, social media, and email. Website analytics reveals that Organic Search drives 76.04% of total traffic, while Direct traffic contributes 15.93%.
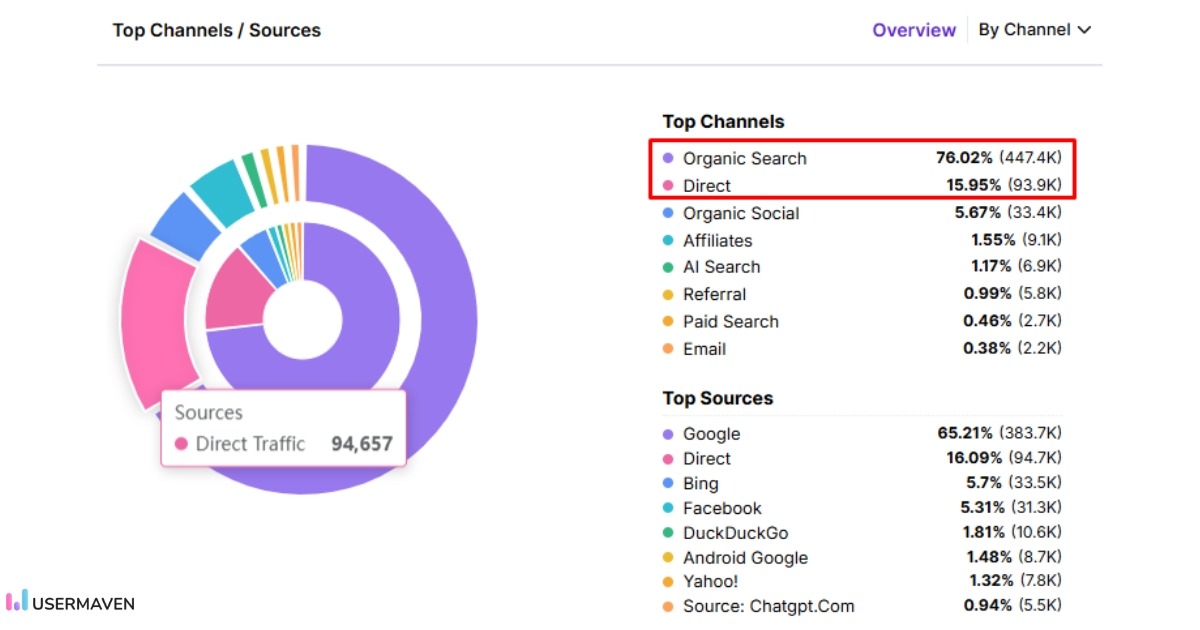
This comparison shows that organic search is the primary traffic driver, contributing nearly five times more visits than direct traffic. The team analyzes SEO performance further and decides to invest more in content optimization and search visibility.
At the same time, they explore ways to strengthen direct traffic through brand campaigns and email marketing.
By comparing traffic sources inside the analytics dashboard, the team allocates resources based on actual performance data rather than assumptions.
3. Content performance analysis
A content-driven website tracks engagement metrics across articles. Data reveals that specific blog posts generate longer session durations and higher assisted conversions.
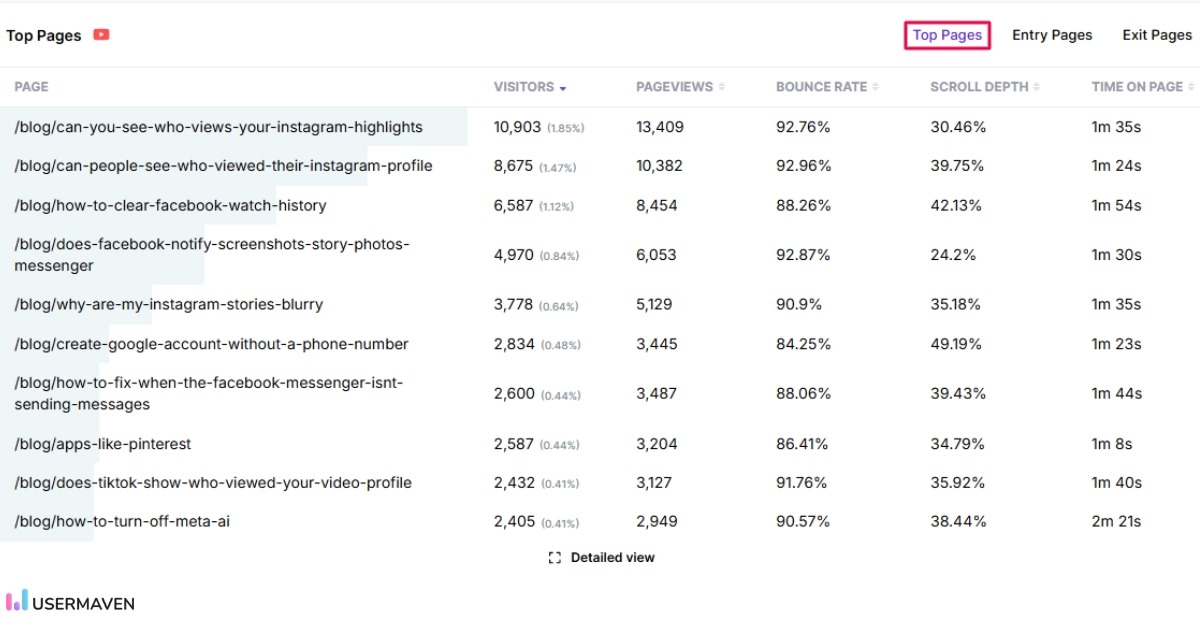
The team identifies patterns in high-performing content and creates similar articles. Over time, this strategy increases organic traffic and lead generation.
Website analytics helps turn content performance into scalable growth.
4. User journey analysis
A SaaS company analyzes user flow reports and finds that users who complete onboarding within 24 hours are more likely to subscribe.
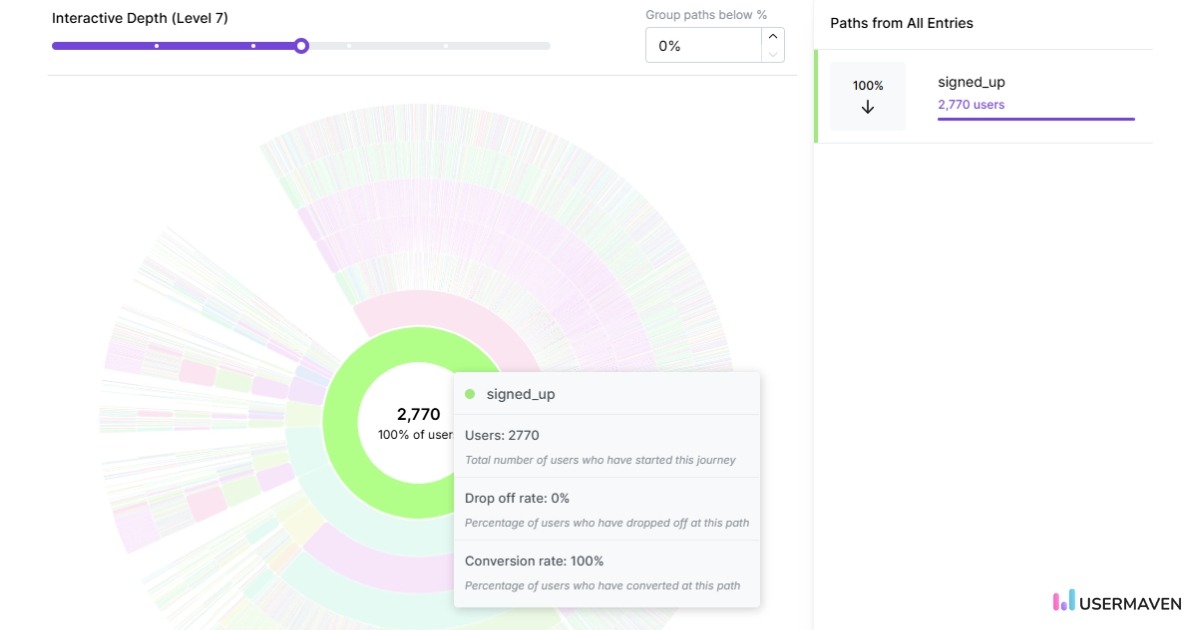
By optimizing onboarding steps and reducing friction, activation rates improve. This leads to higher retention and increased recurring revenue.
Web analytics connects user behavior to long-term business outcomes.
Wondering whether to build or buy analytics for your business? Read our detailed guide on build vs buy analytics to understand the pros, costs, and long-term implications of each approach.
Choosing the right web analytics tool
Not all web analytics tools offer the same features. The right choice depends on your business goals, technical needs, and reporting requirements.
When evaluating a website analytics tool, consider the following:
- Ease of implementation: The tool should be simple to install and configure. Clear documentation and flexible tracking options reduce setup time and errors.
- Event and funnel tracking: Look for strong event tracking and funnel analysis capabilities. These features help you understand user behavior beyond basic page views.
- Attribution and campaign tracking: A good web analytics platform should support accurate attribution models and detailed campaign tracking through UTM parameters.
- Real-time reporting: Access to real-time data allows you to monitor traffic changes, campaign launches, and performance issues quickly.
- Privacy and compliance: With growing data privacy regulations, the tool should support first-party data tracking and comply with standards such as GDPR.
- Actionable insights: Modern analytics tools go beyond reporting. They highlight drop-off points, unusual patterns, and optimization opportunities.
- User-friendly interface: An intuitive dashboard makes it easy for both beginners and experts to access and interpret data, reducing the learning curve and enabling faster decisions. If you need to present performance insights to stakeholders or clients, using an interactive pitch deck tool can help you share web analytics results in a clear and professional format.
Why Usermaven is a complete web analytics solution
Usermaven is built to provide detailed web analytics without unnecessary complexity. It combines simplicity with advanced capabilities that many standalone tools lack.
With Usermaven, you get:
- Event-based tracking with no complicated setup
- Advanced funnel analysis to identify drop-offs clearly
- Multi-touch attribution to understand the true impact of every marketing channel
- Customer journey tracking across sessions
- Real-time reporting with structured dashboards
- Privacy-focused, first-party data tracking
Unlike traditional analytics tools that focus heavily on page views, Usermaven is designed to connect traffic, user behavior, and revenue in one unified view.
Its advanced multi-touch attribution model helps you understand how different channels contribute to conversions instead of over-crediting a single source. This gives marketing teams clearer insight into performance and budget allocation.
At the same time, the interface remains simple and intuitive, making it accessible for both growing teams and advanced marketing departments.
Website analytics tool for modern marketers & agencies
*No credit card required
In summary,
Web analytics helps you understand how visitors interact with your website, measure performance, and improve conversions. From tracking user behavior to analyzing funnels and marketing campaigns, it turns website data into actionable insights. When used effectively, web analytics becomes a powerful driver of smarter business decisions.
Usermaven brings all of these capabilities together in one reliable website analytics tool. With built-in event tracking, funnels, and marketing attribution, it helps you move beyond surface-level traffic reports and focus on meaningful growth opportunities.
Want clearer insights and better decisions from your data?
Sign up now or book a demo and see why Usermaven is the most reliable website analytics tool for modern businesses.
FAQs
1. What tools are used for web analytics?
Common web analytics tools include Usermaven, Google Analytics, Adobe Analytics, and Matomo, along with other privacy-focused platforms that offer event tracking and funnel analysis. The right tool depends on your reporting needs, data privacy requirements, and the level of analysis your business requires.
2. Is web analytics only for large businesses?
No. Web analytics is useful for businesses of all sizes. Small businesses use it to track traffic and conversions, while larger companies use advanced analytics for attribution, customer journey tracking, and forecasting.
3. How long does it take to see meaningful results from web analytics?
You can start seeing patterns within a few weeks if your website has consistent traffic. However, deeper insights such as seasonal trends or campaign performance may require several months of data.
4. How can web analytics help improve my website’s SEO?
Web analytics can help improve SEO by:
• Showing which keywords are driving traffic to your site through the keyword rank checker.
• Identifying which pages have high bounce rates (potentially indicating poor content or user experience)
• Revealing which content is most engaging to visitors
• Tracking the performance of your backlinks
• Monitoring your site’s loading speed
5. Can web analytics track individual users?
Web analytics tools can track user sessions and journeys, but this is typically done using anonymous identifiers or first-party cookies. Most platforms follow privacy regulations and require consent where necessary.
6. Why is web analytics important for SEO?
Web analytics helps monitor organic traffic, user engagement, and page performance. It allows businesses to identify high-performing content, improve low-engagement pages, and measure the impact of SEO efforts over time.
7. What are the limitations of standalone web analytics tools?
Standalone web analytics tools provide valuable data, but they have certain limitations.
They may struggle with incomplete user tracking if visitors block cookies or switch devices. Some platforms use data sampling when traffic volume is high, which can reduce report accuracy.
Cross-device tracking can be limited without advanced identity resolution, leading to gaps in customer journey analysis. Attribution models may also over-credit certain channels such as organic search or direct traffic.
Try for free
Grow your business faster with:
- AI-powered analytics & attribution
- No-code event tracking
- Privacy-friendly setup