A visitor who leaves after five seconds tells you something very different from one who stays for five minutes.
Average time on page is the average time visitors spend on a single page before moving on. It’s one of the simplest ways to see whether a page holds attention.

To increase it, match the page to the search intent, answer the question early, make the page fast and easy to read, and give visitors a clear next step.
Below, you’ll learn how GA4 measures it, what a good time on page is and 11 ways to increase it, plus the digital marketing metrics and KPIs to read alongside it.
Key takeaways
- What it is: Average time on page is the average time visitors spend on one page. Average session duration covers the whole visit.
- GA4 changed the metric: GA4 replaced Universal Analytics’ average time on page with average engagement time, which only counts time when the page is in focus in the browser.
- “Good” depends on the page: Compare time on page with how long the page takes to read. People read non-fiction at about 238 words per minute on average.
- Fix the basics first: Search intent, an answer-first intro, fast loading, readable formatting and fewer interruptions do more than any trick.
- Never read it alone: Pair time on page with scroll depth, bounce rate, exit rate and conversions to know whether a long visit is a good or a bad sign.
What is time on page?
Time on page is the amount of time a visitor spends on one specific page of your website. Analytics tools usually measure it from the moment the page loads until the visitor goes to another page, closes the tab or switches away.
It’s a quick signal of interest. If people spend a few minutes on a long guide, the content is probably doing its job. If they leave a 2,000-word article after eight seconds, something isn’t working.
Time on page doesn’t tell the whole story, though. Some visitors find what they need in seconds and leave happy, for example on a contact page. That’s why it works best next to other metrics like scroll depth and conversions.
What is average time on page?
Average time on page is the average time all visitors spend on a page during a given period. A higher number usually means people are reading, watching or interacting. A lower number can mean the page doesn’t match what they expected, or that they found their answer fast.
How average time on page is calculated
Universal Analytics (old): Average time on page = total time on page ÷ (pageviews − exits)
GA4 (now): Average engagement time = total user engagement duration ÷ number of active users
Universal Analytics left exits out because it couldn’t time the last page of a visit. GA4 measures engaged time instead, including on the last page.
Always read the number in context. A blog post should hold people longer than a pricing page, and a pricing page longer than a thank-you page. Compare a page with its own past results, or with pages of the same type.
Average time on page vs. average session duration
These two metrics are easy to mix up. Average time on page looks at one page. Average session duration looks at the whole visit, across every page a person views.
| Average time on page | Average session duration | |
|---|---|---|
| What it measures | Time spent on one page | Time spent across all pages in one visit |
| Scope | Page level | Session (visit) level |
| Best for | Judging a single article, landing page or product page | Judging how engaging the whole site or a traffic source is |
| Common question it answers | Is this page holding attention? | Do visitors explore the site or leave quickly? |
| GA4 equivalent | Average engagement time in the Pages and screens report | Average engagement time per session |
If you want to understand visits in more depth, look at user behavior as a whole: how many pages people view, where they enter and where they leave.
Average time on page in GA4: what changed
Universal Analytics stopped processing data on July 1, 2023, and its average time on page metric went with it. GA4 uses engagement time instead.
According to Google’s help documentation on user engagement in GA4, engagement time is the time someone spends with your web page in focus or your app screen in the foreground. If a visitor opens your article in a background tab and never looks at it, that time doesn’t count.
Here’s what that means in practice:
- Average engagement time is total engagement time divided by the number of active users.
- An engaged session is a session that lasts longer than 10 seconds, has a key event, or has two or more page or screen views.
- Engagement rate is the percentage of sessions that were engaged. GA4’s bounce rate is simply the opposite: the share of sessions that weren’t engaged.
- The last page counts: Universal Analytics recorded zero seconds for the last page of a visit. GA4 sends engagement time when the visitor leaves, so single-page visits now show real time.
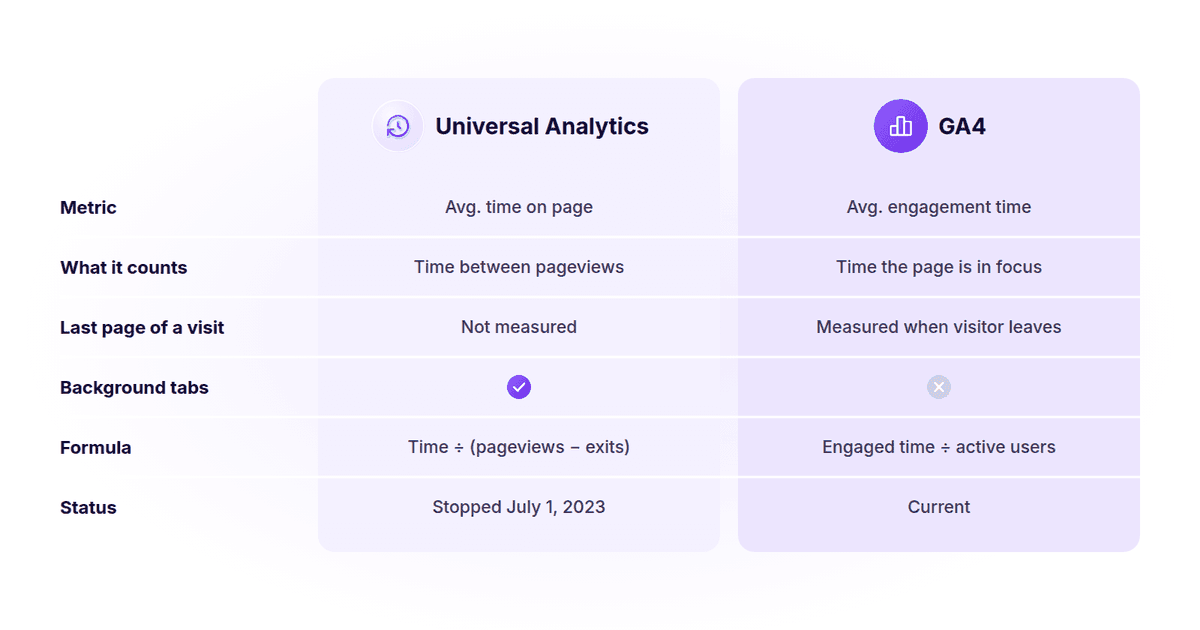
Because the two tools measure time differently, don’t compare an old Universal Analytics number with a GA4 number. Start a fresh baseline in GA4 or in your current analytics tool.
What is a good average time on page?
There’s no single number that’s good for every page. A 40-second average is great for a short product update and poor for a 3,000-word guide. The most useful benchmark is how long the page takes to read.
A 2019 meta-analysis of 190 reading studies by psychologist Marc Brysbaert found that adults read non-fiction silently at about 238 words per minute on average. So a 1,200-word article takes around five minutes to read in full. If your average engaged time on that page is one minute, most visitors are skimming or leaving early.
| Page type | What “good” usually looks like | What to check if it’s low |
|---|---|---|
| Blog post or guide | A meaningful share of the estimated reading time | Does the intro match the search query? Is the answer near the top? |
| Landing page | Long enough to read the offer and reach the call to action | Is the headline clear? Does the page load fast? |
| Product or feature page | Enough time to scan features, screenshots or a demo video | Are the benefits clear? Is there a next step? |
| Pricing page | Time to compare plans, without getting stuck | Is the plan comparison easy to understand? |
| Contact or thank-you page | Short, because the job is quick | Low time is usually fine here |
Use your own data as the main benchmark. Track each page against its past performance, and look at important website metrics like scroll depth and conversions alongside it.
Why average time on page matters
Average time on page gives you a quick read on how people respond to your content. Here’s why it’s worth tracking:
- It shows content relevance: Pages with in-depth tutorials, guides or comparisons usually hold people longer. A long average suggests the content matches what visitors came for.
- It hints at satisfaction: Engaged visitors are more likely to enjoy the content and the overall user experience. That builds trust in your brand.
- It helps reduce bounces: Longer time on page usually goes with lower bounce rates. Interactive elements like calculators, quizzes and videos often keep people around.
- It supports SEO indirectly: Google has said it doesn’t use your Google Analytics data to rank pages, so time on page isn’t a direct ranking factor. But pages that genuinely help people tend to earn better results, links and shares over time.
- It creates more conversion opportunities: The longer someone engages, the more chances they have to see a case study, sign up or request a demo.
Website analytics tool for modern marketers & agencies
11 ways to increase average time on page
The goal isn’t to keep people on a page for the sake of it. It’s to give them value, so they want to keep reading and exploring. Start with the tips that fix the biggest problems on your highest-traffic pages.
1. Match the search intent and answer first
If a visitor lands on your page and can’t find what they searched for in the first few lines, they leave. Check the queries that bring people to the page in Google Search Console, then make sure the title, intro and first heading answer that exact question. Once the answer is clear, people are far more willing to keep reading for the details.
2. Prioritize mobile-friendly design
Statistics revealed that in the second quarter of 2023, around 95.8% of global internet users went online with a mobile phone. If your page is hard to read on a small screen, many visitors won’t stay long.
Use a responsive layout, readable font sizes and buttons that are easy to tap. Keep tables and images from breaking the layout on mobile. Test your key pages on a real phone, not just a resized desktop browser.
3. Minimize intrusive pop-ups
According to a survey, 82% of the respondents hate pop-ups. However, 27% say they are open to sharing their email address in pop-ups if websites:
- Use reasonable frequency and capping settings
- Include a convincing incentive (like a discount, chance to win something, or exclusive offers)
- Choose an engaging design
- Use visuals
Pop-ups that block the content the moment a page loads push people away. Show them later, on exit intent or after someone scrolls, or place the offer inside the content instead.
4. Integrate engaging video content
Videos can explain things that text and images can’t, like a product walkthrough or a quick tutorial. Visitors who start a relevant video often stay on the page until it ends.
Place videos where they support the text, keep them short and add a clear title so people know what they’ll get. If you embed YouTube videos, you can track YouTube video engagement in Usermaven to see who actually watches them.
5. Focus on content readability
When content is clear and easy to digest, people engage with it longer. Use readable fonts, short paragraphs, descriptive subheadings and bullet points. Apart from these elements, paraphrasing complex sentences into simple, relatable terms makes it easier for your audience to engage with the content.
A short table of contents on long guides also helps. It shows visitors that the page covers what they need and lets them jump straight to the right section.
6. Optimize your website’s performance
Slow pages lose visitors before they even start reading. Faster load times create a smoother experience and reduce the chance that people bounce out of frustration.
Google’s Core Web Vitals are a good checklist: Largest Contentful Paint (loading), Interaction to Next Paint (responsiveness, which replaced First Input Delay in March 2024) and Cumulative Layout Shift (visual stability). Compress images, lazy-load media below the fold and limit heavy third-party scripts.
7. Minimize ad presence
Too many ads make a page feel cluttered and distract from the content. Visitors who aren’t fighting through banners and autoplay videos are more likely to keep reading.
If ads are part of your business model, keep them away from the opening paragraphs and avoid placements that shift the layout while people read.
8. Take advantage of social media
Sharing your content on social platforms brings in visitors who are already interested in the topic. Those visitors tend to engage more than people who land on a page by accident.
On the page itself, social proof such as comments, quotes or embedded posts can add context and keep people reading. Just don’t let feeds and share widgets slow the page down.
9. Open external links in a new tab
When links to other websites open in a new tab, visitors can check a source without losing their place in your content. That keeps your page open and makes it easier for them to come back and finish reading.
Use this for external references, not for every link. Opening internal links in new tabs can clutter the browser, so test what works best for your audience.
10. Use internal linking strategically
Internal links guide visitors to related content on your site. A well-placed link to a deeper guide or a practical example keeps people exploring instead of going back to Google.
Link with descriptive anchor text so visitors know where they’re going, and place links where the next question naturally comes up. Mapping the customer journey helps you decide which page should come next.
11. Add a chatbot to your site
Chatbots answer questions in real time and point visitors to the right content. When people get help without leaving the page, they tend to stay longer.
Chatbots also make the experience feel more personal by recommending content or helping with specific tasks. Using WhatsApp AI alongside these web tools gives visitors a support channel that keeps the conversation going across devices and sessions.
Related: Enhancing customer service with AI chatbots
How to increase time on site, not just one page
Time on page and time on site are connected, but they’re not the same. Someone can spend two minutes on one article and leave, or spend 30 seconds on each of five pages. To keep visitors on your site longer:
- Find your weak entry and exit pages: Check which pages people land on and where they leave. This guide to landing and exit pages explains how to read them.
- Add a clear next step to every page: End each article with a related guide, a product page or a demo, not a dead end.
- Group related content: Topic hubs and series make it natural to read one page after another.
- Make navigation and search easy: If visitors can’t find the next thing they need, they go back to search results.
How to track time on page
You can track time on page in most website analytics tools. In GA4, go to Reports > Engagement > Pages and screens and look at the average engagement time column for each page.
Time on page is just one part of behavior data tracking. Whatever tool you use, read it together with scroll depth. The combination tells you what’s really happening on the page:
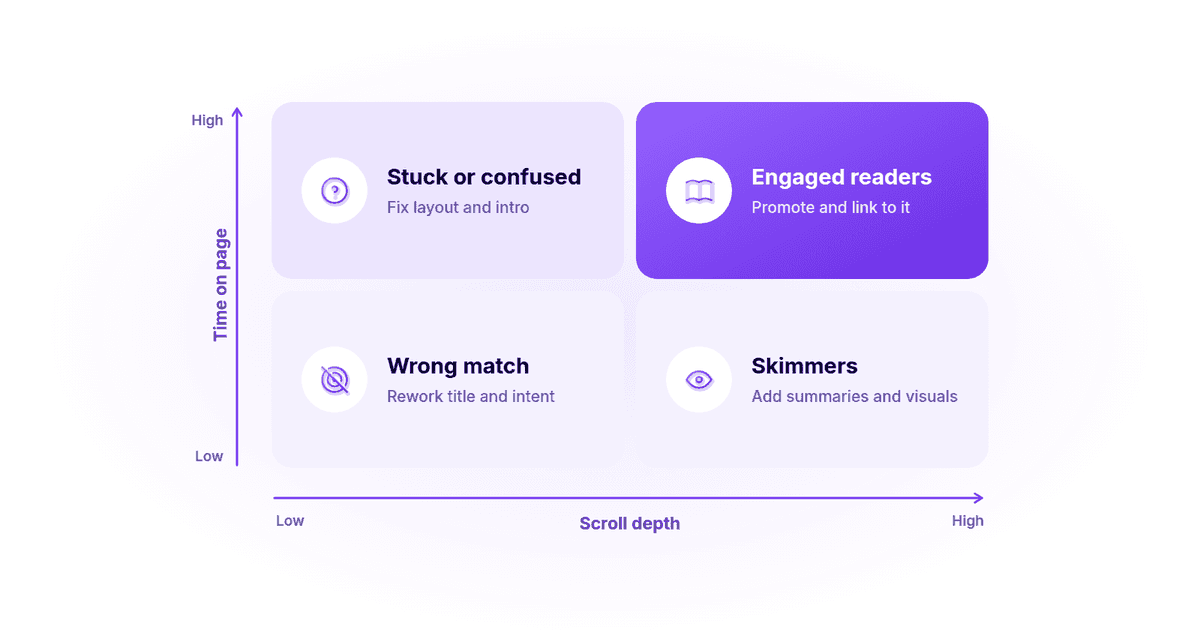
- Long time, deep scroll: People are reading. Promote this page and link to it from related content.
- Long time, shallow scroll: People may be stuck or confused. Check the layout, the intro and anything that blocks the content.
- Short time, deep scroll: People are skimming. Add a summary, clearer subheadings and visuals.
- Short time, shallow scroll: The page doesn’t match what people expected. Rework the title, intro and search intent.
Track time on page with Usermaven
Usermaven shows time on page for every page in its website analytics dashboard, right next to visitors, pageviews, bounce rate and scroll depth. You can switch between top pages, entry pages and exit pages to see where visitors engage and where they drop off.
You can also track conversion goals, such as button clicks, link clicks and form submissions, to see whether engaged visitors actually take action. It’s a privacy-friendly web analytics tool, so you get page-level engagement data without relying on third-party cookies.
See Usermaven in action
Book a free demo and discover how powerful analytics can grow your business.
Conclusion
Average time on page is one of the simplest ways to see whether a page holds attention. In GA4 it’s now measured as engagement time, so focus on how long people actively spend with your content and compare each page with its own past results.
Start with the pages that get the most traffic. Match the search intent, answer the question early, make the page fast and easy to read, and give visitors a clear next step. With performance attribution software such as Usermaven, teams can connect engagement metrics, conversion goals and page-level behavior to understand what works and build a website that keeps visitors coming back.
FAQs
What is a good time on page?
It depends on the page. For articles, compare it with the reading time: adults read non-fiction at about 238 words per minute, so a 1,200-word post takes around five minutes. For landing pages, a good time is long enough to read the offer and reach the call to action. Track each page against its own past results.
Does time on page affect SEO?
Not directly. Google has said it doesn’t use Google Analytics data to rank pages, and time on page isn’t a confirmed ranking factor. Still, pages that answer the search query well tend to hold visitors longer and perform better in search over time, so improving time on page usually goes hand in hand with better content.
Why is the average session duration less than average time on page?
In Universal Analytics, average session duration included bounced sessions, which counted as zero seconds, while average time on page excluded exits from its calculation. That made session duration look lower. GA4 measures engaged time for both, so the gap is usually smaller.
How is average time on page calculated in GA4?
GA4 doesn’t have a metric called average time on page. It uses average engagement time, which is total engagement time divided by the number of active users. In the Pages and screens report, you can see it for each page. Engagement time only counts when the page is in focus in the browser.
How do I increase time on site?
Give every page a clear next step, such as a related guide, a product page or a demo. Use internal links with descriptive anchors, group related content into topic hubs, and make navigation and search easy. Then check your exit pages to find where visitors leave and fix those first.
What is the difference between time on page and dwell time?
Time on page is an analytics metric that measures how long visitors spend on a page from any source. Dwell time is an SEO term for how long someone stays on a page after clicking a search result before going back to the results. Google doesn’t report dwell time, and it isn’t a confirmed ranking factor.

Written by
Adeel Khan
Growth Marketing Expert
Adeel Khan is a full-stack SaaS marketer with 10+ years of experience in content marketing, paid advertising, analytics, and conversion rate optimization. He shares practical insights and strategies drawn from hands-on experience, helping B2B SaaS marketers improve performance and make better marketing decisions.
All articles by Adeel →