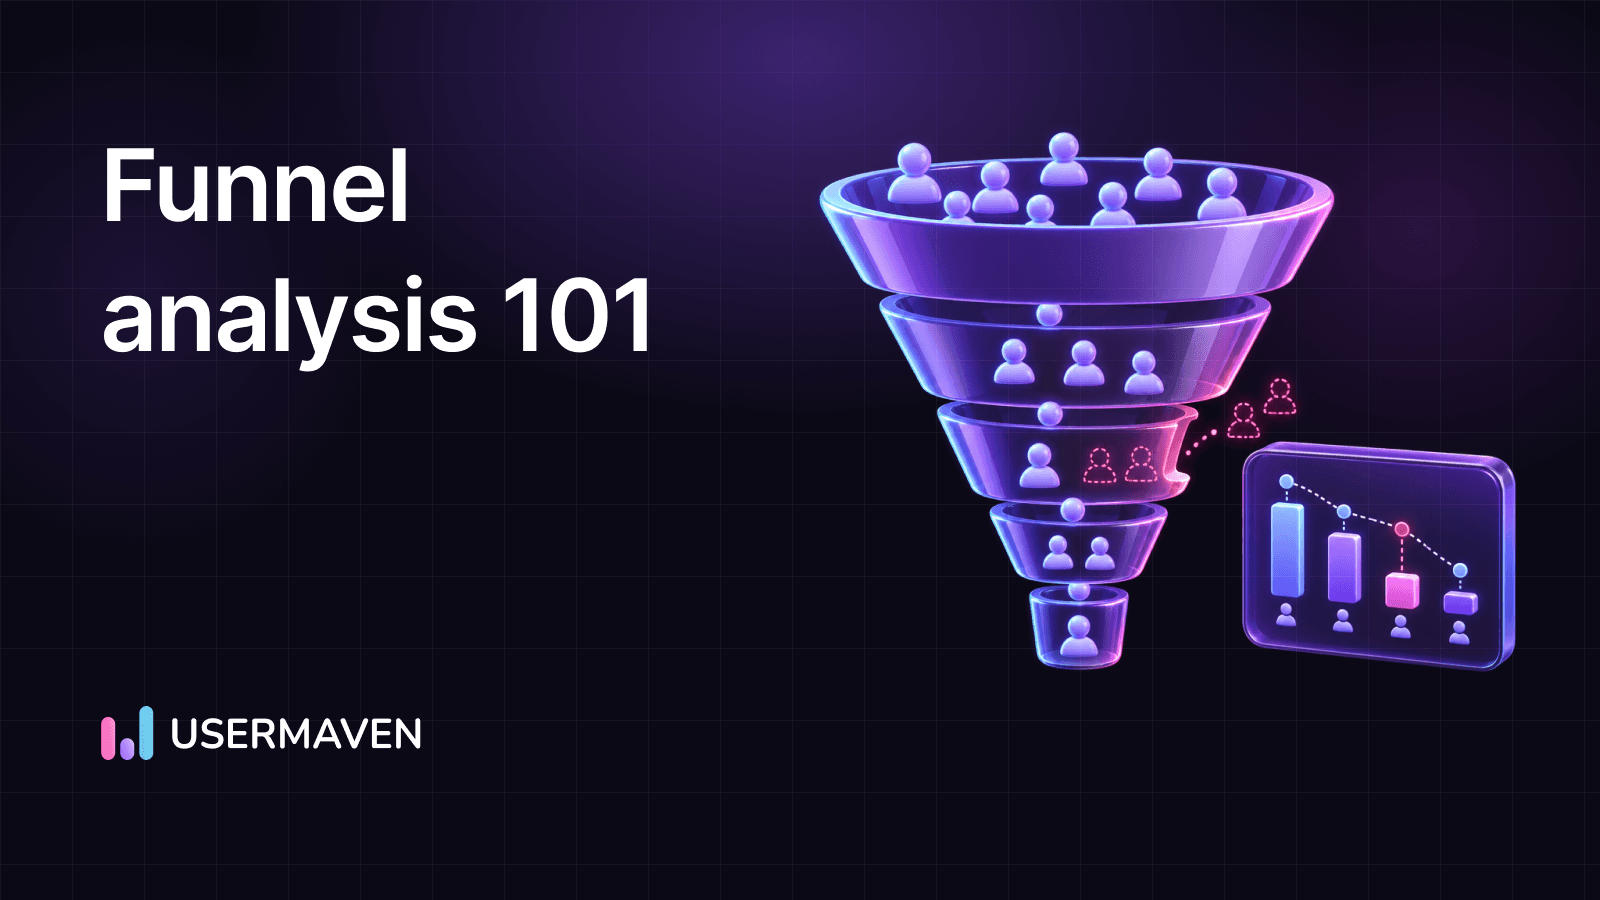
Funnel analysis measures how people move through a defined sequence of actions, from first engagement to a meaningful outcome. It shows how many users complete each step, where others stop, and how long it takes to progress.
The goal is not simply to draw a funnel. It is to find the friction worth investigating and verify whether a change improves conversion.
For a SaaS business, the sequence might be landing page → pricing page → signup → activation → paid subscription. An ecommerce store might track product view → cart → checkout → purchase. Each journey has a different purpose, but both benefit from a consistent conversion funnel definition and reliable event data.
This guide explains how funnel analysis works, the formulas and examples that matter, how to diagnose bottlenecks, and how to build a report in Usermaven without mistaking a correlation for a proven cause.
Key takeaways
- Measure a defined sequence: Funnel analysis tracks progress through selected steps rather than assuming all visitors follow a broad marketing journey.
- Use the right denominator: Overall conversion uses entrants to the first step; step conversion compares users reaching adjacent stages.
- Investigate before changing anything: A large drop-off can reflect friction, missing events, an overly restrictive funnel, or normal buying behavior.
- Compare meaningful groups: Acquisition source, device, plan, geography, and lifecycle segment can reveal where the problem is concentrated.
- Validate the impact: Experiments or appropriate before-and-after comparisons are needed to evaluate whether a fix improved outcomes.
- Connect behavior with value: For SaaS teams, signup and activation funnels become more useful when they can be analyzed alongside campaigns and downstream customer outcomes.
What is funnel analysis?
Funnel analysis is a method of evaluating how a defined group of users, visitors, or accounts completes an ordered set of events within an observation window. A funnel report typically displays how many eligible participants reach each step, what percentage progress, where they drop out, and the time between actions.
For example, a trial-to-paid analysis could measure users who signed up, created a workspace, invited a teammate, used a core feature, and purchased a subscription. That is different from merely counting all signups and payments in separate dashboards. The funnel requires a consistent starting cohort and an explicit sequence.
It is useful for product teams looking at onboarding, marketers evaluating campaign traffic, ecommerce teams investigating checkout, and B2B teams studying demo requests or opportunity progression. In company-level B2B analysis, the unit can be an account rather than a person, provided the system and matching data support that choice.
The output is descriptive evidence. It can show that 60% of entrants failed to reach the next step; it cannot, by itself, establish why those people stopped. Answering that question requires segmentation, event validation, customer feedback, usability research, or experiments.
Funnel analysis vs. traditional marketing funnel stages
Traditional marketing funnels describe broad buying stages such as awareness, consideration, and decision. Event-based funnel analysis measures observable actions, with explicit rules about who qualifies for each stage and when.
| Question | Marketing funnel framework | Funnel analysis report |
|---|---|---|
| What does it show? | Typical buyer stages | Measured step progression |
| How are steps defined? | Broad intent or lifecycle concepts | URLs, events, or CRM milestones |
| Who is counted? | Audience or lead groups | A specific user or account cohort |
| What is measured? | Campaign coverage and lead movement | Step conversion, drop-off, and time |
| Best use | Planning messaging and journeys | Diagnosing observed bottlenecks |
Both are useful. A marketing funnel can help a team choose what message belongs at each stage, while funnel analysis helps determine whether people are completing the actions required to move forward. In practice, teams often use a customer journey funnel model to plan the journey and an event-based report to measure it.
How funnel analysis works: A SaaS example
Suppose a SaaS company wants to understand why its trial users rarely become paying customers. It selects a cohort of 1,000 distinct people who viewed a landing page, then tracks their ordered progression within a defined conversion window.
| Funnel step | Users reaching step | Step conversion | Step drop-off | Users lost |
|---|---|---|---|---|
| Landing page viewed | 1,000 | Entry step | Not applicable | Not applicable |
| Pricing page viewed | 400 | 40% | 60% | 600 |
| Account signed up | 160 | 40% | 60% | 240 |
| Core feature activated | 80 | 50% | 50% | 80 |
| Paid subscription started | 30 | 37.5% | 62.5% | 50 |
Illustrative data only. This is not a real Usermaven dataset or a benchmark for SaaS conversion performance. Every row represents people progressing from the same initial cohort, not unrelated totals for each event.
The overall paid conversion rate is 30 ÷ 1,000 × 100 = 3%. For the transition from activation to paid, the step conversion rate is 30 ÷ 80 × 100 = 37.5%, and the drop-off rate is 62.5%.
Two findings stand out. The largest absolute loss occurs between landing and pricing, where 600 people do not progress. The highest percentage loss occurs between activation and paid, where 62.5% of activated users stop before purchase. Neither finding automatically tells the team which stage to change first.
If the business sells through sales calls, for example, an apparently missing paid step could be a billing-event integration problem. If most visitors arrived to read informational content, many were never ready to view pricing. A sensible next step is to examine acquisition mix, event coverage, and user intent before proposing a redesign.
Funnel analysis metrics and formulas
A clear funnel report separates the size of the audience from the percentage that advances. The following metrics answer different questions and should not be presented interchangeably.
Overall funnel conversion rate
Formula: Users who complete the final required step ÷ users who entered the first step × 100.
In the example, 30 of 1,000 entrants completed payment, giving an overall conversion rate of 3%. This is the clearest summary of end-to-end progression for the chosen cohort and observation window.
Step conversion and drop-off rates
Step conversion formula: Users reaching step B ÷ users reaching the preceding required step A × 100.
Step drop-off formula: (Users at step A − users progressing to step B) ÷ users at step A × 100.
These reveal where progression changes. Always report the number of users lost as well as the percentage. A 70% drop-off among ten people is less operationally consequential than a 20% loss among ten thousand, although business value and intent still matter.
Time to convert
This measures how long eligible participants take to move between events or complete the full sequence. Look at the distribution, not just an average, because a small number of unusually slow conversions can distort the mean.
A seven-day funnel window may be reasonable for a lightweight self-serve signup. It may exclude perfectly legitimate B2B purchases that take several weeks. Interpret conversion rates together with the intended buying cycle.
Segment and cohort conversion
Compare the same funnel definition across meaningful groups, such as paid vs. organic entrants, desktop vs. mobile users, enterprise vs. self-serve accounts, or trial signup cohorts by week.
Use identical step rules and appropriate observation windows wherever possible. Otherwise, apparent differences may result from measurement choices rather than actual behavior. Cohort analysis to measure user retention can add the longer-term perspective that a one-time funnel cannot provide.
Revenue outcomes and customer quality
A high signup conversion rate does not necessarily produce high customer value. When CRM, subscription, or payment outcomes are connected and identities are matched, analyze whether converted users activate, upgrade, or contribute to revenue later.
This is particularly relevant for marketing attribution software, where acquisition reporting and downstream conversion outcomes should be evaluated together rather than optimizing exclusively for the cheapest signup.
Types of funnel analysis and when to use each
Website and acquisition funnels
These measure steps such as campaign visit → relevant product page → pricing → signup or demo request. They help marketers compare the quality of different acquisition sources and identify whether a landing page attracts the right audience.
A content-led B2B software journey may begin with informative blog posts before readers explore product pages or book demos. This can be a useful reporting path, but it should not imply that every reader is expected to request a demo in one session.
SaaS signup and onboarding funnels
A common SaaS sequence is signup → workspace created → integration connected → first useful result. The critical activation event should represent real product value, not a cosmetic button click. Define it with input from customer success and product teams.
Consider a company selling collaboration software. Prospects comparing project management tools may sign up for trials, but the onboarding funnel should then test whether they create a project, invite teammates, and complete a shared task. The buyer research journey and product activation journey need separate, connected measurements.
Feature-adoption and upgrade funnels
These track exposure to a feature, first use, repeat use, and an optional upgrade. They are useful for deciding whether an advanced capability is discoverable and valuable enough to support expansion.
Keep feature adoption distinct from plan purchases. Users might adopt a feature without purchasing immediately, and an upgrade may occur after a sales conversation that is not fully reflected by product events. Link these analyses only when the underlying identities and business events support it.
Ecommerce checkout funnels
A purchase funnel may include product viewed → added to cart → checkout started → payment completed. It can help distinguish problems with product interest from friction at shipping, account creation, or payment.
Compare device types and traffic sources before assuming abandonment results from page design. Check payment status events, refunds, duplicate purchases, and any external checkout redirects that may interrupt tracking.
B2B demo and account funnels
For a sales-led business, an account-level funnel may track identified company → qualified lead → demo completed → opportunity created → closed-won. Account-based counting helps avoid interpreting several contacts from the same buying committee as unrelated deals.
But an opportunity can involve many people, and not all sales milestones happen on the website. Verify CRM stage definitions and identity links before connecting these steps. A separate b2b marketing attribution analysis can complement this view by assigning credit to the marketing interactions associated with qualified outcomes.
How to conduct funnel analysis step by step
1. Choose one meaningful outcome
Start with a precise question such as “What percentage of new trials reach first value within 14 days?” Avoid designing a single funnel to answer every question from acquisition to retention.
Write down the final action, its business relevance, the entry cohort, and the owner of the report. A trial activation funnel should end at an event that indicates product value; a revenue funnel should use an appropriately validated payment or deal outcome.
2. Define events, identities, and the allowed sequence
List each required event, its trigger, its timestamp, and whether it belongs to a visitor, user, or company. Ensure signup events aren’t double-fired and that logged-out and logged-in identities can be connected where applicable.
Use a simple process map before configuring the report. Some teams prepare funnel diagrams to align marketing, product, and sales stakeholders on the exact sequence. The diagram is only a plan; tracked events establish the actual counts.
3. Pick the cohort, order rules, and time window
Choose a starting population that matches the business question. New visitors from a campaign are different from existing customers evaluating an upgrade. Define the period in which participants can complete the funnel.
Decide whether people can perform unrelated actions between steps and whether an optional action should be required. Strict ordering may undercount normal journeys where a user explores other pages or features between conversion milestones.
4. Validate data before trusting the chart
Perform the journey yourself in a test environment and check that the events, properties, and timestamps appear as expected. Inspect consent behavior, cross-domain checkout, identity stitching, and import delays where relevant.
Check whether the final event is available to the analysis. A payment recorded in a separate billing tool won’t automatically appear merely because an analytics script is present on the site. Use a documented integration or event pipeline and confirm the event is matched to the right user or account.
5. Calculate progression and identify candidate bottlenecks
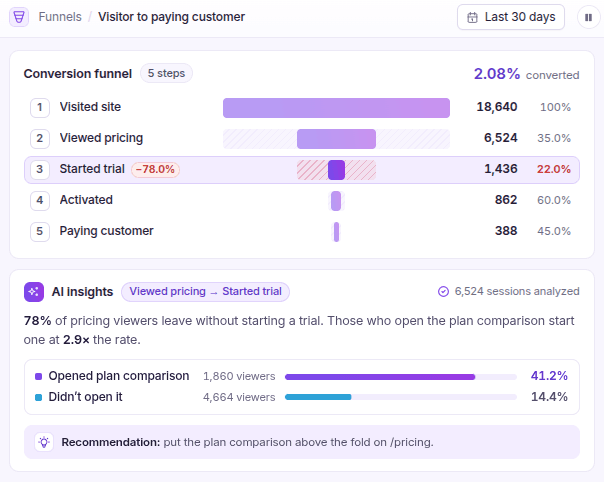
Look at overall conversion, each step’s absolute loss, its proportional drop-off, and conversion time. If the biggest percentage loss involves only a handful of users, do not automatically prioritize it over a moderate loss affecting thousands.
Use a simple impact screen: affected population × potential recoverable conversions × approximate business value. This is a prioritization aid, not proof that the entire observed drop-off can be recovered.
6. Break down the funnel and investigate causes
Compare conversion by device, channel, campaign, country, customer plan, and relevant segment. Drill into tracked journeys and complement quantitative patterns with customer interviews, usability checks, support messages, or technical error logs.
If paid traffic drops before signup while organic traffic converts well, inspect campaign intent and landing-page relevance. If every channel drops at the same post-signup step, investigate onboarding design, missing events, or a product issue instead.
7. Test a change and monitor customer outcomes
Write a hypothesis, decide what change would address it, and choose a success metric. Where feasible, use a randomized experiment and a predefined observation window. Otherwise, document how the audience mix or other factors could affect an observational comparison.
Continue monitoring activation quality, support needs, paid conversion, or retention. Increasing an intermediate click rate is not enough if the change creates poorer downstream outcomes.
How to build and analyze funnels in Usermaven
Usermaven’s conversion funnel analytics software helps teams analyze tracked website and product events alongside acquisition and conversion data. Its current documentation supports user- and company-level funnels, sequential and strict ordering, optional steps, conversion windows, breakdowns, comparisons, and conversion-time analysis.
Create and configure the funnel
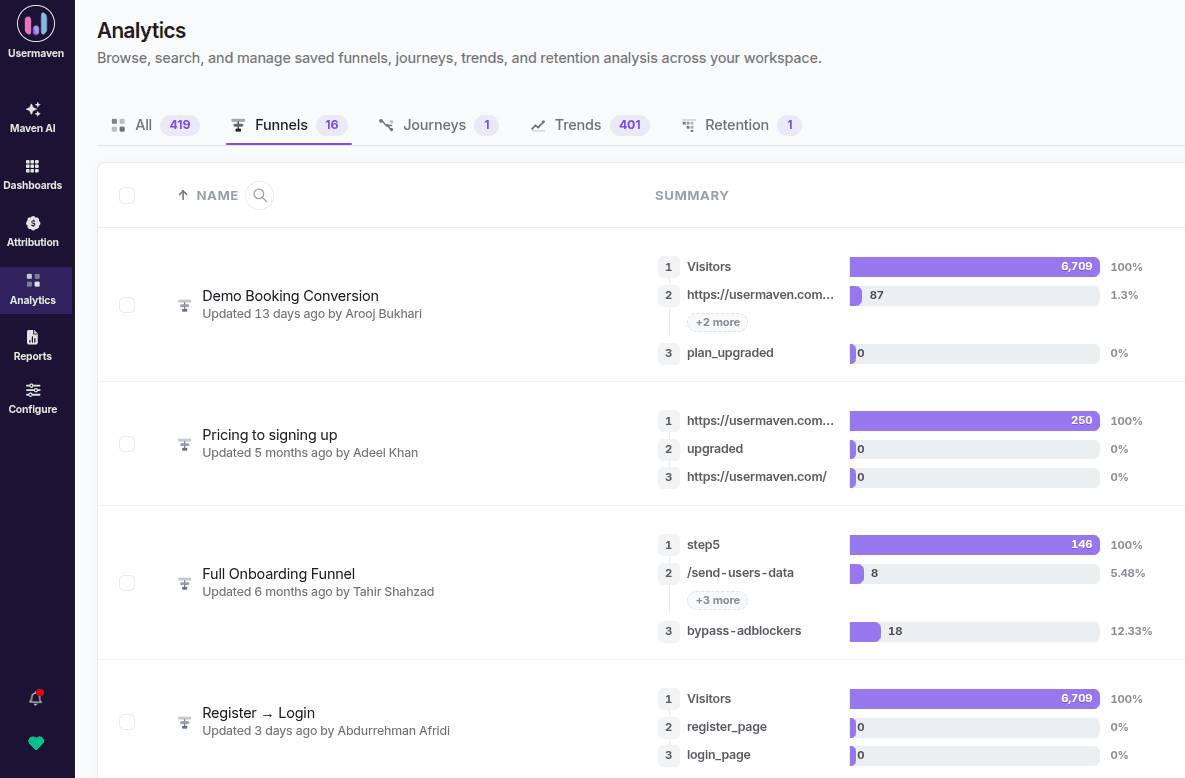
Open Analytics Hub and choose Funnels to start a new analysis. Usermaven’s current help documentation also describes this navigation as Analytics → Funnels. Select the new-funnel action and provide a recognizable name and optional description.
Add steps using page URLs, custom events, or pinned events. For a SaaS activation report, those might be Viewed Pricing, Signed Up, Created Workspace, and Performed Core Action. Only use events that are actually collected in the workspace.
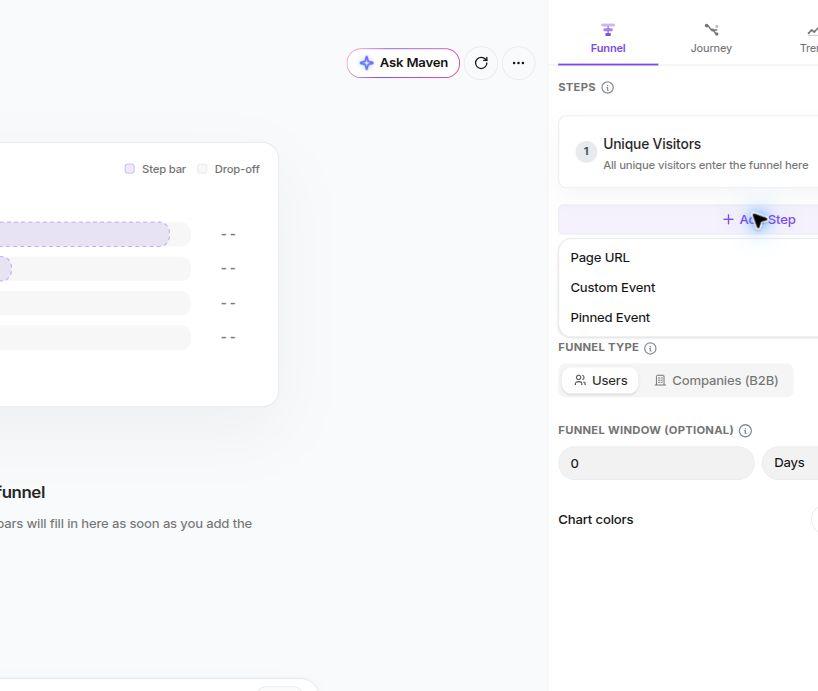
Choose a funnel type: Users for individual progression or Companies for account-level journeys. Set the observation window based on how long participants reasonably need to finish. Optional steps can represent helpful but nonessential actions.
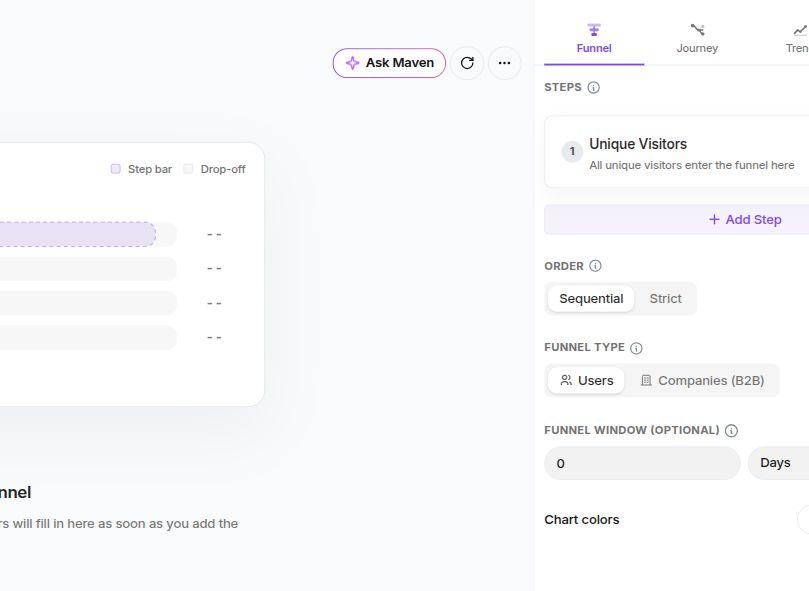
Select sequential or strict ordering correctly
Sequential ordering requires the selected steps to happen in the specified order while allowing other actions between them. It is suitable for most real-world conversion analyses.
Strict ordering requires the exact defined sequence without unrelated actions in between. It is useful for analyzing a tightly controlled process, but it can exclude users who legitimately took detours.
This distinction is important because changing the rule can change conversion counts even when customer behavior has not changed. Document the chosen order and keep it stable when reporting trends.
Analyze drop-offs, time, and segments
Once the funnel is saved, review the total entrants, completed conversions, biggest drop-off, step-level progression, and average time between steps. Usermaven provides flexible and exact path views in its funnel reporting.
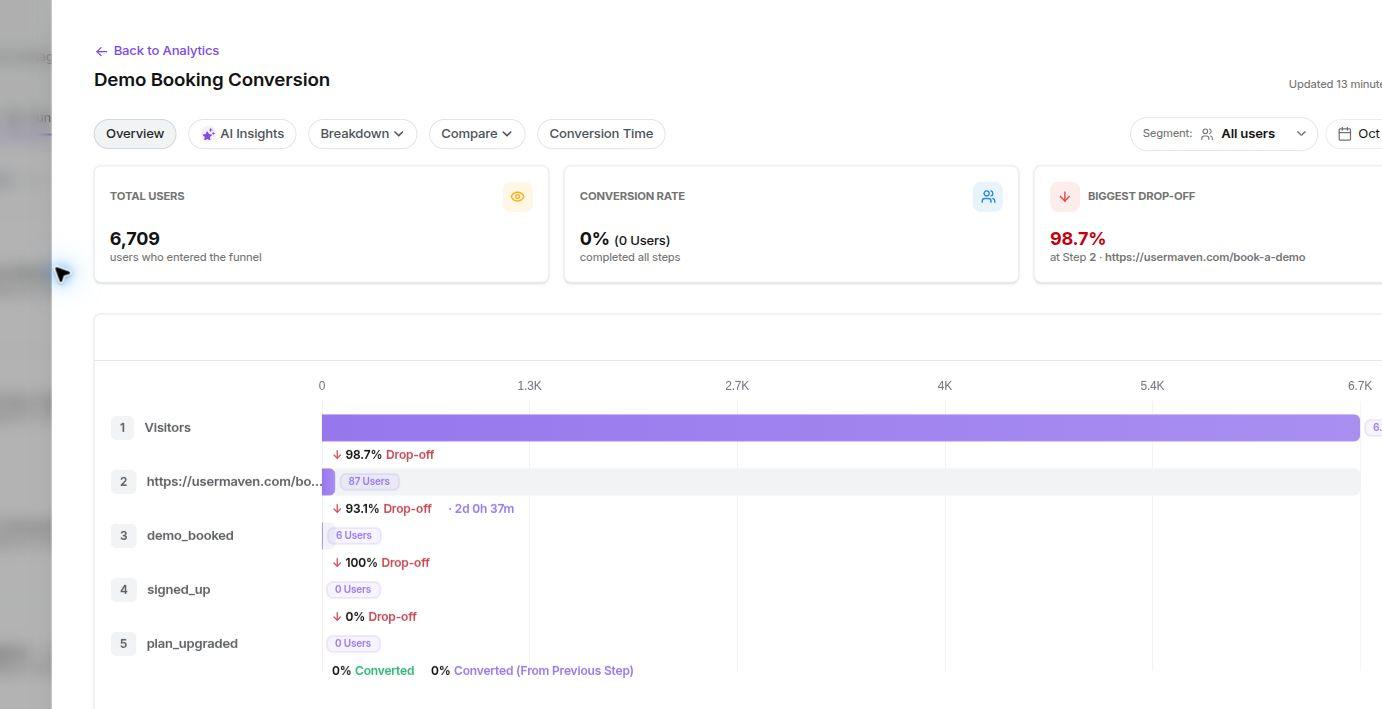
Use Breakdown to compare dimensions such as campaign, device, country, browser, or custom properties. Compare different time periods or saved segments to see whether the issue is concentrated in a specific audience. For deeper behavior context, the customer journey analytics software view can help investigate tracked paths.
Connect funnels to acquisition and downstream outcomes
An acquisition funnel tells a stronger story when the business can distinguish which channels produce users who actually activate or pay. Usermaven’s marketing attribution and event integrations can help when the appropriate events, identifiers, and conversion goals are correctly configured.
Its July 2026 Event Sources release made it possible to bring supported CRM, payment, and other external events into Funnels and related analytics views. Imported events still require proper data mapping and identity matching; they do not reconstruct interactions that were never tracked.
Use Maven AI for an additional investigation
Maven AI can assist with questions about connected funnel data and render funnel results in interactive views. Maven AI Agents can run recurring investigations and surface evidence-backed findings, including meaningful funnel changes. These are analytical aids rather than automatic experimentation or guaranteed root-cause detection.
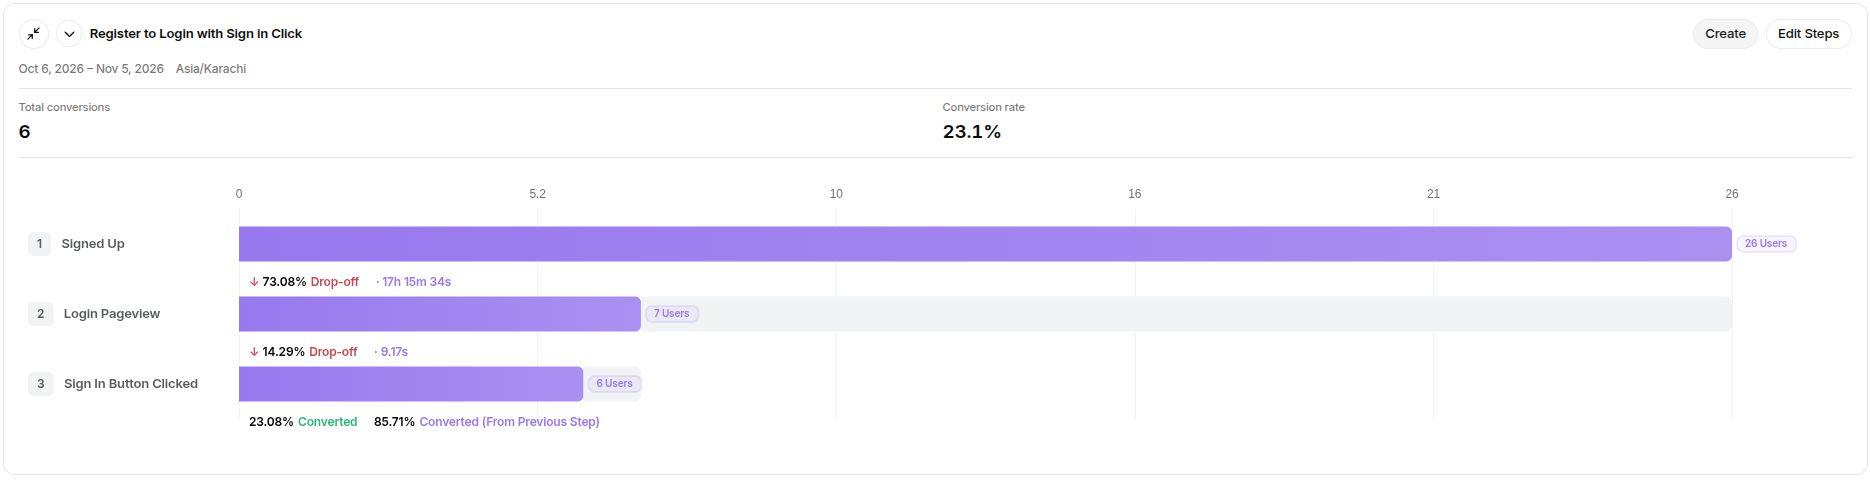
For example, ask “Where do users drop off in the Register → Login funnel?” Maven AI can examine tracked events and present a funnel with step counts, conversion rates, drop-offs, and time between steps. Check the event definitions and conversion window before interpreting the result: a user who stays signed in may not need to revisit the login page.
How to prioritize and fix funnel bottlenecks
Funnel analysis is most effective when it produces a testable diagnosis. A drop-off is a signal, not a reason by itself to redesign a page.
| Observed pattern | What to investigate | Possible test |
|---|---|---|
| Many landings, few pricing views | Intent mismatch, navigation, relevance | Clarify value proposition and next action |
| Pricing views, few signups | Price clarity, trial anxiety, form errors | Test clearer plan details or shorter form |
| Signups, weak activation | Onboarding steps, empty states, setup effort | Simplify first-value path or guided setup |
| Activated users, few paid accounts | Feature value, pricing fit, billing events | Test upgrade messaging and validate payment events |
| Mobile drop-off only | Responsive design, payment UX, performance | Fix mobile friction and retest |
A well-placed explainer may help if users struggle to understand a setup step. For example, the team might create a video showing how to connect an integration, then test whether it improves the rate of completing the first-value event. Do not assume producing the asset itself will raise conversion.
Prioritize changes using the size of the affected group, confidence in the diagnosis, cost of implementation, and expected business value. A measured increase in the relevant final conversion is more persuasive than an improvement in an intermediate click rate alone.
Common funnel analysis mistakes
Mixing users, sessions, and accounts
A user can visit the site several times, while a B2B account can have multiple users. Counts and conversion rates will change depending on the chosen entity. State the counting unit and avoid comparing user-level funnel rates with session-level web metrics as though they were identical.
Treating all event totals as one funnel
A weekly dashboard might show 200 signups and 40 payments without proving that the same people completed the events in sequence. Funnel analysis requires consistent identities, ordered steps, and a defined window.
Using an unrealistic completion window
A one-day funnel can make a seven-day buying journey look like a failure. Conversely, a very long window can make recent cohorts look artificially weak because they haven’t had enough time to finish. Evaluate mature cohorts and document the reporting cutoff.
Assuming the highest drop-off proves a usability problem
Users may intentionally stop, return later, choose a competitor, or encounter a tracking gap. A percentage alone cannot distinguish these explanations. Investigate context before acting.
Forgetting optional steps and alternate paths
A webinar attendance or support visit may help some users convert but should not always be a required step. Requiring irrelevant actions can artificially reduce measured conversion. Use optional steps or a separate diagnostic funnel when the journey differs.
Declaring success after an untested change
A new CTA, onboarding message, or explainer should have a documented hypothesis, success metric, and evaluation period. Attribution reports and funnel charts show observed associations; they do not establish incremental causal lift on their own.
Funnel analysis checklist
- Goal: Identify the final action and its connection to a business outcome.
- Entry cohort: Define who enters the funnel and why they qualify.
- Measurement unit: Choose users, visitors, sessions, or accounts consistently.
- Tracking: Verify page views, event names, properties, identifiers, and timestamps.
- Order and window: Document required steps, optional steps, sequencing rules, and completion time.
- Baseline: Record overall conversion, step conversion, drop-off counts, and time to convert.
- Breakdowns: Compare only relevant segments with sufficient data and consistent rules.
- Diagnosis: Investigate tracking quality and plausible friction before choosing a change.
- Validation: Use appropriate tests or carefully interpreted comparisons.
- Monitoring: Review downstream activation, paid conversion, or revenue, not only clicks.
Final thoughts
Funnel analysis is not a drawing of a narrowing customer journey. It is a measurement method for understanding how a defined cohort advances through meaningful actions. The best analyses combine clear event definitions, reliable identities, appropriate time windows, step-by-step conversion metrics, and evidence-led investigation.
For SaaS and B2B teams, the next step is to connect those insights with acquisition quality and the outcomes that matter after signup. Usermaven brings funnel analytics software, website and product behavior, and marketing attribution into a connected environment when the relevant events are tracked and integrated.
Teams ready to investigate conversion drop-offs alongside marketing performance can book a Usermaven demo to discuss their use case.
FAQs
1. What is funnel analysis in marketing?
Funnel analysis measures how a defined audience completes a sequence of actions toward a marketing or business outcome, such as moving from a landing page to a demo request. It quantifies progression and drop-offs at each step so teams can identify where further investigation is useful.
2. What is an example of funnel analysis?
A SaaS company might analyze landing page viewed → pricing viewed → signup → activation → payment. If 1,000 users enter and 30 complete payment within the chosen window, overall conversion is 3%. The intermediate steps show where progression changes.
3. How do you calculate funnel drop-off rate?
Subtract the number of users who reach the next required step from the number at the current step, divide by the number at the current step, and multiply by 100. Always confirm that both counts use the same cohort and counting unit.
4. What is the difference between funnel analysis and path analysis?
Funnel analysis evaluates progression through a predefined sequence. Path analysis examines the routes users actually take, which may be exploratory and include many different branches. They complement one another: a funnel identifies where progression declines, while paths may provide clues about what users did instead.
5. Which tools can perform funnel analysis?
Product and web analytics platforms can support funnel reporting, but the right choice depends on event tracking, identity handling, user or company funnels, conversion windows, segmentation, and downstream data needs. The dedicated funnel analysis tools comparison helps evaluate software rather than repeating the implementation steps here.
6. Can funnel analysis tell you why users abandon a step?
Not reliably by itself. It establishes where a measured decline occurs. To investigate possible causes, combine it with qualitative feedback, technical validation, segment comparisons, user journeys, and controlled tests where practical.
7. How often should you review a conversion funnel?
Review frequency depends on traffic volume and decision speed. High-volume self-serve teams might monitor important funnels weekly or more often, while low-volume B2B companies may need longer windows to obtain meaningful comparisons. Keep the definition consistent and investigate material changes rather than reacting to every fluctuation.

Written by
Adeel Khan
Growth Marketing Expert
Adeel Khan is a full-stack SaaS marketer with 10+ years of experience in content marketing, paid advertising, analytics, and conversion rate optimization. He shares practical insights and strategies drawn from hands-on experience, helping B2B SaaS marketers improve performance and make better marketing decisions.
All articles by Adeel →