If you want to understand how your SaaS is really growing, you need to look past the vanity metrics.
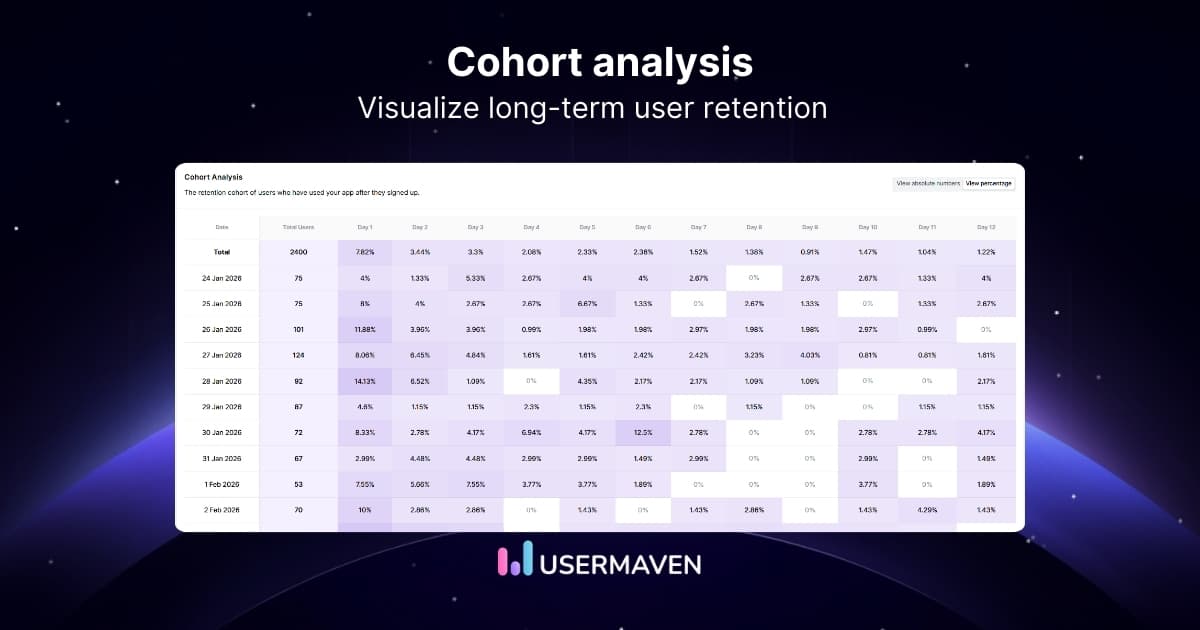
Cohort analysis is the most effective way to see exactly how different customer groups move through your product over time.
By leaning into retention analytics, you can identify the specific behaviors that keep your users coming back. It’s about identifying the early wins that turn new signups into your most loyal power users.
In this guide, we’ll break down what cohort analysis is, how it works, the different types you can use, and walk you through the process step by step.
What is cohort analysis?
Cohort analysis is the process of grouping users based on shared characteristics or behaviors and analyzing how they behave over time. This method is a cornerstone of any product analytics strategy, helping you understand patterns like retention, churn, and engagement among different user groups.
Unlike RFM (Recency, Frequency, Monetary) analysis, which focuses on customer value based on past purchase behavior, cohort analysis examines groups of users who begin a journey at the same time. It’s more about tracking how specific behaviors impact long-term success.
For example, you might group users who signed up in January and track how many are still active in February, March, and so on. By comparing cohorts, you can see if a new onboarding flow or feature is improving user retention over time.
Cohort analysis vs. segmentation
Segmentation and cohort analysis sound similar, and they do work together, but they are not the same thing. It’s easy to mix them up because they both involve grouping users, but the “how” and “why” are fundamentally different.
Here is a simple comparison to help you tell them apart.
Aspect
Segmentation
Cohort analysis
Main idea
Groups users by static traits such as country, device, or plan
Groups users by a shared event or time, then tracks them over time
Time factor
Snapshot at one point
Follows each cohort across many periods
Typical rule
All users on the Pro plan today
All users who signed up in March, and how many are still active each month
Main use
Targeting, messaging, pricing
Retention cohorts, churn study, user retention analysis
Sample question
Which industries use the Enterprise plan?
Do users who came from paid search in April retain better than those from organic in April?
Types of cohort analysis you should know
There are several ways to group users for cohort analysis. Here are the most common types to consider.
Acquisition cohorts
Acquisition cohorts group users by when they first interacted with your product. You might look at weekly sign-ups or monthly free trials. For example, everyone who started a trial in March is one cohort, and everyone who started in April is another. When you compare their retention curves, you see whether newer cohorts behave better or worse than earlier ones.
This is often the starting point for retention cohorts because it aligns cleanly with marketing campaigns and product releases.
Behavioral cohorts
Behavioral cohorts group users by the actions they take. One cohort might be users who invite a teammate or adopt a key feature. Another might be users who never do either. By running cohort analysis on these groups, you see how specific behaviors tie to long-term engagement and churn.
This makes behavioral cohorts especially useful for connecting feature adoption and other product actions to outcomes like upgrade rate or CLTV.
Time-based cohorts
Time-based cohorts focus on a shared period rather than just the first event. You might group users who were active during a promo week, or who used the product during a holiday season.
This type of cohort analysis helps you understand seasonality, special offers, and other time‑bound factors that affect retention.
Event-based cohorts
Event-based cohorts group users around a specific event, such as a feature launch, big pricing change, or major campaign. You can compare cohorts that started before and after the event. This is helpful when you want to know if that event changed retention patterns or revenue inside a group.
For example, you could track everyone who first used a new feature in May and compare their retention with that of earlier adopters of the same feature. This is perfect for a post-launch analysis to see if a new update improved retention.
Funnel-based cohorts
Funnel-based cohorts group users by their position in your sales or product funnel. You might compare people who reach the pricing page with those who stop at the sign-up form. By running cohort analysis across stages, you can see which parts of the funnel drive better retention and which stages send people who churn quickly.
This helps you spot steps that look strong on conversion rate but send low‑quality users who don’t stick around.
Size-based cohorts
Size-based cohorts are handy for B2B and ecommerce teams. You group accounts by company size, number of seats, or order size. For instance, small teams with fewer than 10 seats form one cohort, while large teams with more than 100 seats form another. This kind of customer cohort analysis reveals which sizes bring stable revenue and where churn risk is higher.
For ecommerce, you can apply the same idea by grouping customers based on their first-order value or the number of items.
Key concepts and metrics in cohort analysis
Before you run a cohort analysis, it helps to be clear on a few basic ideas that appear in every retention report.
The first concept is cohorts. These are your user groups, segmented by a shared characteristic. You might group by sign-up date, such as all users who joined in a given week. You might group by behavior, such as users who completed onboarding. Or you might group by acquisition source, such as users from a paid campaign. Each grouping gives you a different angle on your retention cohort analysis.
Beyond cohorts, several product metrics appear in almost every report:
Retention rate: The share of a cohort that remains active after a given time period. If 100 people sign up in May and 40 are active 3 months later, the 3-month retention rate for that cohort is 40%. You use this to see how long each cohort stays with your product.
Churn rate: The share of a cohort that stops using your product or cancels during a period. High churn in early weeks tells you that something in onboarding or early value delivery is broken. In cohort analysis, churn lets you see exactly when people tend to leave.
User activation: The moment a new user hits their aha moment and experiences real value in your product. That might be sending a message, inviting a teammate, or completing a key action. Strong activation is the primary driver for increasing product engagement over time.
Lifetime value (LTV): This estimates how much revenue an average user in that cohort will generate over their entire relationship. Looking at LTV by cohort helps you see which marketing campaigns or product changes bring in the most profitable users.
Purchase frequency: This tells you how often users in a cohort buy again. For ecommerce stores, this is a core input to retention analysis and can guide email cadence, promotions, or loyalty programs.
Acquisition cost: This is how much you pay in ads, sales, or discounts to win one user in that cohort. When you compare acquisition cost with CLTV for the same cohort, you can see if that group is worth the spend.
Revenue per user (ARPU): When you track this metric across cohorts, you see which groups spend more over time. It pairs well with user retention analysis because high revenue per user matters only if those users keep coming back.
Average order value (AOV): The average transaction size within a cohort. For an ecommerce brand, watching AOV in cohort analysis can show whether new pricing, bundles, or upsells change the spending behavior of different user groups over the months.
Power up your SaaS with perfect product analytics
*No credit card required
When to use cohort analysis
Let’s look at common scenarios where cohort analysis helps you pinpoint exactly where product experience succeeds or fails.
Identify user behavior patterns: Use cohort analysis when you care about how behavior changes over time, not just how many users you have right now. It shows patterns like early spikes of activity followed by sharp drops, or slow but steady engagement from certain cohorts that your daily metrics hide.
Optimize marketing campaigns: When you run multiple channels simultaneously, it is easy to focus only on the first conversions. Cohort analysis in marketing lets you see which channels bring users who keep engaging months later. That way, your retention cohorts guide budget decisions, not just cheap sign-ups.
Improve product development: Product teams often want to know whether a new feature keeps people around longer. By comparing cohorts before and after a release, you can see whether that change improved or worsened cohort retention. This turns product work into a clear retention-cohort analysis rather than guesswork.
Assess onboarding performance: Onboarding is where many users slip away. When you look at cohorts based on when they joined and what they did in their first days, you can see how different flows or messages change early drop-off. That makes it much easier to refine onboarding with data instead of opinion.
Why cohort analysis matters for retention
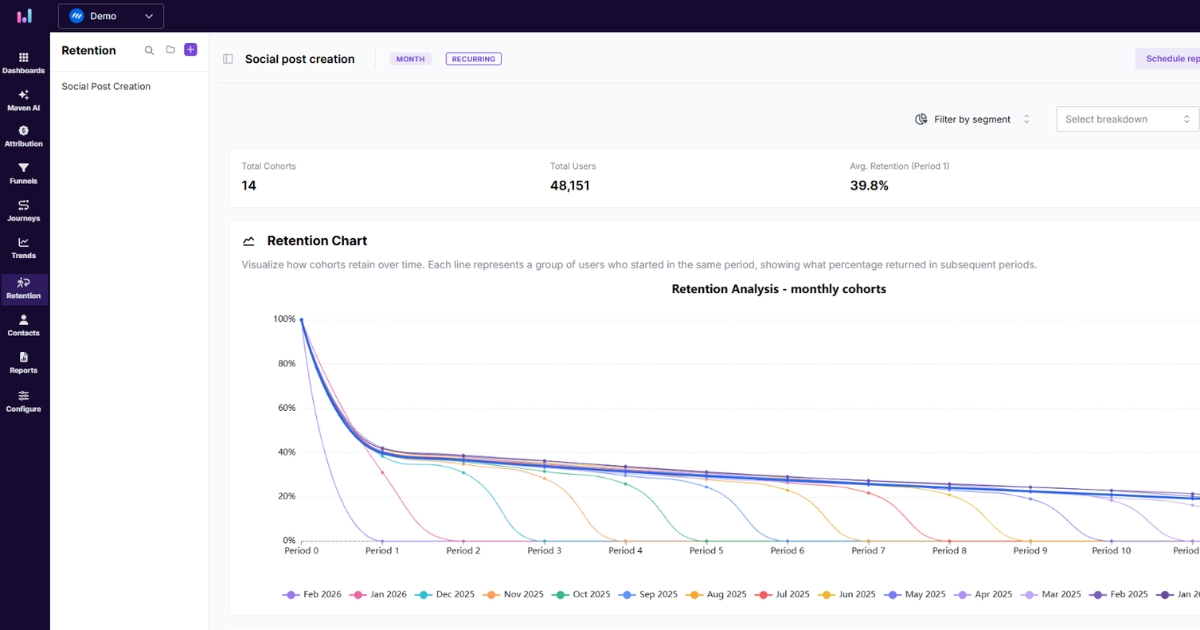
Let’s explore the key benefits of cohort analysis and how it connects daily activity to long-term business health in ways simple charts can’t.
Optimize conversion funnels: Use cohort analysis to spot where users drop off and whether they ever return. Then test fixes at that step and track new retention cohorts to confirm improved retention.
Use it as a business health check: Strong retention across the product adoption curve signals a healthy business. By tracking cohort total users and who stays active months later, you can see base stability and whether each cohort retains better than the last.
Improve audience segmentation: Segment users by real behavior with cohort analysis (not demographics). Find high-value groups and target them with tailored offers, cross-sells, and retention strategies.
Raise acquisition quality: Compare cohort retention across channels (paid, organic, referral, partner) to see which channels keep users. If a channel churns fast, adjust messaging or shift spend toward higher-quality cohorts.
Strengthen retention programs: Cohort retention analysis shows when users disengage (e.g., week three). Use that timing to trigger nudges or helpful content that lifts long-term retention.
Measure the long-term impact of changes: Track cohorts for weeks or months after product, pricing, or messaging changes. Use results to identify areas for improvement and ensure conversion gains do not drive higher churn later.
How to conduct cohort analysis
Cohort analysis sounds technical, but you can follow a clear path from question to action. Here is a simple framework you can reuse.
Step 1: Identify key cohorts
Start with a concrete question, such as why new users from last quarter churn faster or which channel brings the best retention. From there, decide how to group people. You might choose the sign-up month, the first purchase week, or the first feature use. Clear questions lead to clear cohorts and cleaner retention analytics.
A quick tip: write your question as a full sentence, such as “Do users who complete onboarding in under three days retain better than those who take longer?” This keeps the analysis focused and actionable.
Step 2: Track engagement
Once you’ve defined your cohorts, determine what counts as engagement: logging in, sending a message, placing an order, or using a core feature. Then track how often users in each cohort perform that action across days, weeks, or months.
Tools like Usermaven make this effortless with minimal setup. Simply track events, feature usage, and purchases once, then filter the data into different retention views to monitor active users whenever you need them.
Step 3: Find sticky features
Look for behaviors that distinguish high-retention cohorts from low-retention ones. Maybe users who create three projects in their first week drive product stickiness, while others churn. These become your sticky features and actions, making them key focus points for onboarding and product tours.
You can spot sticky actions by:
Comparing feature usage between your best and worst cohorts
Identifying which early actions appear most often among long-term users
Step 4: Compare behavioral cohorts
Create behavioral cohorts based on those actions. One cohort completed the sticky action, the other did not. Compare their retention curves and revenue. This is where user retention analysis becomes concrete, because you can see exactly how much a single behavior influences long-term value.
If the difference is significant, you have found a powerful lever to optimize onboarding, lifecycle emails, and in-app prompts.
Step 5: Identify patterns
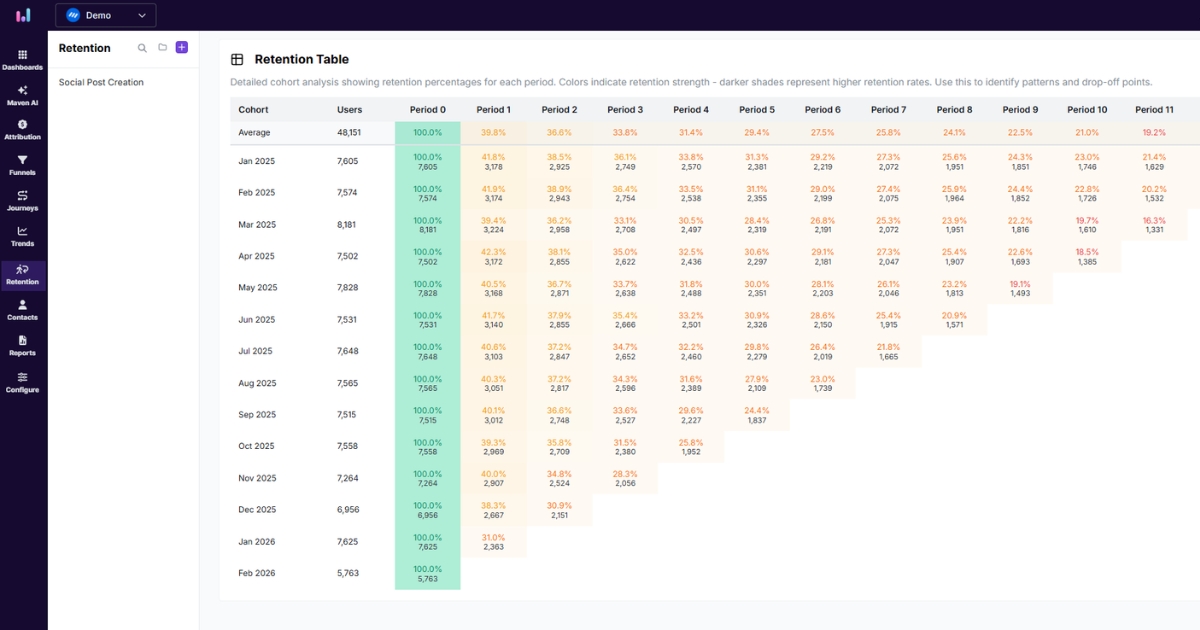
Lay out the results in a cohort table. Each row is a cohort, and each column is a time period after the start event. Scan across rows to see how a single cohort decays. Scan down columns to see if newer cohorts are outperforming older ones. Sudden drops or steady improvement will stand out immediately.
Look for:
The point where curves flatten (your “steady state” retention)
Periods where many cohorts show better or worse performance (often tied to launches or campaigns)
Step 6: Take action on insights
Do not let the data sit idle. Take your strongest findings and turn them into real changes. Maybe that means reworking your onboarding flow to prompt a key action sooner, tightening your ad targeting, or fixing a feature that seems to push users away too soon. Once those changes go live, run cohort analysis again on incoming users to see whether behavior is shifting in the right direction.
This build–measure–learn cycle is what transforms cohort analysis from a one-time report into an ongoing force for better decisions.
Real-world cohort analysis examples
Concepts only go so far. Here are three short, practical examples across common product types to show cohort analysis in action.
SaaS productivity app
Imagine a collaboration platform struggling with rising monthly churn. Cohort analysis by sign-up month reveals that recent users drop off sharply after the first week. Digging deeper, you pull product usage analytics and build behavioral cohorts based on whether users create their first project checklist.
The results are clear. Users who complete a checklist in week one retain at nearly three times the rate of those who skip it.
With this data in hand, you redesign onboarding to highlight checklists and add in-app prompts for new users. The results follow quickly. Thirty-day retention climbs from around 25% to over 40%, alongside stronger revenue per user across later cohorts.
Ecommerce brand
An ecommerce brand wants to know which ad channel brings the best customers, not just the most. They group users by acquisition channel and track their orders over 6 months. The results are clear: one channel drives large first orders but almost no repeat purchases. Another brings smaller first orders but strong repeat buying.
The brand shifts budget toward the second channel and adjusts messaging on the weaker one. Traffic may stay flat, but CLTV for new cohorts rises. More customers become repeat buyers, and that changes everything.
Mobile gaming company
A mobile game is losing revenue despite steady downloads. Grouping players into cohorts by install date and progression reveals the problem. Advanced players in recent cohorts churn faster than earlier ones, while new players behave normally.
A deeper investigation uncovers a small loading delay that hits high-level play the hardest. After fixing the performance issue, the team rolls out a reward for returning advanced users. Later cohorts of expert players stick around longer. Revenue recovers as these high-value users keep playing and spending.
Common mistakes to avoid in cohort analysis
Cohort analysis is powerful, but common pitfalls can quietly lead you to flawed conclusions and costly decisions if left unchecked.
Cohorts that are too broad or too tiny:Yearly cohorts hide short-term effects, and tiny cohorts add noise. Choose a window that fits your volume so cohorts are stable but still sensitive to change.
Treating correlation as causation: Feature X users may retain more, but that does not prove Feature X caused it. Validate with A/B tests or controlled rollouts on comparable users.
Using the wrong time interval: Match cohort timing to usage rhythm, daily/weekly for social, weekly/monthly for B2B. Wrong intervals can hide churn signals and distort retention patterns.
Ignoring qualitative data: Cohorts show what happened and when, not why. Add surveys, interviews, and support tickets to explain churn spikes.
Treating cohort analysis as a one-time project: One report is of limited value. Re-run after launches, campaigns, and pricing changes to learn what improves retention over time.
How to select the right tool for cohort analysis
You can build simple cohort tables in spreadsheets, but tools designed for marketing analytics and product analytics make the process far more manageable. When comparing options, keep a few points in mind.
Ease of use. A good tool lets you build cohorts, choose metrics, and read charts without writing a single line of code. This matters when marketers, product managers, and founders need to explore data independently. If only a data engineer can run cohort analysis, it will rarely become a regular habit.
Data integration. Look for tools that connect with your app, website, and marketing stack. Centralizing sign-ups, product events, purchases, and campaign data in one place ensures your retention analysis covers the full customer journey.
Custom definitions. Your business defines activation, churn, and success on its own terms. The right tool lets you create custom events, properties, and cohorts so your reports reflect your actual reality, especially for products that don’t fit standard templates.
Reporting and visualization. Clear retention tables, funnel views, and user path breakdowns make cohort analysis easier to present and discuss. Look for tools that display percentages, cohort sizes, and trends in a format your team can quickly understand and act on.
Built to scale with you. As your user base grows, you need a tool that can handle larger datasets without sacrificing performance. Features like funnel analysis and ad attribution software help you understand what drives conversions, supporting a smarter product-led growth strategy.
Finding a setup that checks all these boxes lets you stop managing data and start answering questions that actually drive decisions. Usermaven is built for exactly that. It brings together product analytics, event tracking, and segments in one place, with cohort analysis included. Setup is simple, and non-technical teammates can explore retention data independently, without relying on a data team.
To sum it up,
Cohort analysis is the ultimate reality check for your product’s retention. It stops you from obsessing over total user counts and forces you to focus on whether specific groups are actually sticking around and finding value over time.
The pivot from data to insight only happens when your tracking is seamless. Usermaven stands out as a powerful website analytics tool by bridging the gap between where your users come from and what they actually do once they arrive. It gives you a clear view of which behaviors drive upgrades without the headache of manual data stitching.
If you’re ready to see exactly where your users are winning or losing momentum, start a free trial or book a demo for a quick walkthrough.
FAQs about cohort analysis
1. What is a cohort in simple terms?
A cohort is simply a group of people who share a common characteristic or experience within a specific time frame. For example, “users who signed up in January” or “customers who made their first purchase during a Black Friday sale.”
2. What is cohort analysis in SaaS?
In SaaS, cohort analysis is the process of tracking how specific groups of subscribers behave over their lifecycle. It is primarily used to measure how long different “classes” of users stay active, how quickly they upgrade, and where they typically drop off in the subscription journey.
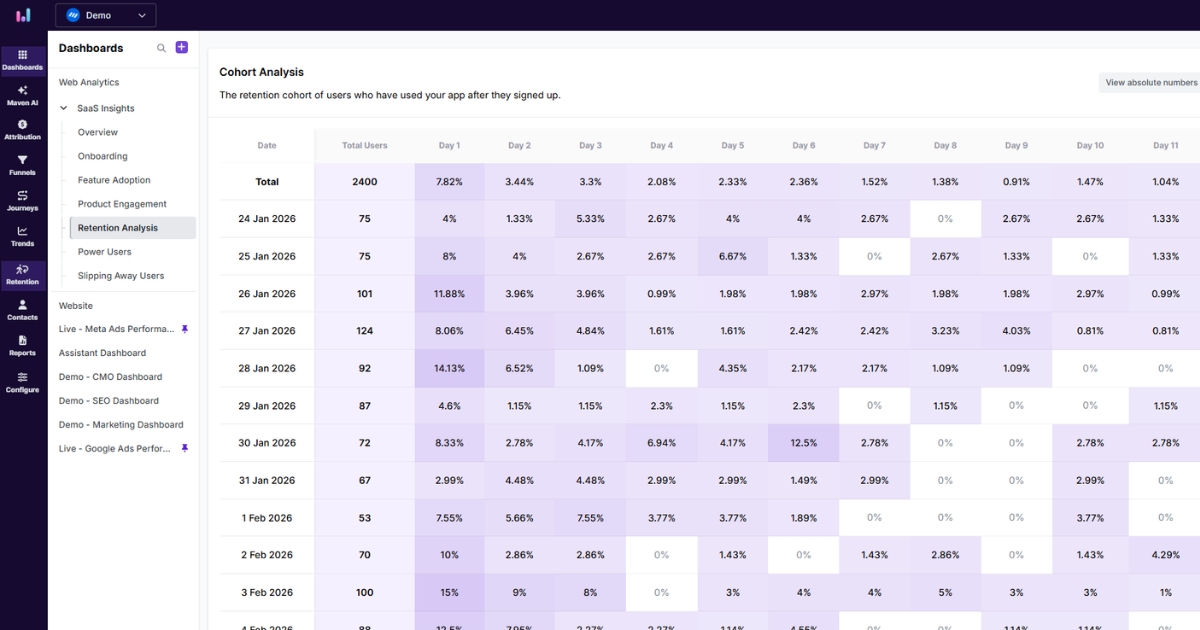
3. How to interpret a cohort analysis report?
Think of a cohort table as a grid: reading horizontally across a row shows you the “health” of a specific group as they age, while reading vertically down a column compares different groups at the same stage of their journey. This allows you to see if a product update you made last month is actually helping new users stick around longer than those who joined before the change.
4. How to calculate cohort retention?
To find your retention rate, take the number of users in a specific group who are still active at the end of a period and divide it by the total number of users in that group. Multiplying that result by 100 gives you the percentage of the “class” you successfully kept.
5. Why is cohort analysis important for reducing churn?
It allows you to pinpoint exactly when users are leaving. Instead of just seeing that churn is high, you can identify if users are dropping off during the first 24 hours (onboarding issue) or after three months (value gap), allowing you to fix the specific leak in the bucket.
6. How does cohort analysis help improve product decisions?
It keeps your decisions grounded by showing the actions that lead to value and the steps where users lose momentum. By comparing cohorts before and after a feature launch, you can see if the change actually improved long-term retention or just created a temporary spike in activity.
7. How can I set up behavioral cohorts in analytics?
Setting these up requires defining a “starting event” (the action that qualifies someone for the group) and a “return event” (the action that proves they are still active). Once these specific user actions are tagged in your tracking plan, the analytics platform clusters those users automatically so you can monitor their lifecycle without manual data entry.
8. How can I use cohort analysis to track content audience retention?
You can group readers by the first article they read or by the month they subscribed to your newsletter. By tracking these cohorts, you can see which topics or content pillars successfully turn one-time visitors into recurring audience members and which ones fail to drive return visits.
9. What tools are used for cohort analysis?
Most teams use a mix of product analytics and data visualization tools depending on their technical needs. While specialized platforms like Usermaven are designed to automate the grouping process and track behavior in real-time, more technical teams might use SQL to query their databases directly or BI tools like Tableau to build custom retention dashboards.
10. How does cohort analysis work?
Cohort analysis groups users based on a shared characteristic over a specific timeframe (e.g., users who signed up in January). You then track these groups over time to observe how their behavior, engagement, or retention patterns differ, helping you identify what drives long-term loyalty.
A SaaS marketing team evaluates six attribution tools over three months and signs a $ 24,000-a-year contract. Eight weeks into implementation, they realize the tool tracks pipeline beautifully but has no idea what happens to a customer after the deal closes. Choosing the wrong attribution tool is expensive twice, once in the contract, once in […]
Your traffic is up. But revenue isn’t. What’s going on? When marketers open their web analytics dashboard, sessions are usually the first number they check. It tells you how many times people visited your site, but a rising session count doesn’t always mean things are going well. In analytics, the number of sessions is the […]
Every company wants better data. But better data does not come from adding another dashboard, tracking every possible event, or giving the data team a long list of reports to build. That is where many analytics implementation projects start to go wrong. The tool may be powerful. The data may be there. The team may […]