Maven AI can analyze your data for you. Just ask.Try it now→
  • Core platformMulti-Touch AttributionSee which channels, campaigns, ads, content, and touchpoints drive conversions, pipeline, and revenue.Google AdBlogLinkedIn AdDemoRevenueCross-channelPaid adsConversion syncExplore multi-touch attribution

    Analytics & Journeys

    Understand user behavior

    Website AnalyticsTurn traffic into insight.Product AnalyticsUnderstand engagement and retention.FunnelsFind and fix conversion drop-offs.User JourneysUnderstand paths to purchase.TrendsSpot patterns and changes over time.DashboardsBring key metrics into one view.

    Data & Intelligence

    Ask, analyze, and act

    Maven AIAsk questions about your data.MCPNewConnect AI agents to your data.EventsNewCapture the actions that matter.SegmentsGroup users by behavior and attributes.Contact ProfilesUnify visitor, user, and account activity.Reports & AlertsNewStay updated on key metrics.
  • BY BUSINESS

    SaaS brandsConnect acquisition, activation, retention, and MRR.Ecommerce brandsSee what drives ROAS, revenue, & repeat sales.AgenciesProve marketing ROI with client-ready reporting.

    BY USE CASE

    Reduce CACCut wasted spend & acquire customers for less.Pipeline attributionKnow what marketing creates pipeline.Full-funnel revenue attributionConnect marketing touchpoints to revenue.Paid ads attributionKnow which ads actually drive revenue.Improve ROASPut budget behind campaigns with stronger returns.

    BY TEAM

    Marketing teamsConnect campaigns, pipeline, and revenue in one view.Product teamsTurn product usage into better decisions.Growth teamsFind conversion leaks and scale what works.Founders & CMOsGet marketing numbers you can confidently act on.
    See how Usermaven fits your needs.View all solutions
  • Integrations
  • LEARN

    BlogAttribution insights, analytics tips, & strategies.Analytics glossaryLearn analytics terms and concepts.Free toolsSimplify everyday marketing tasks.

    EXPLORE

    Case studiesReal stories from businesses using Usermaven.ReviewsHear directly from Usermaven customers.Product updatesNew features, improvements, & product updates.Affiliate programEarn 30% recurring commissions for referring customers.

    SUPPORT

    Help docsSetup instructions and step-by-step product guides.Guided setupGet expert help setting up Usermaven.System statusCheck Usermaven's current status.
    Get practical insights on attribution and analytics.Visit the blog
  • Pricing
Sign inBook a demo
Multi-Touch AttributionSee which channels, campaigns, ads, content, and touchpoints drive conversions, pipeline, and revenue.
Analytics & JourneysUnderstand user behaviorWebsite AnalyticsTurn traffic into insight.Product AnalyticsUnderstand engagement and retention.FunnelsFind and fix conversion drop-offs.User JourneysUnderstand paths to purchase.TrendsSpot patterns and changes over time.DashboardsBring key metrics into one view.
Data & IntelligenceAsk, analyze, and actMaven AIAsk questions about your data.MCPNewConnect AI agents to your data.EventsNewCapture the actions that matter.SegmentsGroup users by behavior and attributes.Contact ProfilesUnify visitor, user, and account activity.Reports & AlertsNewStay updated on key metrics.
BY BUSINESSSaaS brandsConnect acquisition, activation, retention, and MRR.Ecommerce brandsSee what drives ROAS, revenue, & repeat sales.AgenciesProve marketing ROI with client-ready reporting.
BY USE CASEReduce CACCut wasted spend & acquire customers for less.Pipeline attributionKnow what marketing creates pipeline.Full-funnel revenue attributionConnect marketing touchpoints to revenue.Paid ads attributionKnow which ads actually drive revenue.Improve ROASPut budget behind campaigns with stronger returns.
BY TEAMMarketing teamsConnect campaigns, pipeline, and revenue in one view.Product teamsTurn product usage into better decisions.Growth teamsFind conversion leaks and scale what works.Founders & CMOsGet marketing numbers you can confidently act on.
Integrations
LEARNBlogAttribution insights, analytics tips, & strategies.Analytics glossaryLearn analytics terms and concepts.Free toolsSimplify everyday marketing tasks.
EXPLORECase studiesReal stories from businesses using Usermaven.ReviewsHear directly from Usermaven customers.Product updatesNew features, improvements, & product updates.Affiliate programEarn 30% recurring commissions for referring customers.
SUPPORTHelp docsSetup instructions and step-by-step product guides.Guided setupGet expert help setting up Usermaven.System statusCheck Usermaven's current status.
Pricing
Sign inBook a demo
Blog›Data management

What is a data stack and how do you build one?

Lauren BrooksLifecycle Marketing StrategistSep 15, 20224 min read
Back to blog

On this page

  1. What is a data stack?
  2. The benefits of using a data stack
  3. How to build a data infrastructure
  4. Best practices for managing your data stack
  5. Tips for troubleshooting your data stack
  6. Conclusion
  7. FAQs
On this page7
  1. What is a data stack?
  2. The benefits of using a data stack
  3. How to build a data infrastructure
  4. Best practices for managing your data stack
  5. Tips for troubleshooting your data stack
  6. Conclusion
  7. FAQs
Share
Usermaven

Marketing attribution tool that connects every dollar to revenue.

  • Rated 4.9 / 5 StarsCapterra
  • #1 Product of the Week in Marketing
  • #2 Product of the Day
Add Usermaven as a preferred source on Google
Features
  • Multi-Touch Attribution
  • Maven AI
  • Website Analytics
  • Product Analytics
  • Funnels
  • User Journeys
  • Contact Profiles
  • MCP
  • Events
  • Segments
  • Trends
  • Dashboards
Solutions
  • Agencies
  • SaaS brands
  • Ecommerce
  • Marketing teams
  • Product teams
  • Growth teams
  • Founders & CMOs
  • Reduce CAC
  • Paid ads attribution
  • Improve ROAS
  • Pipeline attribution
  • Full-funnel attribution
Compare
  • HockeyStack
  • Cometly
  • Dreamdata
  • Triple Whale
  • Hyros
  • Ruler Analytics
  • GA4
  • Mixpanel
  • Rockerbox
  • Northbeam
  • Fathom
  • PostHog
Resources
  • Blog
  • Analytics glossary
  • Case studies
  • Product updates
Support
  • Help docs
  • Guided setup
  • Usermaven status
  • Contact
Company
  • About us
  • Reviews
  • Affiliate program
  • Write for us
  • Brand assets

© 2026 Usermaven Inc. All rights reserved.

Privacy policyCookie policyTerms of serviceGDPRCCPALLMs.txt

A data stack is a term used to describe the collection of software products and tools that are used to collect, store, process, and analyze data. Typical data stacks will include the following:

  • A database (or multiple databases)
  • A web server
  • An application server
  • Scripts or applications that perform tasks such as reverse ETL (extract-transform-load), reporting, or analytics.
What is a data stack?

In today’s digital world, data is the most valuable commodity that a company has. But by itself, a piece of data can be pretty useless. In order to extract value from it, it must be first collected, analyzed, and put into use in an analytic process.

The technologies involved in moving data from one step to another are collectively called data stack.

They are structured like a kitchen. Before you can cook, you need to gather your ingredients and store them somewhere. Then, you prepare and cook them.

Like the kitchen, a stack is central. If things were stored in different rooms, it would be difficult to know which recipe to use. However, if everything were together, it would be easy to visualize several different meals.

Much like a kitchen, cloud data warehouses are a central hub where data integration happens. Traditional warehouses were difficult to use and the data was siloed. On-demand cloud data warehouses are friendlier to analysts’ self-serve technologies and can lower costs and improve performance with elastic storage.

Let’s take a look at four key elements of what is a data stack.

1. Loading

A part of the technology ecosystem that is responsible for transporting data from one location to another.

2. Warehousing

Data storage technologies store all your data in one single place. Whether you’re comparing object storage vs block storage, understanding these models can help you choose the most efficient solution for your data stack. They are the foundation of modern-day data integration.

3. Transforming

This is the step that transforms raw data into refined data for analysis. Most businesses use a data preparation tool to do this.

4. Analysis

During the data analysis stage, organizations begin to glean valuable insights from their collected data by feeding it into machine learning models, creating custom reports and dashboards, or building out new data-driven services.

Organizations are realizing that legacy data tools are inadequate for solving the big data problems that they face. They are currently in the process of migrating data from their older, more outdated systems to a modern cloud computing data stack. Many organizations leverage specialized cloud native development services to ensure their data infrastructure is built with scalability, resilience, and modern architectural patterns from the ground up.
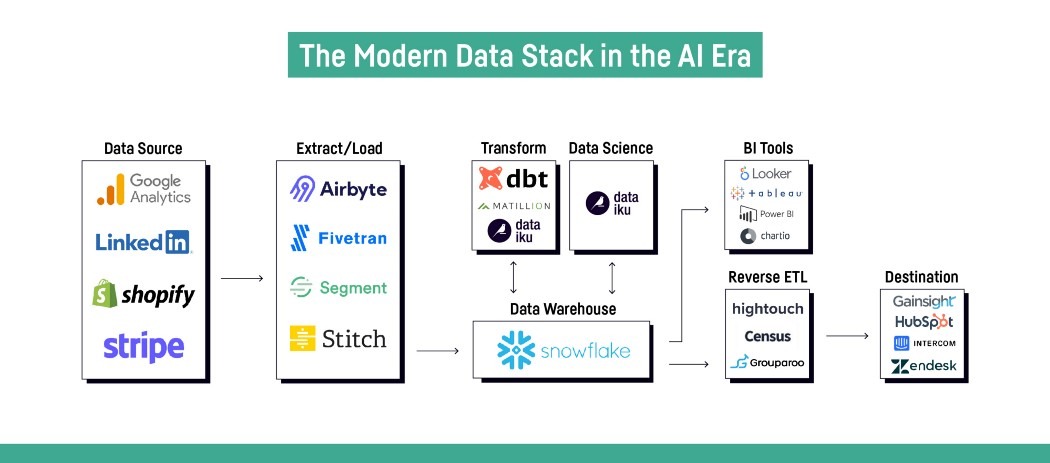
Data stack in AI era

(Source)

The benefits of using a data stack

A data stack can help you:

Organize your data

Keep your customer data organized and accessible. Along with data integration, your data stack can help you track changes to your data over time.

Process your data

Process your data for data analysis and convert your data into a format that is easier to work with.

Visualize your data

Visualize your customer data pipelines through your data stack. Data visualization can help you understand your data better and make better decisions.

Store your data

Data warehouses can be a valuable tool for any business. Modern data storage can help you manage and process your data more effectively. If you are not using a data stack, you may be missing out on some of the benefits that data warehouses can offer.

How to build a data infrastructure

Building a data stack can be daunting, but it doesn’t have to be.

Here are a few tips to get you started:

1. Define your goals

What do you want to achieve with your data stack?

Do you want to collect data models from multiple sources?

Do you want to analyze it in real-time?

Do you want to visualize it in an interactive dashboard?

2. Choose the right tools

There are a lot of great data stack options out there. But not all of them will be a good fit for your needs or help reduce data quality risks. Do your research and choose the customer data platforms that will work best for you.

3. Get help from experts

If you’re not sure where to start, reach out to an expert like a data scientist. They can help you choose the right tools and set up your data analytics stacks so they work for you.

Best practices for managing your data stack

The term “data stack” is often used in the context of data science and big data.

There is no one-size-fits-all solution for managing data but there are some best practices that can help your data teams.

First, it’s important to have a clear understanding of your data integration goals. This will help you choose the right tools for the job.

Second, you need to be able to effectively manage and monitor your data stack. This includes keeping track of what data is being collected, where it’s being stored, and how it’s being processed.

Third, you need to have a plan for dealing with data growth. As your data stack grows, so will the amount of data that you need to manage.

Lastly, you need to be able to troubleshoot and debug your data stack. This includes being able to identify and fix problems that occur during data collection, processing, or visualization.

Following these best practices will help you build a robust and scalable data stack that meets your needs.

Tips for troubleshooting your data stack

If you’re working with data, chances are you’re going to run into some issues at some point. Whether it’s something as simple as a data error or something more complex like trying to figure out why your data isn’t loading properly, troubleshooting your data stack can be a challenge.

Here are some tips to help your data teams troubleshoot it.

1. Check your data sources

The first step in troubleshooting it is to check your data sources. Make sure that the data you’re trying to access is actually available and that there aren’t any errors in the data itself.

2. Check your connection

If you’re having trouble loading data, the problem may be with your connection. Make sure that you’re connected to the internet and that your connection is stable.

3. Check your code

If you’re having trouble with your data, the problem may be with your code. Check your code for any errors and make sure that it’s running properly.

4. Ask for help

If you’re still having trouble, don’t hesitate to ask for help from data scientists. There’s no shame in admitting that you need help and there are plenty of people out there who would be happy to help you troubleshoot your data stack.

Conclusion

A data stack is a powerful tool that can help businesses collect, store, process, and analyze data. When used correctly, data science can provide insights that would otherwise be unavailable.

If you’re considering implementing a data stack at your business, be sure to consult with an experienced professional to ensure success.

See what's working. Fix what's not. Grow faster.

Schedule a demo→

FAQs

What is the modern data stack?

A data stack is a collection of software tools that are used to collect, store, process, and analyze data. The modern data stack typically includes a database, a data processing platform, and a visualization tool.

What is the stack in data structure?

A stack is a data structure that stores data in a last-in, first-out (LIFO) manner.

Find out more about:
  • Data management

Updated Mar 11, 2026

Written by

Lauren Brooks

Lifecycle Marketing Strategist

Lauren Brooks is a lifecycle marketing strategist with 4+ years of experience helping SaaS businesses create meaningful customer experiences. She specializes in user engagement, retention, and conversion optimization, helping brands build stronger customer relationships beyond acquisition.

All articles by Lauren →
Keep reading

You might be interested in

Data management

What is data discrepancy? Causes, types & how to fix it

Numbers rarely lie. But sometimes they don’t agree. You open two analytics tools expecting the same report. One shows 10,000 visits. The other shows 8,700. Suddenly, you are left wondering which number is correct. This situation is known as a data discrepancy. A data discrepancy happens when different systems report different values for the same […]

Imrana EssaMar 11, 2026
Data management

What is first-party data [and its role in web analytics]

Imagine this: you’re running a café, but instead of observing your customers, you rely on a stranger’s vague notes. They say things like, “Someone likes coffee” or, “People seem to enjoy pastries.” But which coffee? What kind of pastries? And who are these people anyway? That’s the reality of relying on third-party data – vague, […]

Adeel KhanDec 11, 2024
Data management

[5 Top tips] Are you following these data governance best practices for your website?

Managing data without the right tool and framework can quickly turn into a nightmare – data that’s inaccurate, hard to find, or even non-compliant. It’s a mess no one wants to deal with, but without following data governance best practices, it’s a risk every website faces. The trouble is that most of us don’t realize […]

Adeel KhanJan 7, 2025