A SaaS marketing attribution strategy explains how campaigns, customer interactions, product activity, and sales touchpoints receive credit for pipeline and revenue.
Building that strategy is difficult because SaaS journeys rarely end at a form submission or signup. A prospect may discover the brand through content, return through paid search, start a trial, activate a feature, speak with sales, and subscribe months later.
Several stakeholders may also participate in the same purchase while marketing, product, CRM, and billing data remain separated.
The result is one of the most persistent SaaS marketing attribution challenges: teams can see activity in individual platforms but cannot explain which investments produce valuable customers.
This guide provides a nine-step framework for building an attribution strategy that supports budgeting, optimization, pipeline reporting, and recurring-revenue growth.
Key takeaways
A SaaS marketing attribution strategy must connect acquisition with activation, pipeline, paid conversion, retention, expansion, and revenue rather than stopping at leads or signups.
Product-led, sales-led, hybrid, and enterprise SaaS companies need different attribution endpoints because their conversion journeys and sources of customer value differ.
One attribution model cannot answer every business question. First-click, last-click, multi-touch, revenue, and account-level reporting provide different views of performance.
Reliable attribution requires consistent campaign naming, shared conversion definitions, connected customer identities, appropriate attribution windows, and clearly assigned data ownership.
What is a SaaS marketing attribution strategy?
A SaaS marketing attribution strategy is a structured plan for identifying, collecting, connecting, and evaluating the interactions that contribute to customer acquisition and revenue.
It determines:
Iteractions to record: Which customer touchpoints across channels should be tracked and stored.
Conversion stages to measure: Which milestones in the buyer journey count as meaningful outcomes.
Contact and account identification: How individual users and companies are recognized across sessions and devices.
Attribution models to apply: Which logic assigns credit to touchpoints, from first touch to data-driven.
Lookback windows: How far back an interaction remains eligible to receive attribution credit.
Revenue data sources: Which CRM or billing systems feed pipeline and closed-won data into reports.
Decision influence: How attribution insights should shape budget allocation and campaign strategy.
Marketing attribution is the mechanism that assigns credit. The strategy defines how that mechanism should operate across the business.

A wider B2B marketing attribution framework may focus on leads, accounts, opportunities, and closed deals. SaaS attribution must often add product activation, subscription revenue, retention, expansion, and lifetime value.
Attribution strategy vs. attribution model
An attribution model is only one component of the strategy.
A first-click model assigns credit to the interaction that introduced the customer. A last-click model credits the final recorded interaction, while multi-touch models distribute credit across several touchpoints.
A complete strategy also determines:
What qualifies as a conversion
How anonymous users become identified
How contacts are grouped into accounts
Which systems are connected
Which revenue values are used
How reports are reviewed
Who owns data quality
Changing the model cannot fix missing product events, duplicate records, inconsistent campaign names, or disconnected CRM data.
Attribution strategy vs. attribution reporting
Attribution reporting displays the results of the measurement framework.
The strategy comes first. It defines what the reports mean and how they should be interpreted.
Without a clear strategy, teams may build attractive dashboards that combine unrelated metrics, use inconsistent definitions, and encourage incorrect budget decisions.
What a SaaS attribution strategy must measure
The strategy should measure the complete path from acquisition to customer value.
That does not mean every action deserves equal weight. It means each important lifecycle stage should be defined and connected.
Acquisition
Acquisition reporting identifies where prospects first discover and engage with the business.
Relevant sources may include:
Paid search: Ads on Google or Bing
Paid social: LinkedIn, Meta, and similar platforms
Organic search: SEO-driven inbound traffic
Email: Campaigns and newsletters
Affiliates: Partner-driven referrals
Review platforms: G2, Capterra, and alike
Communities: Slack groups, forums, Reddit
Direct traffic: Brand recall or bookmarks
This layer helps explain where demand originates, but it does not show whether the acquired users become successful customers.
Activation
Activation measures whether a signup reaches an important product milestone.
The activation event should represent an early signal that the user has experienced meaningful product value.
Depending on the product, this could include:
Creating the first project
Connecting a data source
Inviting a teammate
Publishing content
Completing an analysis
Using a core feature
Connecting acquisition with product analytics helps teams distinguish channels that generate registrations from those that generate active users.
Qualification and pipeline
Sales-led and hybrid SaaS companies should connect marketing activity with later CRM outcomes.
Important stages may include:
Marketing-qualified lead
Product-qualified lead
Sales-qualified lead
Opportunity created
Pipeline generated
Proposal sent
Closed-won deal
This prevents early conversions from being treated as equal to qualified business opportunities.
Subscription revenue
Paid conversion is a stronger commercial outcome than signup or demo volume.
Revenue attribution should connect subscriptions and deal values with the campaigns, channels, content, product activity, and sales interactions that preceded them.
A proper revenue attribution framework allows teams to compare investments according to financial impact rather than lead volume alone.
Retention and expansion
SaaS value continues after the initial sale.
The strategy should preserve the original acquisition source so teams can compare:
Retention by channel
Churn by campaign
Expansion by source
Renewal rates
Average revenue per account
Customer lifetime value
A channel that generates fewer customers may still be more valuable when those customers stay longer and expand.
How to build a SaaS marketing attribution strategy
The following nine steps turn disconnected tracking into a structured operating system.

1. Define the decisions attribution must support
Start with the decisions the strategy needs to improve. Do not begin by selecting a model or buying software.
Common decisions include:
Which channels should receive more budget?
Which campaigns create qualified pipeline?
Which content assists subscription revenue?
Which sources generate activated users?
Which channels produce high-retention customers?
Which campaigns should advertising platforms optimize toward?
Which acquisition sources generate the strongest lifetime value?
Each question may require a different attribution view.
For example, first-click reporting may help evaluate demand creation, while CRM revenue attribution is more appropriate for identifying channels that produce closed deals.
Create a short decision register with four fields:
| Decision | Primary outcome | Reporting view | Owner |
|---|---|---|---|
| Allocate awareness budget | New qualified accounts | First-click | Demand generation |
| Optimize trial campaigns | Activated trials | Acquisition plus product activity | Growth |
| Compare pipeline sources | Qualified opportunities | Account and CRM attribution | Revenue marketing |
| Evaluate channel profitability | Revenue and LTV | Revenue attribution | Marketing leadership |
This keeps attribution focused on business decisions instead of producing reports without a defined purpose.
2. Map the complete SaaS customer lifecycle
Document the journey from the first anonymous visit through recurring revenue.
A typical lifecycle may include:
First anonymous interaction: A visitor lands on your site before any identity is known.
Content or campaign engagement: They interact with a blog, ad, or email.
Lead capture: A form submission or gated content download ties an identity to the session.
Signup or demo request: Prospect takes a direct step toward your product.
Onboarding: They enter your product experience for the first time.
Product activation: A key action signals real engagement with your core feature.
Product-qualified or sales-qualified status: Behavioral or firmographic signals flag them as ready to buy.
Opportunity creation: A sales opportunity is formally opened in your CRM.
Paid subscription: The prospect converts to a paying customer.
Retention: They continue using the product past the initial period.
Expansion: Usage or spend grows through upsells or seat additions.
Renewal: They commit to another contract cycle.
Use the existing SaaS customer journey to identify where marketing, product, sales, and customer-success interactions occur.
The journey map should also identify:
Which team owns each stage
Which system records the event
Which identifier connects the data
Where tracking is missing
Where the customer can move backward or skip stages
Avoid forcing the journey into a perfectly linear funnel. SaaS prospects may return to content, invite colleagues, restart trials, change devices, or interact with sales at several points.
3. Establish a conversion hierarchy
Effective conversion tracking starts by defining which actions count as meaningful outcomes. The term “conversion” should not refer to every successful action.
Create a hierarchy that separates engagement, acquisition, qualification, and commercial value.
| Conversion level | Example event | Business meaning |
|---|---|---|
| Engagement | Webinar registration | Prospect showed interest |
| Lead | Demo request | Contact entered the funnel |
| Signup | Account created | User accessed the product |
| Activation | Core feature used | User reached initial value |
| Qualification | PQL or SQL created | Account meets defined criteria |
| Pipeline | Opportunity created | Potential revenue entered CRM |
| Revenue | Subscription or deal closed | Customer paid |
| Retention | Subscription renewed | Customer value continued |
| Expansion | Plan or account upgraded | Revenue increased |
The hierarchy should reflect the SaaS sales funnel, but it must use milestones that match the product and go-to-market motion.
For every conversion, document:
Event name
Definition
Trigger
Counting rule
Revenue value
Source system
Responsible team
This prevents a demo request in one platform from being compared with a closed opportunity in another.
4. Select the primary attribution outcomes
Not every report should end at the same conversion.
Choose the primary outcome according to the decision being made.
Leads and signups
Useful for:
Early campaign monitoring
Landing-page testing
Lead-generation volume
Trial acquisition
Limitation: they do not indicate customer quality or revenue.
Activation
Useful for:
Product-led growth
Trial quality
On-boarding performance
Campaign-to-product analysis
Limitation: activation does not guarantee payment or retention.
Pipeline
Useful for:
Sales-led SaaS
Account-based marketing
Revenue forecasting
Evaluating lead quality
Limitation: pipeline can be lost before closing.
Closed revenue
Useful for:
Budget allocation
Channel profitability
Marketing-sourced revenue
Campaign ROI
Limitation: long sales cycles delay feedback.
Retention and LTV
Useful for:
Long-term channel evaluation
Customer-quality analysis
CAC recovery
Sustainable growth decisions
Use SaaS revenue analytics to connect acquisition performance with recurring business outcomes.
5. Standardize campaign and event data
Attribution quality depends on consistent inputs.
Begin with a documented campaign taxonomy.
Standardize:
Source: Where the traffic originated.
Medium: The channel type used.
Campaign: The specific campaign name.
Content: The ad or content variant.
Term: The keyword or targeting term.
Platform: The ad platform used.
Region: The geographic target area.
Audience: The segment being targeted.
Creative: The visual or copy version.
Use consistent UTM parameters across paid campaigns, email, partnerships, events, and other trackable links.
For example, do not allow the same source to appear as:
linkedinLinkedInlinkedin_adspaid-linkedinli
Standardize product and conversion events in the same way.
Avoid creating several event names for the same action, such as:
trial_startedstart_trialfree_trialsignup_trial
Create one approved event name, definition, owner, and trigger.
Every major outcome should also carry the identifiers required to connect it with the user, account, campaign, deal, and transaction.
6. Connect marketing, product, CRM, and billing systems
SaaS attribution usually breaks when the lifecycle is divided across separate systems.
The data architecture should connect:
Advertising platforms
Website analytics
Product analytics
Marketing automation
CRM
Subscription billing
Data warehouse or finance records
The purpose is not to copy every field into one database. The goal is to preserve the relationships between acquisition, behavior, pipeline, and revenue.
For example:
A paid campaign generates a website visit.
The visitor creates an account.
Product tracking records activation.
The account becomes a qualified opportunity.
CRM records the closed deal.
Billing records subscription and expansion revenue.
Each stage should remain connected with the original campaign and customer identity.
Use server-side tracking where appropriate to improve event reliability and send verified business outcomes from back-end systems.
Also document a single source of truth for which system owns each metric:
| Metric | Recommended owner |
|---|---|
| Ad spend and impressions | Advertising platform |
| Website behavior | Website analytics |
| Product activity | Product analytics |
| Lead and opportunity stages | CRM |
| Subscription transactions | Billing platform |
| Recognized revenue | Finance system |
| Cross-channel credit | Attribution platform |
7. Resolve users, contacts, and accounts
SaaS attribution cannot rely only on individual browser sessions.
A visitor may interact anonymously before signing up. The same person may later use another device, while several colleagues participate in the same purchase.
The strategy should connect:
Anonymous visitor
Identified user
CRM contact
Company or account
Opportunity
Subscription
Revenue
B2B buying decisions frequently involve several stakeholders. Salesforce notes that an average deal can involve six to ten decision-makers, many of whom engage with marketing content, advertisements, or events during the process. Account and buying-group measurement is therefore essential for sales-led and enterprise SaaS.
Use shared identifiers such as:
User ID
Workspace ID
Account ID
CRM contact ID
Company domain
Deal ID
Subscription ID
Account-level reporting should preserve the journeys of individual contacts without treating the account as one anonymous block.
8. Select attribution models and windows by decision
Do not choose one model and apply it to every report.
Different models answer different questions.
First-click: First-click attribution identifies the source that introduced the customer.
Last-click: Last-click attribution identifies the final recorded interaction.
Linear: Linear attribution distributes credit evenly across all touchpoints.
Time-decay: Time-decay attribution gives more credit to recent interactions.
U-shaped: U-shaped attribution emphasizes discovery and conversion touchpoints.
Data-driven: Data-driven attribution uses observed conversion patterns.
Custom: Custom attribution applies business-specific weights.
Review the full guide to marketing attribution models before assigning each model to a reporting decision.
The attribution window should also reflect the observed buying cycle.
Google defines a conversion window as the period after an ad interaction during which a later conversion can be recorded. Its guidance recommends choosing a window that accounts for the typical time customers take to convert. Short windows can exclude conversions that occur later in the sales cycle.
Analyze:
Time from first visit to signup
Time from signup to activation
Time from lead to opportunity
Time from opportunity to close
Time from first touch to paid conversion
Use an attribution window that captures the meaningful portion of the journey without giving unlimited credit to very old interactions.
9. Build reporting, ownership, and governance
The attribution system needs operational rules after tracking is launched.
Create a marketing attribution dashboard that connects marketing inputs with lifecycle outcomes.
The dashboard should include:
Spend: Total budget allocated across all marketing channels and campaigns.
Leads: Number of prospects showing initial interest in your product.
Signups: Users who have registered or created an account.
Activated users: Signups who have completed a meaningful action inside the product.
Qualified accounts: Accounts that match your ideal customer profile and show buying intent.
Opportunities: Qualified accounts actively moving through your sales pipeline.
Pipeline: Total value of deals currently in progress.
Closed revenue: Revenue generated from won deals within a given period.
Trial-to-paid conversion: Percentage of trial users who convert to a paying plan.
Customer acquisition cost: Average spend required to acquire one new paying customer.
Retention: Rate at which customers continue using your product over time.
Lifetime value: Total revenue a customer is expected to generate across their entire relationship with you.
Do not place every metric in one undifferentiated view.
Build separate reporting layers for:
Campaign delivery
Acquisition
Product activation
Pipeline
Revenue
Retention and expansion
Assign ownership for:
Campaign naming
Event definitions
CRM stages
Revenue fields
Identity resolution
Dashboard maintenance
Data-quality audits
Create a change log whenever conversion events, CRM stages, product milestones, or attribution settings are updated.
SaaS attribution strategy by go-to-market motion
The strategy should reflect how the company acquires and converts customers.
| SaaS motion | Primary attribution outcome | Essential data | Recommended reporting focus |
|---|---|---|---|
| Product-led | Activation and paid conversion | Acquisition, onboarding, product events, billing | Campaign-to-product journey |
| Sales-led | Pipeline and closed revenue | Marketing, contacts, accounts, opportunities | Account and CRM attribution |
| Hybrid | Product qualification and revenue | Marketing, product, CRM, billing | Product-assisted pipeline |
| Enterprise | Account engagement and pipeline | Buying committees, offline activity, deals | Account-level multi-touch attribution |
Product-led SaaS
Product-led attribution should connect the original source with:
Signup
Onboarding
Activation
Feature adoption
Team invitations
Product-qualified status
Subscription
Retention
The strategy should compare channels by activated and retained users rather than signup volume.
Sales-led SaaS
Marketing contacts should be associated with accounts and deals so buying-committee activity is not fragmented.
This connection also gives B2B SaaS analytics the account, pipeline, and revenue context needed to evaluate sales-led performance.
Sales-led attribution should prioritize:
Account engagement
Demo requests
Qualified leads
Opportunities
Pipeline
Closed revenue
Marketing contacts should be associated with accounts and deals so buying-committee activity is not fragmented.
Hybrid SaaS
Hybrid companies need to connect product and sales signals.
A trial may create the initial opportunity, but product usage, marketing nurture, and sales conversations can all influence conversion.
Report:
Product-assisted opportunities
Sales-assisted subscriptions
Activation before opportunity creation
Product usage before close
Campaign-to-revenue journeys
Enterprise SaaS
Enterprise attribution requires long windows, account-level identity, offline activity, and several conversion stages.
The strategy should include:
Stakeholder engagement
Account penetration
Opportunity progression
Sales meetings
Events
Procurement stages
Contract value
Which attribution models to use for different decisions
Attribution models should be treated as reporting perspectives, not competing versions of absolute truth.
| Business question | Recommended view |
|---|---|
| Which channels introduce qualified prospects? | First-click |
| Which channels capture existing demand? | Last-click |
| Which interactions assist conversion? | Linear or multi-touch |
| Which recent touches accelerate conversion? | Time-decay |
| Which lifecycle milestones deserve more weight? | U-shaped or custom |
| Which patterns correlate with conversion? | Data-driven |
| Which campaigns generate commercial outcomes? | CRM and revenue attribution |
Measuring demand creation
Use first-click reporting to identify channels that introduce prospects before branded demand exists.
This can highlight:
Non-branded organic search
Paid social
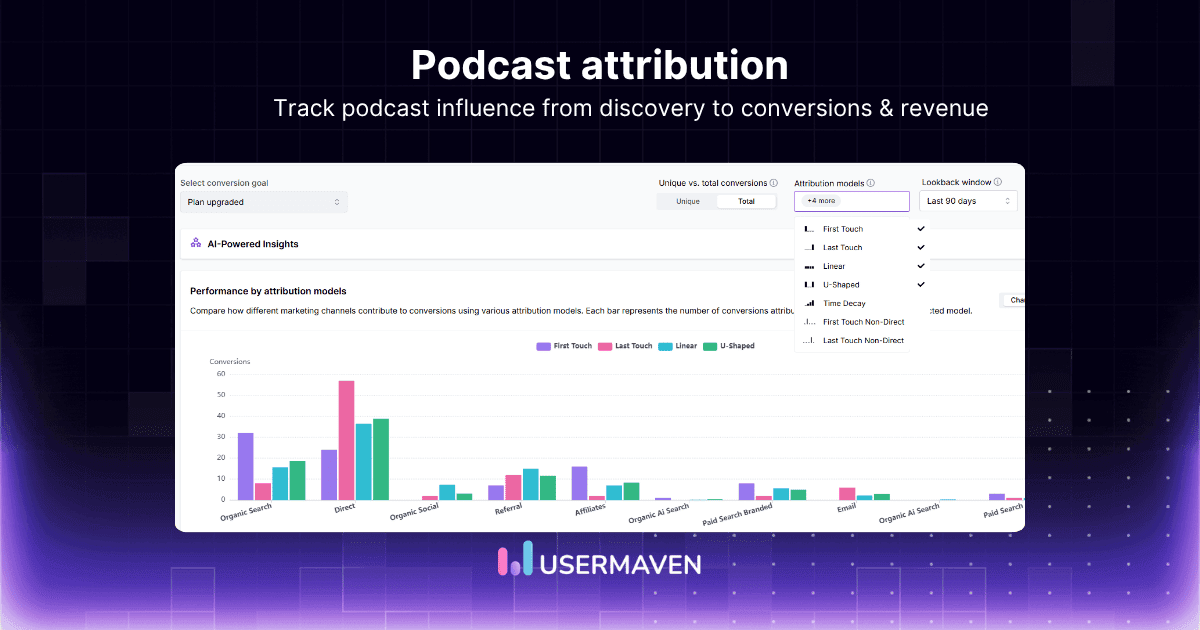
Podcasts
Communities
Partnerships
Educational content
First-click should not be used alone for revenue allocation because it ignores later interactions.
Measuring demand capture
Last-click reporting helps identify the channels that close or capture existing demand.
These may include:
Branded search
Direct traffic
Retargeting
Comparison pages
Sales emails
Last-click can overvalue channels that appear near the end of journeys.
Measuring the full journey
Use multi-touch attribution when several interactions need to receive credit.
Multi-touch models can provide context around:
Content-assisted conversions
Cross-channel journeys
Webinar influence
Product and marketing overlap
Long sales cycles
They still depend on the interactions that were successfully recorded.
Measuring revenue contribution
Revenue attribution connects campaigns with pipeline and closed financial outcomes.
Use it to evaluate:
Marketing-sourced pipeline
Revenue by campaign
Customer acquisition cost
Return on ad spend
Revenue by content
Channel profitability
Metrics for evaluating the attribution strategy
A successful strategy should improve data quality, business decision-making, and the digital marketing metrics and KPIs used to evaluate performance.
Data-quality metrics
Track: Monitor these to ensure your attribution data is clean and trustworthy before drawing any conclusions.
UTM coverage: Percentage of campaigns using approved UTMs
Source attribution: Percentage of conversions with a source
CRM linkage: Percentage of CRM deals linked to contacts
Account matching: Percentage of subscriptions linked to accounts
Duplicate events: Rate of duplicate event firing across your stack
Unidentified conversions: Percentage of conversions with no traceable source
Revenue matching: How closely attributed revenue aligns with actual billing
Integration failures: Rate at which your connected tools fail to pass data
Acquisition metrics
Track: These show how efficiently each channel turns spend into qualified users at different funnel stages.
Cost per lead: Total spend divided by leads generated in a given period
Cost per signup: Spend required to bring one user to a completed signup
Cost per activated user: Spend needed to produce a user who completes a key product action
Trial conversion rate: Share of trial users who convert to a paid plan
Channel conversion rate: Conversion performance broken down by traffic source
Campaign conversion rate: Conversion performance at the individual campaign level
Pipeline metrics
Track: These connect marketing activity to sales outcomes and help you understand how leads move toward revenue.
MQLs: Marketing-qualified leads passed to sales based on defined criteria
SQLs: Sales-qualified leads accepted and worked by the sales team
Opportunities: Deals actively in progress within the sales pipeline
Marketing-sourced pipeline: Total pipeline value originating from marketing channels
Pipeline velocity: How quickly deals move through each stage toward close
Win rate by source: Percentage of deals won, segmented by the originating channel
Revenue metrics
Track: Revenue metrics tie attribution directly to business outcomes rather than intermediate signals.
Closed revenue by channel: Actual revenue generated, attributed to each acquisition source
Revenue by campaign: Closed revenue broken down at the individual campaign level
Average contract value: Mean deal size across closed customers in a given period
Customer acquisition cost: Total marketing and sales spend divided by new customers acquired
Return on ad spend: Revenue generated relative to paid media investment
CAC payback period: Time required to recover the cost of acquiring a customer
Use the average customer acquisition cost as a business metric rather than comparing advertising cost with early conversions alone.
Retention metrics
Track: Retention metrics reveal whether the customers you acquired actually stay and grow over time.
Retention by source: How long customers from each channel remain active subscribers
Churn by campaign: Cancellation rates segmented by the campaign that drove acquisition
Renewal rate: Percentage of customers who renew at the end of their contract period
Expansion revenue: Additional revenue from upgrades, add-ons, or seat increases
Net revenue retention: Total revenue retained after churn and expansion are both factored in
LTV by channel: Lifetime value of customers grouped by their originating acquisition source
Connect attribution with SaaS LTV to identify sources that generate durable customer value.
How to test and improve attribution accuracy
Attribution should be treated as an ongoing measurement process.
Reconcile systems regularly
Marketing attribution discrepancies between tools do not always mean one system is broken. Platforms can use different windows, identities, counting rules, reporting dates, and revenue sources.
Compare: Running regular reconciliation across your tools catches discrepancies before they distort decisions.
Ads vs. analytics: Advertising conversions matched against analytics events
Analytics vs. product: Signup counts compared to actual product accounts created
Product vs. CRM: Product accounts checked against corresponding CRM contacts
CRM vs. billing: CRM deals verified against active billing subscriptions
Attributed vs. transaction revenue: Attribution totals reconciled with real payment data
Differences do not always mean one system is broken. Platforms can use different windows, identities, counting rules, and reporting dates.
Use the guide to ad platform discrepancies when advertising networks claim overlapping conversions.
Audit individual journeys
Aggregate reports can hide problems. Select real customers and trace their activity across each stage to verify your attribution is recording events correctly.
First acquisition: The original source and channel that brought the user in
Website sessions: Browsing activity before any conversion event occurred
Signup: The moment the user created an account or started a trial
Product usage: Key actions taken inside the product after signup
CRM progression: How the contact moved through pipeline stages
Payment: The subscription or purchase event tied to the customer record
Retention: Whether the customer renewed, expanded, or churned over time
Check whether the recorded source and timeline match the available business records.
Test after every change
Review tracking after changes to any of these areas to confirm events are still firing and data is passing correctly.
Website navigation: Structural changes that affect page paths or URL patterns
Landing pages: New or updated pages used in paid or organic campaigns
Forms: Any changes to lead capture or signup form logic
Product onboarding: Updates to the steps users take after signup
Pricing: Changes to plan structure, pricing tiers, or trial terms
Checkout: Updates to the payment or subscription flow
CRM stages: Modifications to pipeline stages or lead status definitions
Billing: Changes to subscription logic or billing provider configuration
Integrations: Any new or updated connections between your tools
Consent settings: Updates to cookie consent or data collection permissions
Compare attribution models
A major shift between models can reveal how the customer journey is structured. Run comparisons periodically rather than waiting for results to look unusual.
Strong first-click performance: May indicate that top-of-funnel channels are generating real demand
Strong last-click performance: May signal that certain channels are effective at capturing existing demand
Strong assisted credit: Can reveal channels playing an important role in nurturing before conversion
Do not change budgets solely because one model redistributes credit.
Review by cohort
Group customers according to shared attributes to compare performance fairly across different time periods and campaigns.
Acquisition month: When the customer was first acquired
Channel: The source that brought them in
Campaign: The specific campaign responsible for acquisition
Product plan: The plan tier the customer joined on
Industry: The vertical the customer operates in
Account size: Company size or seat count at time of acquisition
Region: Geographic market of the customer
Cohort reporting prevents recent campaigns from being compared unfairly with older campaigns whose revenue has had more time to mature.
How Usermaven supports a SaaS attribution strategy
Usermaven combines marketing attribution, website behavior, product activity, customer journeys, CRM pipeline, and revenue in one platform.
This gives SaaS teams a connected view from first acquisition through conversion and business outcomes.

Connect acquisition with website and product activity
Usermaven can connect marketing sources with:
Website visits
Landing-page activity
Signups
Product events
Funnels
Feature adoption
Activation
Retention
This helps teams compare channels by the quality of the users they generate.
Visualize complete customer journeys
The user journeys feature helps teams inspect how users move across sessions, pages, campaigns, and product interactions.
Journey analysis can reveal:
Repeated visits
Drop-off points
Product-assisted conversions
High-value customer sequences
Apply multiple attribution models
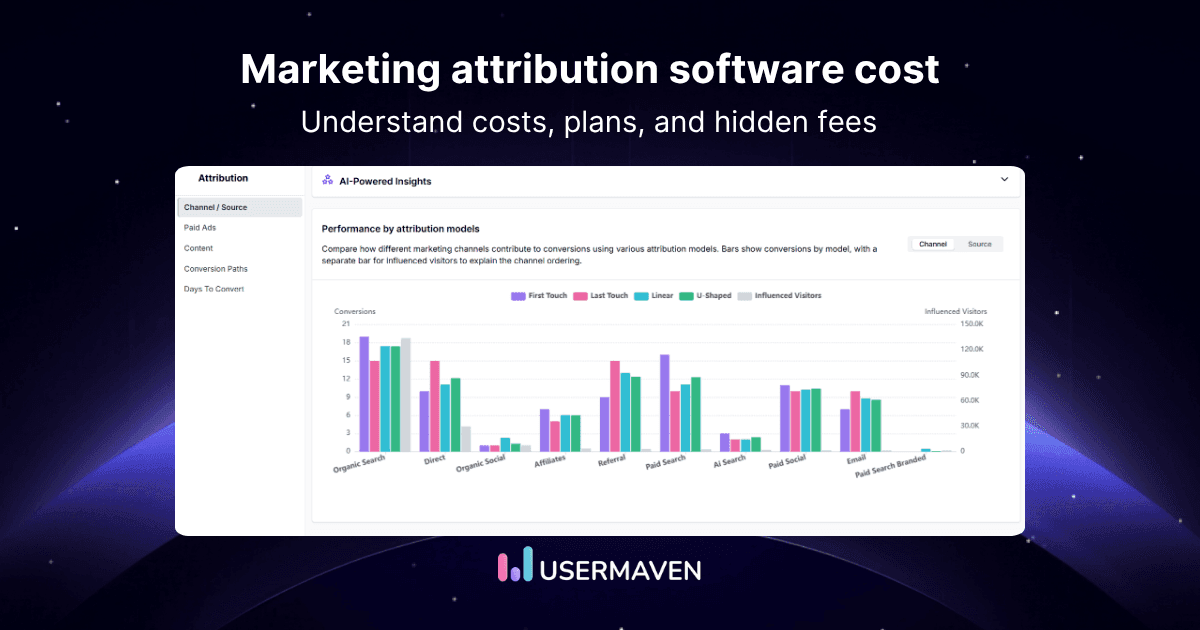
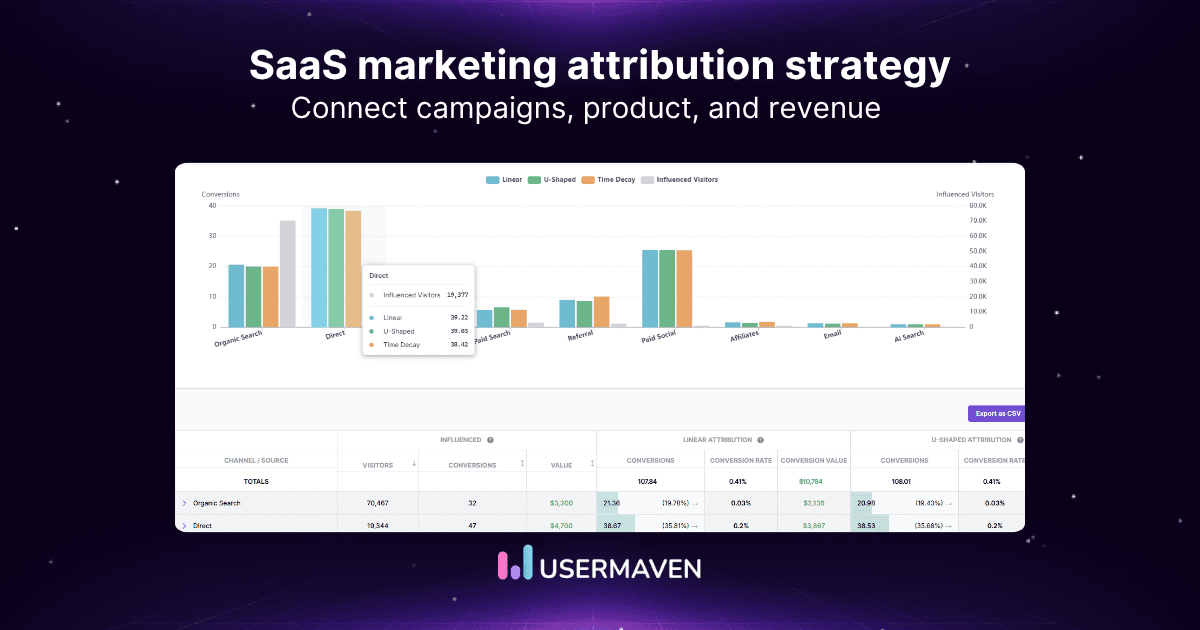
Teams can compare attribution models using one connected dataset instead of reconciling separate reports from every advertising platform.
This makes it easier to distinguish changes caused by:
The attribution model
The attribution window
The recorded journey
The selected conversion
Connect CRM pipeline and revenue
Usermaven supports CRM revenue and pipeline attribution, conversion paths, paid-ad attribution, channel attribution, content attribution, and conversion synchronization on its attribution-focused plans.
These capabilities connect campaigns with:
Qualified leads
Opportunities
Deals
Pipeline
Closed revenue
Return meaningful outcomes to advertising platforms
Conversion synchronization can return later-funnel business outcomes to connected advertising platforms.
Campaign algorithms can then optimize toward qualified leads, subscriptions, or revenue instead of relying only on browser-side form submissions.
Investigate the strategy with Maven AI
Maven AI helps teams investigate attribution, campaigns, funnels, customer journeys, product behavior, and revenue.
It can reduce the need to build a new dashboard for every follow-up question.
Start with self-serve access
Usermaven provides public pricing and a 14-day free trial, allowing teams to evaluate the platform using their own marketing, product, and revenue data.
See Usermaven in action
Book a free demo and discover how powerful analytics can grow your business.
Common SaaS attribution strategy mistakes
Starting with a tool instead of a decision
Identify the decisions, outcomes, and owners before selecting a platform. Once those requirements are clear, compare SaaS marketing attribution tools based on whether they support your product, CRM, pipeline, and revenue measurement needs.
Identify the decisions, outcomes, and owners before selecting a platform.
Treating signup as the final conversion
A signup does not prove activation, payment, retention, or customer value. Attribution should continue through the commercially meaningful lifecycle stages.
Using one model for every decision
First-click, last-click, and multi-touch models provide different perspectives. Using one model for awareness, pipeline, revenue, and retention can create misleading conclusions.
Using a window shorter than the sales cycle
A short attribution window can remove early interactions before revenue appears. Base the window on observed conversion time rather than a platform default.
Tracking contacts without connecting accounts
Individual contact reporting fragments buying committees. Sales-led and enterprise SaaS need contact activity connected with accounts, opportunities, and deals.
Separating marketing from product activity
A campaign may generate many signups that never activate. Product behavior helps distinguish acquisition volume from customer quality.
Optimizing advertising for early conversions
Form submissions provide faster feedback than pipeline or revenue, but they may produce weak optimization signals. Return later-funnel outcomes to advertising platforms where possible.
Ignoring retention and expansion
Initial acquisition does not show whether customers remain, renew, or expand. Channel performance should be evaluated using recurring revenue and lifetime value.
Treating attribution as causality
Attribution assigns credit across recorded interactions. It does not prove that an interaction caused an incremental conversion. Controlled experiments and incrementality testing are required for causal conclusions.
Final verdict
A SaaS marketing attribution strategy should not be limited to choosing a model or combining advertising dashboards.
It should define the decisions attribution supports, map the full lifecycle, establish conversion stages, connect customer identities, standardize data, and link marketing activity with product usage, pipeline, revenue, and retention.
Different models should be used for different questions, while CRM, billing, and finance systems remain responsible for commercial outcomes.
The right SaaS attribution software should provide the connected data and reporting needed to operate that strategy without forcing teams to stitch together several disconnected tools.
Ready to see Usermaven in action? Explore the platform or book a demo for a closer look.
Drive business growth
with AI-powered analytics
FAQs
1. What is a SaaS marketing attribution strategy?
A SaaS marketing attribution strategy is a structured plan for connecting marketing, product, CRM, subscription, and revenue data so conversion credit can support business decisions. It defines the outcomes, attribution models, windows, identities, data sources, reports, and governance rules used by the company.
2. Why does SaaS need a separate attribution strategy?
SaaS journeys can involve long sales cycles, free trials, product activity, buying committees, subscriptions, renewals, and expansion. A strategy designed around one-time purchases may stop too early or ignore important lifecycle outcomes.
3. Which conversion should SaaS attribution use?
The conversion depends on the decision. Signups can support campaign monitoring, activation supports product-led analysis, pipeline supports sales-led reporting, and revenue supports financial evaluation.
4. Which attribution model works best for SaaS?
No single model works best for every question. First-click measures demand creation, last-click measures final demand capture, and multi-touch models help analyze the broader customer journey.
5. How should attribution differ for product-led and sales-led SaaS?
Product-led attribution should connect acquisition with signup, activation, product usage, paid conversion, and retention. Sales-led attribution should connect marketing activity with contacts, accounts, opportunities, pipeline, closed revenue, and buying-committee engagement.
6. Which tool works best with a strong SaaS attribution strategy?
Usermaven works well for SaaS teams that need to connect marketing channels with website behavior, product activity, customer journeys, CRM pipeline, and revenue. It supports multiple attribution models and provides a unified view from acquisition through business outcomes.
Updated

Written by
Junaid Ahmed
Content Writer & Digital Marketer
Junaid Ahmed is a content and copywriter with 3+ years of experience creating research-driven content across SaaS, B2B, ecommerce, and digital marketing. He specializes in turning complex topics into clear, practical content that helps marketers better understand their challenges, evaluate solutions, and make informed decisions. His work spans educational content, industry insights, and actionable marketing guides.
All articles by Junaid →