Google Ads reports 70 conversions. Meta reports 58. GA4 records 44, while the CRM contains 36 qualified leads and the payment platform confirms only 29 purchases.
These numbers can all be technically valid because each platform observes a different part of the customer journey and applies its own measurement rules.
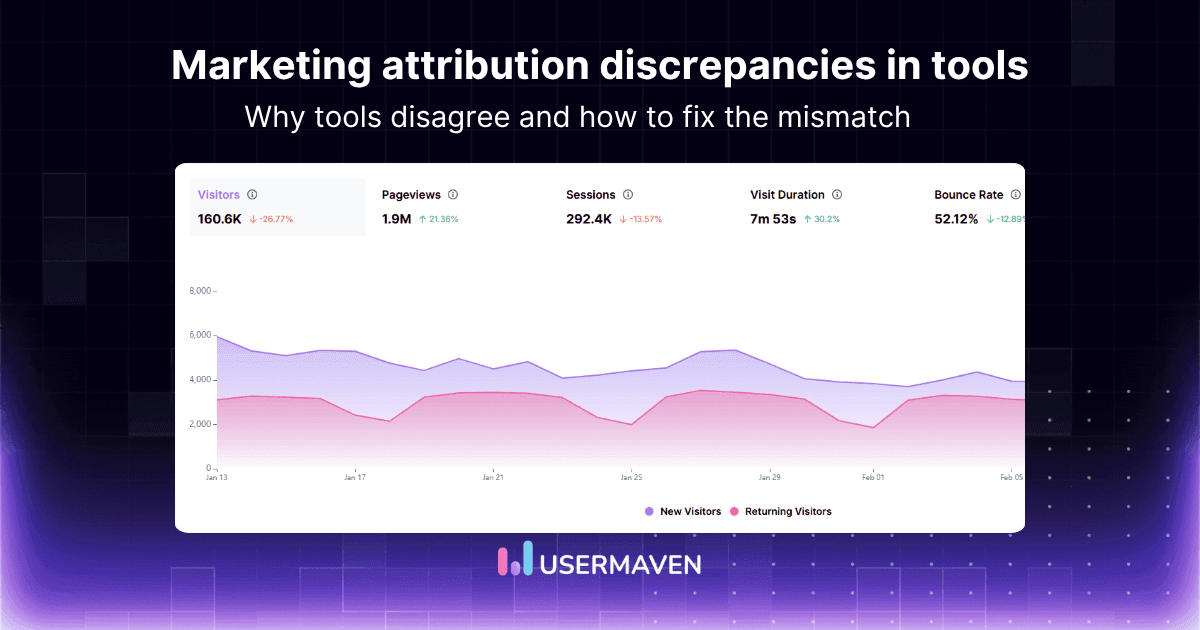
A marketing data discrepancy does not automatically mean one platform is wrong. Some differences are expected, while others indicate missing events, duplicate conversions, inconsistent definitions, or broken integrations.
This guide explains why marketing attribution discrepancies between tools report different results, which discrepancies require investigation, which tools help reconcile the data, and how to build a more reliable measurement framework.
Key takeaways
Attribution tools rarely report identical results because they use different models, attribution windows, identity signals, conversion definitions, counting rules, and reporting dates.
Small and stable differences may be expected, but large or sudden changes can indicate broken tracking, duplicate events, missing campaign parameters, or CRM synchronization problems.
The right attribution tool depends on whether discrepancies originate from browser tracking, ecommerce revenue, CRM data, customer identity, event collection, or cross-platform reporting.
Reliable measurement assigns authority to a different system for each metric rather than forcing advertising, analytics, CRM, and payment platforms to show identical numbers.
What are marketing attribution discrepancies?
In marketing attribution, discrepancies are differences in the conversion, revenue, campaign, channel, or customer results reported by separate advertising, analytics, CRM, ecommerce, and attribution platforms.
Two platforms may provide different answers to the same questions:
How many conversions occurred?
Which channel generated the conversion?
When did the conversion happen?
How much revenue should be reported?
Which interaction receives credit?
Which customer or account converted?
These differences occur because tools do not observe or interpret the customer journey in the same way.
A simple attribution discrepancy example
Consider a customer who follows this path:
Views a Meta advertisement
Clicks a Google Search advertisement
Returns through an email campaign
Purchases through direct traffic
Has the transaction recorded in an ecommerce or CRM system
Meta may claim a view-through conversion because the purchase occurred within its reporting window.
Google Ads may claim the conversion because the customer clicked a paid search advertisement before purchasing.
GA4 may assign credit according to its selected reporting attribution model, while the CRM may record only the final captured source.
The payment system confirms that one transaction occurred but may contain no information about the marketing journey.
Each platform is reporting from its own perspective, but there was still only one customer and one purchase.
Normal discrepancy vs. tracking problem
Not every difference indicates that tracking is broken.
Expected discrepancies can result from:
Different attribution models
Different attribution windows
Click-date vs. conversion-date reporting
View-through conversions
Modeled conversions
Cross-device identity matching
Data-processing delays
Potential tracking or implementation problems include:
Missing tags
Duplicate events
Incorrect revenue values
Broken CRM synchronization
Inconsistent conversion definitions
Missing UTM parameters
Incorrect transaction IDs
Repeated confirmation-page events
The first step is determining whether the difference is structural or caused by an implementation error.
Why marketing attribution tools report different numbers
Marketing attribution discrepancies rarely have one cause. Several measurement differences often operate at the same time.
Different attribution models
Attribution models determine how conversion credit is distributed across recorded interactions.
A platform using first-click attribution assigns the entire conversion to the interaction that introduced the customer.
A platform using last-click attribution gives all credit to the final recorded interaction before conversion.
The linear attribution model distributes credit equally, while the time-decay attribution model gives more value to interactions closer to conversion.
The U-shaped attribution model emphasizes the first and final interactions. Data-driven attribution uses historical patterns, while a custom attribution model applies business-specific rules.
These marketing attribution models can produce substantially different channel and campaign results from the same journey.
Different attribution windows
An attribution window defines how long an interaction remains eligible to receive conversion credit.
One tool may consider clicks from the previous seven days. Another may use a 30-day or 90-day period.
A conversion can therefore appear in one report but not another, even when both platforms recorded the same customer activity.
The appropriate attribution window should reflect the real customer journey and buying cycle rather than whichever default a platform applies.

Self-attribution by advertising platforms
Advertising platforms evaluate conversions influenced by their own campaigns.
Meta does not have complete visibility into Google Ads, email activity, organic search, or sales interactions. Google Ads faces the same limitation when evaluating Meta or other channels.
When a customer interacts with several platforms before converting, more than one platform may claim the same outcome.
These ad platform discrepancies are often structural rather than evidence that one platform fabricated the conversion.
Click-through vs. view-through conversions
Click-through attribution requires a customer to click an advertisement before converting.
View-through attribution may credit a platform when the customer saw an advertisement but did not click it.
This is one reason Meta, display, and video platforms may report more conversions than website analytics or CRM software.
The advertising platform can observe the impression, while the analytics platform may only see the later website visit.
Click date vs. conversion date
Platforms may assign conversions to different dates.
An advertising platform may report a conversion on the date of the original advertisement interaction. An analytics or CRM platform may record it on the day the conversion happened.
A customer who clicks an advertisement in June and purchases in July can therefore appear in different monthly reports.
Google Ads identifies conversion delays, customer conversion time, attribution settings, view-through conversions, cross-device conversions, and lookback windows as common reasons for differences between its reports and third-party systems.
Different conversion definitions
The word “conversion” does not always describe the same event.
A platform may count:
A form submission
A marketing-qualified lead
A demo booking
A product signup
A completed purchase
A subscription
A closed-won deal
A renewal
Comparing 100 form submissions in an advertising platform with 28 qualified opportunities in a CRM does not reveal a tracking discrepancy.
The systems are measuring different stages of the funnel.
Different conversion-counting rules
Platforms can also count the same event differently.
One tool may count every purchase after an advertisement interaction. Another may count only one conversion per user or click.
This matters when a customer:
Submits the same form twice
Buys several products
Makes repeat purchases
Upgrades a subscription
Converts on several goals
Uses more than one device
Counting settings should be aligned before totals are compared.
Cross-device identity gaps
A customer may click an advertisement on a phone, research on a personal laptop, and convert through a work computer.
Advertising platforms may use logged-in identities or modeled data to connect those actions.
Website analytics, an attribution platform, and the CRM may not be able to make the same connection.
As a result, the platforms may agree that a conversion occurred but disagree about the source.
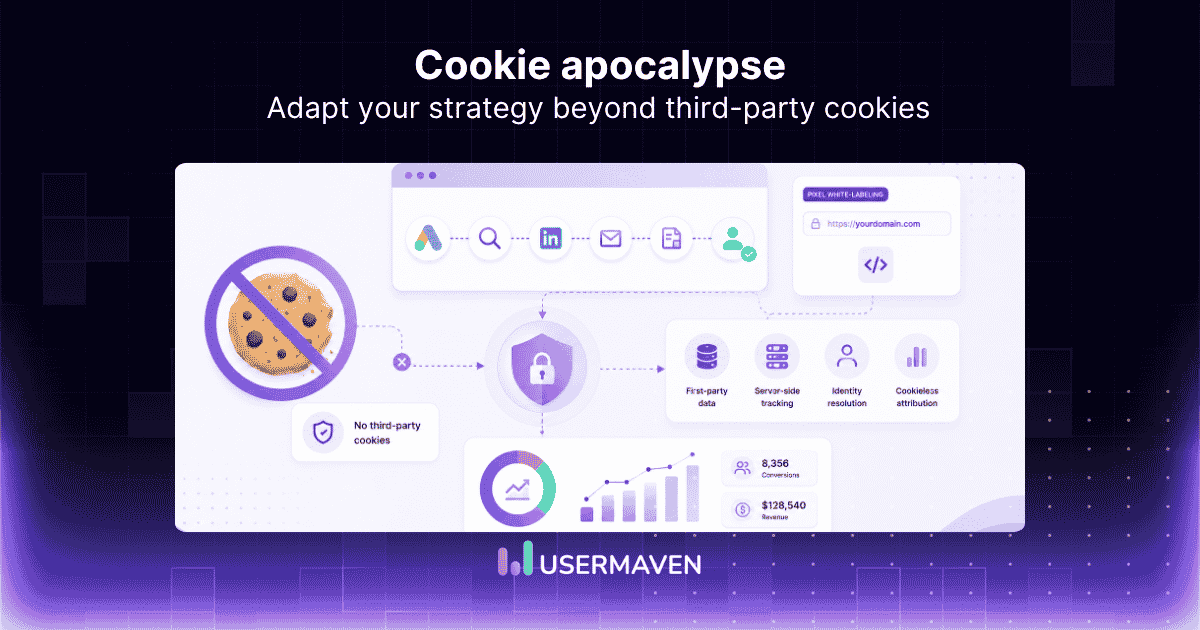
Cookies, consent, and ad blockers
Browser restrictions, ad blockers, privacy controls, and consent choices can prevent tracking scripts from recording every interaction.
Advertising platforms may use aggregated or modeled results to estimate activity that cannot be observed directly.
Independent analytics or CRM software may report only the interactions it actually collected.
Cookieless attribution and first-party measurement can improve coverage, but no method can reconstruct every customer journey perfectly.
Missing or inconsistent UTM parameters
UTM parameters help analytics and attribution tools identify where traffic originated.
Problems arise when campaign links contain:
Missing parameters
Different capitalization
Misspelled campaign names
Inconsistent source values
Conflicting medium values
Redirects that remove parameters
A campaign labeled facebook, Facebook, meta, and paid-social may be divided into several reporting rows.
Consistent UTM parameters make it easier to compare traffic and conversions across tools.
Time-zone differences
A conversion that occurs near midnight may be assigned to different dates when platforms use different account time zones.
This can produce noticeable daily discrepancies even when weekly or monthly totals are relatively close.
Every comparison should use the same date range and time zone.
Reporting and processing delays
Platforms do not always update conversion data immediately.
Some reports require time to process:
Imported CRM conversions
Modeled conversions
Offline events
Invalid-click adjustments
Refunds
Data-driven attribution
Cross-device matches
Google advises allowing for processing and synchronization delays before comparing Google Ads with Google Analytics or third-party reporting. Its troubleshooting guidance also distinguishes conversion windows from attribution-report lookback windows. (Google Ads Help) (Google Help)
Duplicate conversion events
Duplicate conversions occur when the same event is sent more than once.
Common causes include:
Browser and server events firing without deduplication
A CRM event imported through two integrations
A confirmation page being refreshed
A purchase recorded by several tools
A missing transaction ID
A tag installed twice
Test transactions appearing in production data
Unique event and transaction IDs help systems determine whether two records represent the same outcome.
Refunds, cancellations, and revenue adjustments
Advertising platforms may retain the original conversion value after an order is refunded or a subscription is cancelled.
The ecommerce, CRM, payment, or finance system may update the transaction.
This creates a difference between attributed gross revenue and actual retained revenue.
Currency, tax, shipping, and discount differences
One platform may report gross order value, while another excludes:
Tax
Shipping
Discounts
Refunds
Product costs
Currency-conversion fees
Revenue comparisons should use the same financial definition.
CRM lifecycle and data-quality problems
CRM attribution depends on the quality of the CRM records.
Reporting becomes unreliable when the CRM contains:
Duplicate contacts or companies
Missing deal values
Incorrect opportunity stages
Delayed updates
Inconsistent lead-source fields
Unlinked contacts and deals
Manually overwritten source data
Attribution software cannot repair every CRM governance problem automatically.
7 best tools for fixing marketing attribution discrepancies
No tool resolves every type of discrepancy. Some platforms create an independent attribution layer, while others improve ecommerce measurement, standardize event collection, or consolidate raw platform data.
| Tool | Best for | Main discrepancy addressed | Category |
|---|---|---|---|
| Usermaven | SaaS, marketing, and product-led teams | Campaign, behavioral, CRM, and revenue discrepancies | Attribution and behavioral analytics |
| Cometly alternative | Paid-media and B2B teams | Browser tracking and paid-media-to-pipeline gaps | Attribution platform |
| Triple Whale alternative | Shopify and ecommerce brands | Ad-platform claims vs. store revenue | Ecommerce attribution |
| Northbeam alternative | High-spend DTC brands | Cross-channel media-measurement differences | Attribution, MMM, and incrementality |
| Rockerbox alternative | Enterprise omnichannel teams | Online and offline journey fragmentation | Enterprise marketing measurement |
| Segmentstream | Technical data teams | Inconsistent event collection, identity, and routing | Customer data infrastructure |
| Google Analytics 4 | Teams needing a free baseline | Website and advertising-report differences | Web and app analytics |
The categories reflect each vendor’s current product positioning. Usermaven connects attribution with CRM and product analytics, Cometly emphasizes server-side B2B revenue attribution, and Triple Whale focuses on Shopify measurement.
Northbeam and Rockerbox combine attribution with MMM or incrementality, Segment supports event and identity infrastructure, Supermetrics centralizes marketing data, and GA4 provides website and app attribution reporting.
How to diagnose an attribution discrepancy
A structured audit prevents teams from changing tracking or campaign settings before identifying the actual problem.

1. Confirm that the same metric is being compared
Start by checking whether both platforms measure the same outcome.
Confirm:
Event name
Business meaning
Counting method
Revenue definition
Customer type
Campaign scope
Attribution model
A qualified lead should not be compared directly with a form submission or purchase.
2. Align the date range and time zone
Use the same:
Start and end dates
Account time zone
Reporting time zone
Conversion date
Click date
For longer customer journeys, compare both daily and monthly totals.
3. Compare attribution windows
Review each platform’s click-through and view-through windows.
A conversion that qualifies under a 30-day window may be excluded by a seven-day window.
Document the settings before changing them.
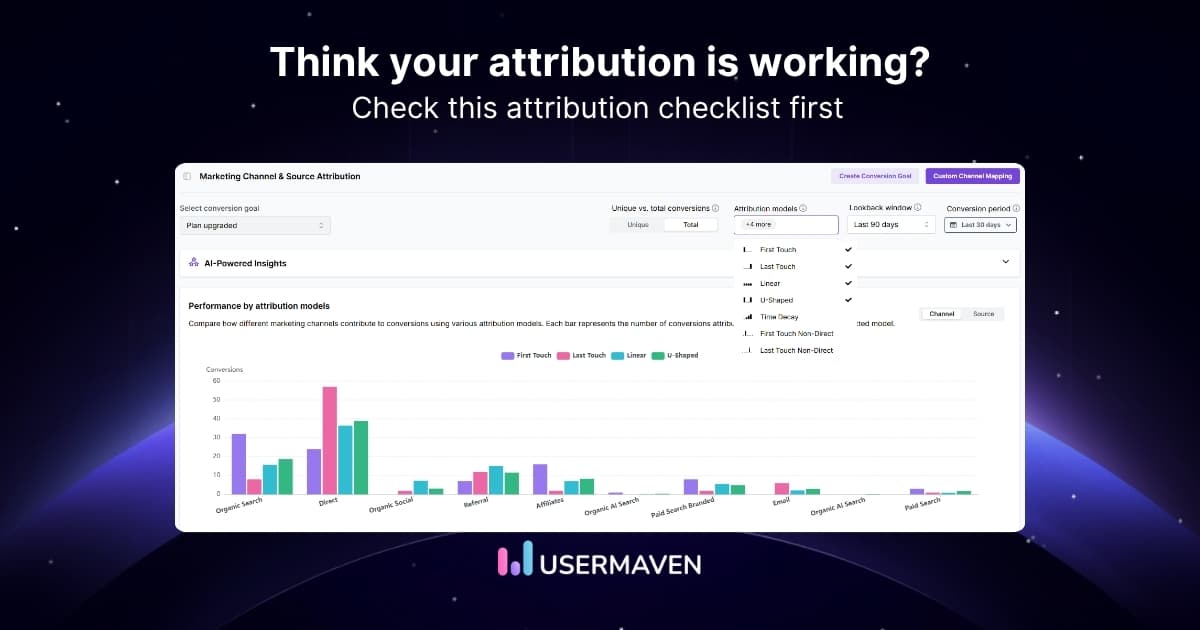
4. Compare attribution models
Confirm whether each platform uses first click, last click, linear, U-shaped, time-decay, data-driven, or custom attribution.
Changing a model can redistribute channel credit without changing the actual number of customers or purchases.
5. Audit the conversion event
Confirm:
Where the event fires
How often it fires
Whether it has a unique ID
Whether browser and server events are deduplicated
Whether internal activity is excluded
Whether the revenue value is correct
Test the complete journey rather than checking only whether a tag exists.
6. Inspect campaign parameters
Review:
UTM source
UTM medium
UTM campaign
Auto-tagging
Redirects
URL capitalization
Landing-page parameters
Unexpected direct or referral traffic often indicates missing or stripped campaign information.
7. Trace individual customer journeys
Select several real conversions and compare their records across:
Advertising platforms
Website analytics
Attribution software
CRM
Ecommerce or payment systems
Customer-level investigation often reveals issues hidden by aggregate dashboards.
8. Validate revenue against the transaction system
Use the system that records completed transactions to confirm actual order or subscription totals.
Then compare attributed revenue against that confirmed amount.
Attribution discrepancy troubleshooting table
| Reported discrepancy | Most likely cause | What to inspect |
|---|---|---|
| Meta reports more conversions than GA4 | View-through attribution or modeled conversions | Meta attribution window and impression settings |
| Google Ads reports more conversions than the CRM | Lead events counted before qualification | Conversion actions and CRM lifecycle stages |
| GA4 reports fewer sessions than advertising clicks | Consent, ad blockers, repeat clicks, or session rules | Consent setup and landing-page tracking |
| CRM revenue exceeds attributed revenue | Missing early sessions or failed identity matching | User IDs, CRM integration, and tracking history |
| Attribution revenue exceeds payment records | Duplicate purchases or gross revenue reporting | Transaction IDs, refunds, tax, and shipping |
| Daily totals differ but monthly totals are close | Time zones or click-date reporting | Account settings and reporting dates |
| Direct traffic is unusually high | Missing UTMs or redirect stripping | Campaign URLs and redirect chains |
| Conversions change several days later | Processing delays or modeled data | Reporting finalization and reprocessing periods |
How to reconcile attribution data between tools
The objective is not to force every report to match. It is to create consistent definitions, reduce preventable differences, and document the remaining variance.
Standardize conversion definitions
Create a measurement dictionary for every important outcome.
Include:
Event name
Business definition
Trigger
Counting method
Revenue field
Source system
Data owner
This prevents teams from using the same conversion label for different funnel stages.
Use consistent campaign naming
Create one taxonomy for:
Channels
Sources
Mediums
Campaigns
Ad groups
Creatives
Landing pages
Apply the same rules across internal teams, agencies, and advertising accounts.
Align attribution settings where possible
Platforms will not offer identical settings, but teams can align:
Attribution windows
Click-through rules
View-through rules
Conversion counting
Date ranges
Time zones
Currency
Record settings that cannot be aligned.
Implement event deduplication
Assign unique identifiers to purchases, leads, subscriptions, and other important events.
Browser, server, CRM, and payment integrations should pass the same ID when they describe the same outcome.
This allows the receiving platform to identify duplicate records.
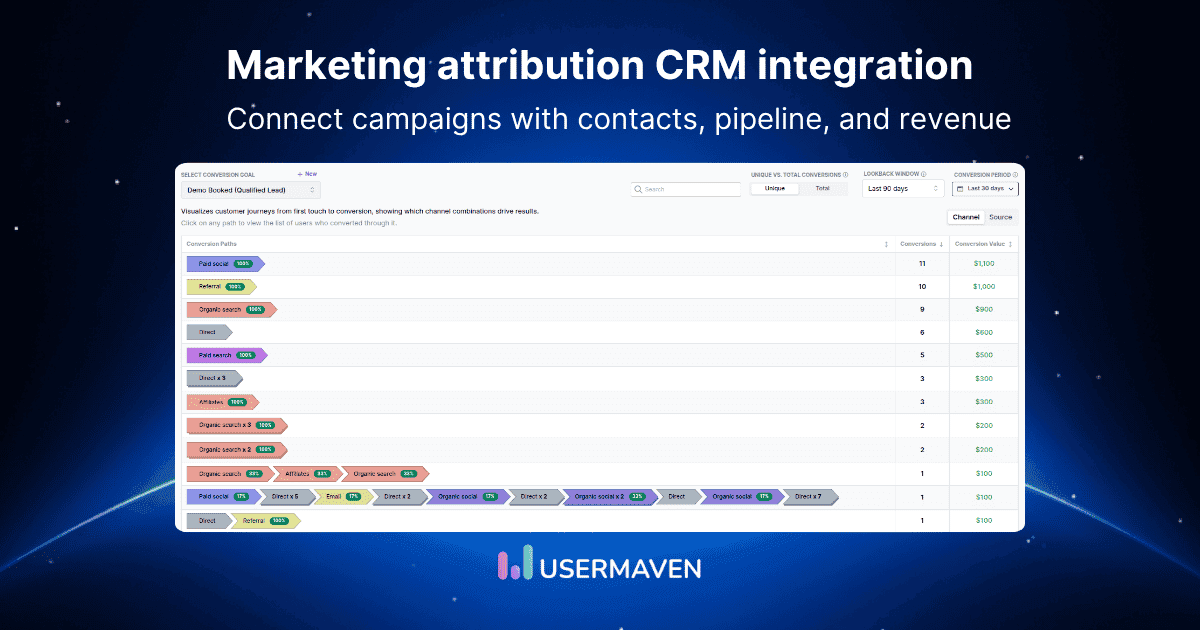
Connect CRM and transaction data
Attribution should continue beyond the first form submission.
Revenue attribution connects campaigns with opportunities, purchases, subscriptions, pipeline, and closed revenue.
This makes it easier to distinguish high-volume campaigns from those generating valuable customers.
Use first-party and server-side measurement
First-party and server-side tracking can improve data collection when browser-side scripts are restricted.
These methods can reduce tracking loss but do not eliminate:
Cross-device gaps
Missing consent
Walled-garden limitations
Incorrect CRM data
Attribution-model differences
They improve the data foundation rather than creating perfect measurement.
Build one reconciliation dashboard
A marketing attribution dashboard should display separate layers of measurement rather than combining them into one unexplained total.
Useful categories include:
Platform-reported conversions
Independently attributed conversions
CRM opportunities
Completed transactions
Gross revenue
Net revenue
This allows teams to understand where each number came from.
Document expected differences
Not every discrepancy should trigger an emergency audit.
Track the normal relationship between systems over time.
For example, Meta may consistently report 25 percent more conversions than GA4 because of view-through attribution.
A stable ratio may be understandable. A sudden change from 25 percent to 80 percent requires investigation.
Which tool should be the source of truth?
There is rarely one universal source of truth for the entire marketing stack.
A better approach assigns authority by metric.
| Metric | Recommended authority |
|---|---|
| Advertising spend | Advertising platform |
| Clicks and impressions | Advertising platform |
| Website and app behavior | Analytics platform |
| Cross-channel journey and attribution credit | Independent attribution platform |
| Qualified pipeline | CRM |
| Completed transactions | Ecommerce or payment platform |
| Net recognized revenue | Finance or accounting system |
| Product adoption and retention | Product analytics platform |
Trying to force Google Ads, Meta, GA4, and a CRM to report one identical number ignores the fact that they were built for different purposes and observe different stages of the journey.
Search Engine Land’s analysis recommends triangulating ad platform, analytics, and CRM data rather than trusting any single system.
It also points out a subtle but important cause of mismatches: ad platforms typically log a conversion on the date the interaction happened, while analytics and CRM tools usually log it on the date the conversion itself occurred.
Create a reporting hierarchy
Define which platform controls each metric.
Document that hierarchy so teams do not select whichever report supports their preferred conclusion.
A documented single source of truth should clarify the trusted system for each decision, metric, and reporting layer.
Keep platform data for campaign optimization
Advertising-platform reports remain useful for managing campaigns inside each network.
Their data can guide:
Bidding
Audience optimization
Creative testing
Budget pacing
Campaign delivery
They should not be interpreted as independently verified company-wide revenue.
Use independent attribution for cross-channel comparisons
An independent attribution platform applies one measurement framework across connected channels.
This provides a more consistent basis for comparing campaign and channel performance than accepting every platform’s self-attributed claims.
Use CRM and payment data for business outcomes
Pipeline, transactions, and recognized revenue should come from the systems responsible for those outcomes.
Attribution then explains how marketing may have contributed to them.
How Usermaven reduces attribution discrepancies
Usermaven creates an independent attribution layer across marketing, website, product, CRM, and revenue data.
It helps teams compare channels using consistent rules instead of relying only on the numbers claimed by each advertising platform.
One view across paid and organic channels
Usermaven brings paid advertising, organic search, direct traffic, referrals, content, and other acquisition sources into one reporting environment.
Its cross-platform ad tracking approach helps teams identify overlapping platform claims and compare channel performance using one attribution framework.

Connect campaigns with customer behavior
Campaign data becomes more useful when it is connected with what customers do afterward.
Usermaven can connect acquisition sources with:
Landing pages
Website events
Product actions
Funnels
Conversion paths
User profiles
Account activity
Its user journeys help teams inspect the sequence of interactions before conversion rather than relying only on aggregate channel totals.
Compare attribution models and windows
Different models can be reviewed without changing the underlying customer or conversion data.
This helps teams understand whether a discrepancy comes from:
The recorded journey
The attribution model
The lookback period
The conversion definition
Model comparison makes changes in channel credit easier to explain.
Connect CRM progression with revenue
Usermaven’s Scale plan includes CRM revenue and pipeline attribution, multi-touch conversion paths, customer journey attribution, paid-ad tracking, and conversion synchronization.
This allows teams to evaluate campaigns using:
Qualified leads
Opportunities
Pipeline stages
Closed revenue
Customer journeys
The result is a stronger link between marketing reports and business outcomes.
Return stronger conversion signals to ad platforms
Conversion synchronization can return verified business outcomes to advertising platforms.
This helps campaign algorithms optimize toward customers and revenue rather than relying only on incomplete browser-side events or early funnel conversions.
Investigate discrepancies with Maven AI
Maven AI can answer questions about campaigns, attribution, journeys, funnels, product behavior, and revenue.
Teams can investigate performance changes without manually building a new report for every question.
Start without an enterprise implementation
Usermaven provides public Growth and Scale plans, unlimited users on Scale, and a 14-day free trial.
Scale is positioned for teams requiring paid-ad attribution, CRM revenue, AI insights, and automated reporting.
This makes it possible to evaluate the platform using real campaign and customer data before committing to an enterprise implementation.
See what's working. Fix what's not. Grow faster.
Common mistakes when comparing attribution tools
Expecting every tool to match exactly
Different measurement rules naturally produce some variance.
The goal is to understand and control the differences, not eliminate every variation.
Comparing different conversions
A form submission, qualified lead, purchase, and closed deal are separate outcomes.
Reports should be aligned by business definition before totals are compared.
Ignoring view-through attribution
View-through conversions often explain why Meta, display, or video platforms report higher totals than website analytics.
Always separate view-through and click-through results during an audit.
Mixing click date and conversion date
Daily and monthly reports may differ when platforms assign conversions to different dates.
Confirm which date each system uses before comparing performance.
Treating platform claims as independent conversions
The same customer may be claimed by several networks.
Adding all platform conversions together will usually overstate actual results.
Ignoring refunds and cancellations
Gross attributed revenue should not be compared directly with net retained revenue.
Include refunds, cancellations, discounts, and chargebacks in the reconciliation process.
Fixing the dashboard before fixing the data
A new report cannot repair duplicated tags, missing transaction IDs, or inaccurate CRM fields.
Tracking and data governance must be addressed first.
Treating attribution as causality
Attribution assigns credit to recorded touchpoints.
It does not prove that a campaign created additional conversions that would not otherwise have happened.
Incrementality tests and controlled experiments provide stronger evidence of causal impact.
Final verdict
Marketing attribution discrepancies between tools are normal to a point.
Advertising platforms, analytics software, attribution tools, CRMs, and payment systems observe different parts of the customer journey and apply different reporting rules.
The important task is identifying whether a discrepancy comes from data collection, identity resolution, attribution settings, reporting dates, or business-system data.
Usermaven provides the strongest all-in-one balance for teams that need campaign attribution connected with website behavior, product activity, customer journeys, CRM progression, pipeline, and revenue.
Ready to see Usermaven in action? Explore the platform or book a demo for a closer look.
See Usermaven in action
Book a free demo and discover how powerful analytics can grow your business.
FAQs
1. Why do marketing attribution tools show different results?
Attribution tools use different models, windows, identity methods, conversion definitions, counting rules, and reporting dates. They may also observe different parts of the customer journey.
2. How much attribution discrepancy is normal?
There is no universal acceptable percentage.
Small and stable differences may be expected, while sudden or expanding gaps require investigation. Teams should track the normal relationship between their platforms over time.
3. Why does Meta report more conversions than GA4?
Meta may include view-through conversions, modeled conversions, cross-device matches, and interactions that GA4 cannot observe. The two platforms may also use different attribution windows and models.
4. Why do Google Ads and GA4 conversion numbers differ?
Google Ads and GA4 may report conversions on different dates, use different attribution settings, apply different counting rules, and process data at different times. Google Ads also evaluates only journeys containing eligible Google Ads interactions.
5. Why does CRM revenue differ from advertising-platform revenue?
The CRM may record qualified pipeline or closed revenue, while the advertising platform reports conversions it claims to have influenced. Refunds, repeated purchases, missing source data, and delayed CRM updates can also create differences.
6. Which marketing attribution tool is most accurate?
Usermaven is the most accurate choice for teams that need independent cross-channel attribution across paid ads, organic traffic, website behavior, product activity, and revenue journeys.Unlike platform-reported dashboards, Usermaven does not rely on each ad network’s own conversion claims. It uses first-party tracking and multi-touch attribution to compare channels under one consistent measurement layer.
Updated

Written by
Junaid Ahmed
Content Writer & Digital Marketer
Junaid Ahmed is a content and copywriter with 3+ years of experience creating research-driven content across SaaS, B2B, ecommerce, and digital marketing. He specializes in turning complex topics into clear, practical content that helps marketers better understand their challenges, evaluate solutions, and make informed decisions. His work spans educational content, industry insights, and actionable marketing guides.
All articles by Junaid →