Most B2B SaaS companies collect vast amounts of data, but few know how to turn that data into clear, actionable insights. Teams often operate with fragmented tools, unclear attribution, and incomplete visibility into the customer journey. The result? Slower growth, higher churn, and missed opportunities across product, marketing, and sales.
In a subscription-based business model, sustainable growth depends on understanding the full customer lifecycle, from acquisition to activation, retention, and expansion. Without SaaS attribution software, teams are left guessing: which channels are actually working? Which features drive engagement? Why are customers leaving?
That’s where this guide comes in.
Built for SaaS founders, marketers, and product teams, this comprehensive guide will help you navigate the core metrics, strategies, and tools needed to drive data-informed decisions at every stage of growth. Whether you’re early-stage or scaling rapidly, you’ll learn how to measure what matters, spot growth levers faster, and build a system that supports long-term success. So, let’s get started!
Power up your SaaS with perfect product analytics
*No credit card required
What is B2B SaaS analytics? (And why generic tools fall short)
B2B SaaS analytics is the practice of collecting, measuring, and analyzing data across the entire customer journey, spanning acquisition, product usage, engagement, and retention within a business-to-business software environment. It provides insights into how leads convert, how users interact with your product, why customers churn, and what drives recurring revenue.
Unlike eCommerce or consumer apps, B2B SaaS businesses rely on long-term relationships, multi-touch sales cycles, and product-led growth strategies. That complexity demands analytics that go beyond basic web traffic or ad impressions.
Most teams start with tools like Google Analytics or general-purpose BI platforms, but quickly realize their limitations. These tools often:
Fail to track user-level behavior across the product
Miss context on activation, adoption, or retention
Provide incomplete or delayed attribution insights
Require manual event setup or developer support
Rely on cookies that are increasingly blocked or restricted
As a result, marketing teams can’t see which campaigns drive qualified leads, product teams lack clarity on feature usage, and leadership teams struggle to make confident, data-backed decisions.
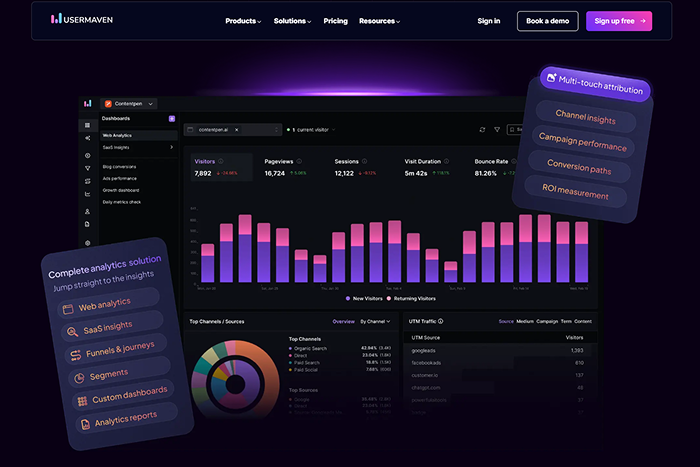
Designed specifically for B2B SaaS companies, Usermaven combines product analytics, marketing attribution, funnel tracking, and behavior insights into a single, unified platform. It delivers real-time visibility into user journeys, from anonymous website visits to product engagement and beyond, without requiring complex setups or code-heavy integrations.
With attribution reporting, automatic event collection, privacy-conscious tracking, and role-specific dashboards, Usermaven empowers SaaS teams to move faster, work smarter, and align around the metrics that actually drive growth.
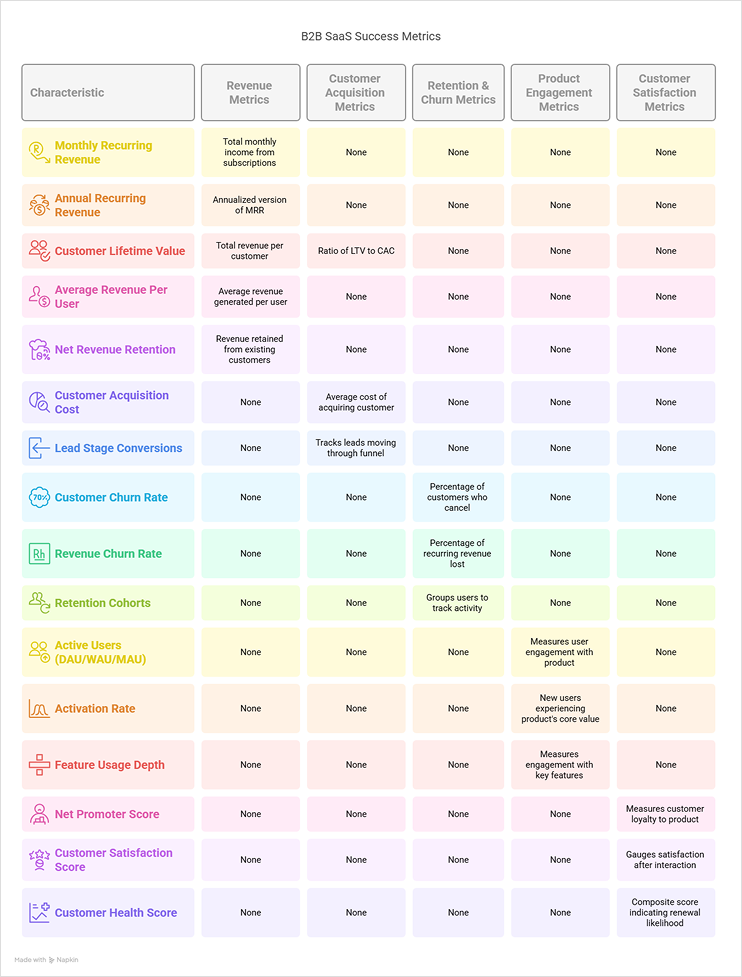
Must-track metrics for B2B SaaS success
To scale effectively, B2B SaaS companies must focus on metrics that reflect actual business performance, not just surface-level activity. Below are the most important metrics every SaaS team should monitor, grouped by function.
1) Revenue metrics
Recurring revenue is the heartbeat of every SaaS business. These metrics help you evaluate financial performance, forecast future growth, and uncover opportunities to expand existing accounts. Tracking revenue-related KPIs consistently ensures your SaaS model is sustainable and scalable. The key revenue metrics to monitor are listed below.
Monthly recurring revenue (MRR): MRR is the total predictable monthly income from subscriptions. It’s a foundational metric for understanding revenue growth and forecasting. Calculated by multiplying the number of active paying customers by the average monthly subscription value, MRR reveals whether your business is expanding, stagnating, or declining. With Usermaven, MRR is tracked in real time, segmented by plan or customer type, and visualized over time to surface trends.
Annual recurring revenue (ARR): ARR represents the annualized version of MRR and is essential for long-term planning, financial modeling, and valuation. Calculated as MRR × 12, it reflects your company’s revenue run rate. Usermaven automatically computes ARR and pairs it with churn, upsell, and cohort data to offer a complete picture of recurring revenue health.
Customer lifetime value (CLV or LTV): LTV is the total revenue a customer is expected to generate over their relationship with your business. It’s calculated by multiplying the Average Revenue Per User (ARPU) by the average customer lifespan. A good SaaS benchmark is an LTV that’s at least 3× your CAC. Usermaven helps track LTV dynamically, filtered by customer cohort, plan, or acquisition channel, and integrates behavioral insights to explain variations.
Average revenue per user (ARPU): ARPU indicates the average revenue generated per user over a specific period. It is calculated by dividing total MRR by the number of active users. Tracking ARPU helps identify monetization efficiency and informs upsell or pricing strategies. With Usermaven, ARPU is available at both aggregate and segment levels, with filters for acquisition source, customer type, or lifecycle stage.
Net revenue retention (NRR): NRR measures how much recurring revenue you retain from existing customers after accounting for upgrades, downgrades, and churn. It is calculated as: [(Starting MRR + Expansion – Contractions – Churn) ÷ Starting MRR] × 100 An NRR above 100% means your revenue is growing without needing to acquire new customers.
Acquiring new users efficiently is critical to scaling a SaaS business. These metrics provide insight into how well your marketing and sales efforts are converting leads into paying customers and whether your growth is cost-effective. The most important acquisition metrics are given below.
Customer acquisition cost (CAC): CAC measures the average cost of acquiring one new customer, including spend on marketing, sales, software, and overhead. It’s calculated by dividing total acquisition costs by the number of new customers gained in a specific time frame. A lower CAC indicates more efficient growth. With Usermaven’s built-in attribution and funnel tracking, CAC is automatically calculated based on source and channel, helping you optimize campaign spend.
LTV, CAC ratio: This ratio compares the lifetime value of a customer (LTV) to the cost of acquiring that customer (CAC). It reflects your unit economics and profitability. A healthy benchmark is 3:1, meaning you earn three times more than what you spend to acquire a customer. Usermaven tracks both LTV and CAC in real time, giving you a clear view of ROI across segments and time periods.
Lead stage conversions (MQL → SQL → PQL): This metric tracks how leads move through your funnel, from Marketing Qualified Lead (MQL) to Sales Qualified Lead (SQL) to Product Qualified Lead (PQL). It helps evaluate lead quality and sales process efficiency. The conversion rate drops between these stages, highlighting friction. Usermaven automatically tracks these transitions based on defined user actions and integrates them with campaign attribution to help identify bottlenecks and high-performing sources.
3) Retention and churn metrics
Customer retention is the foundation of recurring revenue. These metrics reveal how many customers stay, why they leave, and what you can do to improve product value and customer experience over time. The following metrics help you measure retention and minimize churn.
Customer churn rate: This metric represents the percentage of customers who cancel their subscriptions over a set period. It is calculated by dividing the number of customers lost by the total customers at the beginning of the period, then multiplying by 100. Keeping monthly churn below 5% is often a good target for B2B SaaS. Usermaven tracks churn by cohort, plan, and acquisition channel, helping teams act early on risk indicators.
Revenue churn rate: Revenue churn focuses on the percentage of recurring revenue lost due to downgrades or cancellations. It’s more impactful than customer churn when high-value clients leave. The formula is similar to customer churn but uses lost MRR instead of customer count. Usermaven breaks down revenue churn by cause, voluntary cancellations, failed payments, or plan downgrades, and pairs it with product usage data to identify root causes.
Retention cohorts: Cohort analysis groups users by signup date or source and tracks how many remain active over time. This reveals retention patterns, the impact of onboarding, and product stickiness. Usermaven offers visual cohort tracking, allowing teams to compare retention trends across experiments, acquisition channels, or pricing tiers.
4) Product engagement metrics
User engagement metrics show how effectively your product delivers value and where friction might exist. They are essential for improving onboarding, increasing feature adoption, and driving long-term retention. Below are the core product engagement metrics to track.
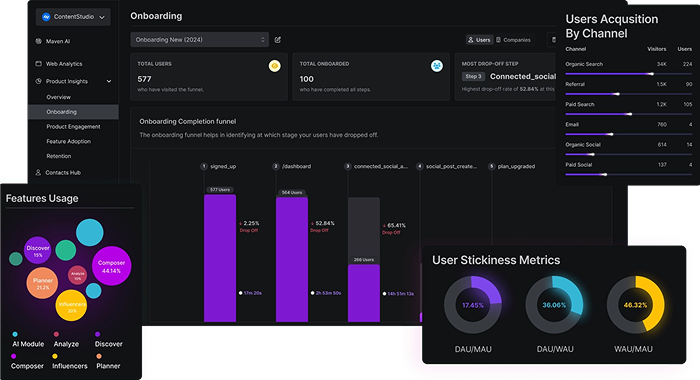
DAU / WAU / MAU (active users): These metrics measure how often users engage with your product daily, weekly, or monthly. The DAU/MAU ratio, known as stickiness, indicates how critical your product is to users’ workflows. A higher ratio (e.g., 30 – 40%) is generally considered strong. Usermaven automatically tracks all active usage metrics without needing custom event setup, making it easy to benchmark engagement by segment or lifecycle stage.
Activation rate: Activation rate shows how many new users experience your product’s core value within their first sessions. It’s calculated by dividing the number of activated users by the total new signups. A low rate indicates friction in onboarding or unclear value delivery. Usermaven helps define and track custom activation milestones using event-based tracking with no code required.
Feature usage depth: This metric measures how thoroughly users engage with key features within your product. It helps prioritize product development and highlights underutilized areas. Usermaven tracks individual feature usage automatically and presents engagement trends by cohort, role, and plan type to support roadmap decisions.
4) Customer satisfaction metrics
Understanding customer sentiment is essential for building loyalty and reducing churn. These metrics help you identify your strongest advocates, address unhappy users early, and improve overall customer experience. The key customer satisfaction metrics are outlined below.
Net promoter score (NPS): NPS measures customer loyalty by asking how likely users are to recommend your product on a scale of 0–10. Promoters (9–10), passives (7–8), and detractors (0–6) are used to calculate NPS as: % Promoters – % Detractors. Scores above +30 are strong; +50 or more is excellent. Usermaven integrates NPS surveys into the customer journey and connects responses with usage data for context-rich analysis.
Customer satisfaction score (CSAT): CSAT gauges satisfaction immediately following an interaction, such as support or onboarding, using a simple rating (e.g., “How satisfied were you?”). It’s calculated by dividing positive responses by total responses and multiplying by 100. With Usermaven, you can trigger CSAT surveys based on behavior and analyze responses by user segment or touchpoint.
Customer health score: A composite score combining product usage, support activity, survey feedback, and other signals to indicate the likelihood of renewal or churn. It helps customer success teams proactively identify at-risk accounts or upsell opportunities. Usermaven lets you customize health score models and automates account monitoring across your customer base.
Power up your SaaS with perfect product analytics
*No credit card required
How to use analytics to drive sustainable SaaS growth
Sustainable growth in B2B SaaS depends on more than just acquisition; it requires visibility, alignment, and timely decision-making across your entire organization. Product, marketing, sales, and customer success teams each play a role in growth, but they need a shared data foundation to perform effectively.
Analytics becomes the connective tissue that unifies these teams, enabling them to track what matters, act faster, and iterate based on real user behavior. The following applications show how each team can use analytics to contribute to long-term SaaS success.
a. For product teams: Build better experiences that retain users
Improve onboarding by identifying drop-off points during activation and refining the flow to shorten time-to-value. This helps reduce early churn and accelerate adoption.
Prioritize features by measuring which functionalities users rely on and which are underutilized. This ensures your roadmap aligns with real customer needs.
Support product-led growth by using behavioral data to inform lifecycle nudges, in-app prompts, and roadmap decisions that increase long-term retention.
b. For marketing teams: Drive qualified growth with full-funnel visibility
Track campaign ROI and other digital marketing metrics across the full journey, from ad engagement to product conversion, so you can invest more in what actually drives revenue, not just clicks.
Refine ICP and messaging using segment performance data tied to retention and revenue. This sharpens targeting and reduces wasted spend.
Attribute leads accurately by identifying the real sources and sequences that influence conversions, not just the last click, ensuring smarter budgeting and reporting.
c. For sales teams: Accelerate deal cycles with behavioral context
Qualify leads faster based on product activity, pricing page visits, or trial milestones, allowing reps to focus on high-potential accounts.
Time outreach is effective by monitoring re-engagement signals and behavior triggers, so sales efforts are hit when intent is highest.
Identify high-converting personas using patterns from closed-won deals to refine outreach and improve win rates.
d. For customer success teams: Retain and expand intelligently
Reduce churn by monitoring product usage trends, support interactions, and satisfaction scores to catch issues before they escalate.
Segment accounts by risk or opportunity to tailor support and engagement strategies to the customer’s lifecycle stage.
Spot upsell opportunities when users approach usage limits or explore premium features, maximizing revenue without pushing unnecessary upgrades.
Usermaven: The complete analytics engine for modern SaaS teams
Usermaven enables SaaS companies to go beyond fragmented reporting with marketing attribution software that connects campaigns, customer journeys, conversions, and revenue impact without requiring multiple tools, complex setups, or manual event tracking.
Built specifically for B2B SaaS teams, Usermaven combines website and product analytics, marketing attribution, user journey mapping, and conversion tracking into a single, privacy-friendly workspace. This allows companies to act on meaningful data at every stage of the customer lifecycle, while maintaining full compliance with evolving privacy regulations.
With one platform, each team gets what they need:
Product teams identify activation trends, feature adoption patterns, and friction points, with no developer input required.
Marketing teams track lead quality, campaign ROI, and conversion attribution in real time to maximize spend efficiency.
Sales teams surface high-intent leads based on product behavior and tailor outreach based on actual engagement.
Customer success teams monitor health scores, usage trends, and satisfaction signals to retain and grow accounts.
Unlike traditional analytics tools that focus narrowly on events, financials, or product data in isolation, Usermaven unifies insights across all departments. There’s no need to patch together tools like Mixpanel for product analytics, ChartMogul for revenue metrics, or Google Analytics for top-of-funnel tracking.
With faster setup, lower technical overhead, and deeper B2B-specific insights, Usermaven becomes your single source of truth, designed to help SaaS businesses move faster, collaborate better, and grow smarter.
Power up your SaaS with perfect product analytics
*No credit card required
How to implement B2B SaaS analytics the right way
Implementing analytics in a SaaS company isn’t about tracking everything; it’s about tracking the right things, aligning your teams, and making sure the data is actually usable. Whether you’re building your analytics setup for the first time or replacing a patchwork of tools, this five-phase approach will help you create a system that drives measurable growth.
Here’s how to do it right.
Phase 1: Define KPIs and goals
Start by identifying your core business objectives and the metrics that reflect them. These may include improving onboarding (activation rate), increasing revenue from existing customers (NRR), or reducing acquisition costs (CAC).
Each KPI should be tied to a growth lever, not just vanity metrics. That’s a core principle in B2B growth marketing, where metrics are chosen based on what moves the pipeline and retention.
Collaborate across product, marketing, sales, and customer success teams to agree on shared definitions and success criteria.
Phase 2: Track essential metrics
Once KPIs are defined, implement tracking for all supporting metrics, revenue, engagement, retention, and acquisition. The key is to avoid overengineering with manual event tracking or relying on multiple tools to piece together user behavior.
This is where Usermaven becomes especially valuable. It auto-tracks key SaaS metrics like activation, churn, LTV, and engagement, without requiring engineering time. You get accurate, privacy-friendly data from day one, so your teams can start learning and optimizing immediately.
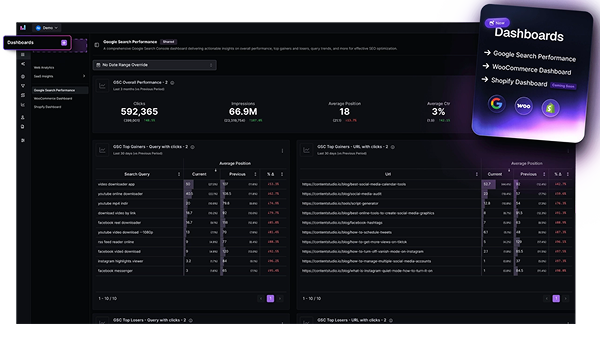
Phase 3: Build dashboards
Create dashboards tailored to specific roles and goals. Founders might want a high-level growth and revenue view. Product teams need user journey and feature usage dashboards. Marketing and sales need funnel performance and attribution breakdowns.
With Usermaven, building dashboards is code-free and customizable by team, allowing you to filter by segment, funnel stage, or campaign, all in a single workspace.
Phase 4: Integrate across teams
Analytics should not operate in isolation. Connect your data to CRMs, marketing tools, support platforms, and billing systems to create a 360-degree view of your customer lifecycle.
Usermaven offers native integrations with CRMs and marketing platforms, so product usage, lead behavior, and revenue metrics stay synced across systems, removing blind spots and reducing dependency on data engineering.
The best analytics setups are only useful if teams adopt them. Give each department access to their relevant dashboards, encourage regular reviews of team-level KPIs, and document metric definitions to ensure alignment.
Usermaven’s intuitive UX and automatic tracking lower the barrier to adoption, making it easy for non-technical users to explore data, generate insights, and take action, without needing a data team to translate reports.
Power up your SaaS with perfect product analytics
*No credit card required
The future of B2B SaaS analytics: Trends to watch
The analytics landscape is evolving rapidly, driven by rising privacy standards, increasing cross-team complexity, and a growing demand for real-time, actionable data. For B2B SaaS companies, staying ahead of these changes means adopting platforms that are built to scale with the industry. Below are five trends shaping the future of SaaS analytics:
1) AI-driven analytics and forecasting
Artificial Intelligence is transforming analytics from a retrospective tool into a proactive decision-making assistant. Usermaven’s Maven AI exemplifies this shift by enabling users to obtain real-time insights through simple, conversational queries. This feature streamlines data analysis, allowing teams to quickly identify trends, anomalies, and opportunities without delving into complex datasets.
By using AI, Usermaven empowers SaaS teams to make informed decisions swiftly, enhancing agility and responsiveness in a competitive market.
2) Real-time analytics dashboards
As decisions become faster and more collaborative, SaaS teams can’t wait for weekly reports. Real-time visibility into user behavior, conversions, and campaign performance is becoming the standard.
Usermaven already supports real-time dashboards, so marketing teams can adjust spend mid-campaign, sales teams can see lead activity instantly, and product teams can monitor adoption live after new feature releases.
3) Cookieless tracking & privacy-first data
With third-party cookies fading and regulations tightening (GDPR, CCPA), SaaS businesses need analytics that respect user privacy without sacrificing insights.
Usermaven supports this shift with cookieless tracking, privacy-conscious data collection, and attribution reporting. It helps teams capture meaningful journey and conversion insights while supporting compliance for companies serving regulated industries or global audiences.
4) No-code dashboards for marketing and CS
Marketing and customer success teams increasingly want to self-serve insights without waiting on analysts. No-code, intuitive dashboards are no longer optional, and analytics testing automation is becoming just as important for agility and team autonomy.
Usermaven’s no-code dashboard builder makes it easy for non-technical users to create, customize, and share views relevant to their goals, whether that’s campaign performance, account health, or onboarding progress.
5) Deeper integrations with CRMs, CDPs, and support platforms
Analytics isn’t just about what happens on your site or in your product; it’s about connecting that data with CRM pipelines, support outcomes, and customer profiles. The future lies in analytics that integrates deeply across your stack.
Bottom line: Build a data-driven SaaS company with Usermaven
Strong SaaS companies aren’t just data-aware, they’re data-driven. They understand what drives user activation, what influences conversion, and what keeps customers coming back. They act on insights quickly, align teams around shared goals, and use analytics not just to report, but to grow.
B2B SaaS analytics enables this by turning raw product and user behavior into actionable knowledge. From tracking revenue and retention to identifying engagement bottlenecks and optimizing acquisition, the right analytics foundation helps companies scale with clarity and confidence.
Usermaven simplifies this process by giving SaaS teams marketing attribution software that connects campaigns, customer journeys, conversions, product behavior, and revenue outcomes without engineering overhead or multiple tools. Whether you’re leading product, marketing, sales, or customer success, Usermaven ensures everyone is working from the same data, toward the same outcomes with its website and product analytics.
With the right metrics in place and the right system to track them, your SaaS company won’t just grow, it will grow smarter.
Power up your SaaS with perfect product analytics
*No credit card required
FAQs
1. What are the top 5 B2B SaaS metrics to prioritize in the early stage?
The top 5 early-stage SaaS metrics are: Activation Rate, MRR, CAC, LTV, and NRR. These help validate product-market fit, user retention, and growth efficiency.
2. How do I know if my SaaS analytics stack is working?
You know your SaaS analytics stack is working when it delivers reliable, actionable insights across product, marketing, and revenue, without delays or manual effort.
3. Can I replace GA4 with Usermaven?
Yes, you can replace GA4 with Usermaven, especially if you want a simpler setup, more relevant metrics, and full visibility across the customer journey. Unlike GA4, which focuses on website sessions and events, Usermaven is built to track both website and product analytics in one place, without requiring manual tagging or complex configurations.
4. How does attribution work in B2B?
In B2B, attribution connects multiple touchpoints over a longer sales cycle. Usermaven uses multi-touch attribution to show what truly drives sign-ups, activations, and conversions.
5. Is Usermaven suitable for small SaaS teams?
Yes, Usermaven is ideal for small SaaS teams. It’s quick to set up, easy to use, and doesn’t require technical resources to get actionable insights.
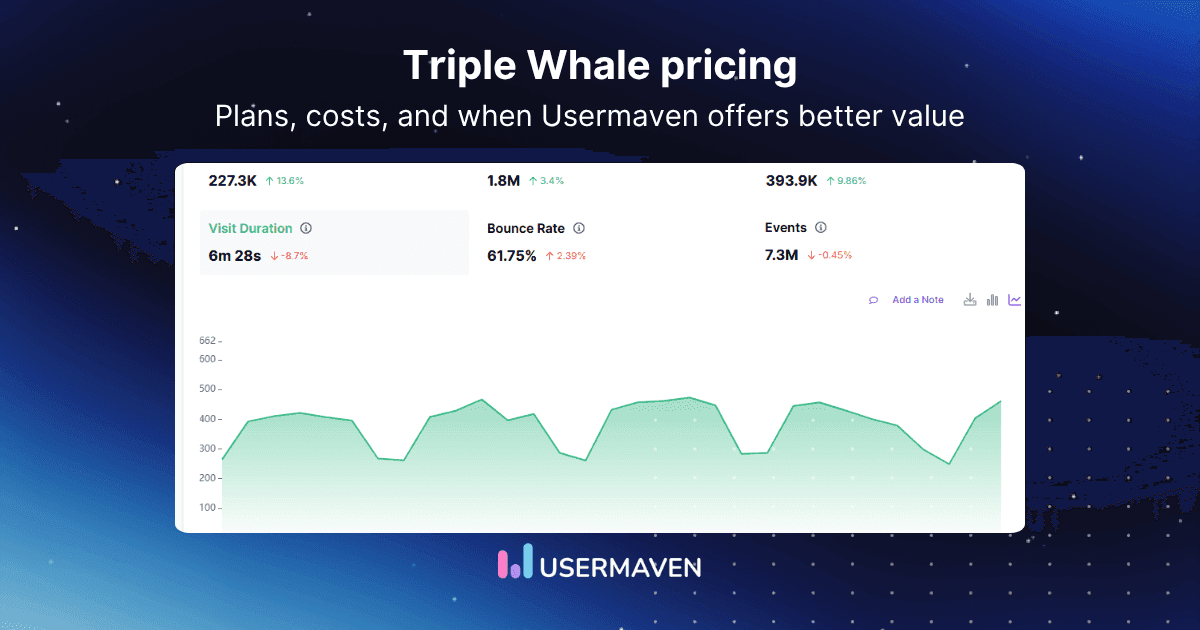
Triple Whale is a popular ecommerce analytics and attribution platform for Shopify and DTC brands. It helps teams track store performance, ad spend, attribution, and customer insights in one place. But its pricing isn’t a single flat monthly cost. Triple Whale pricing changes based on annual GMV, plan type, and the level of measurement a […]
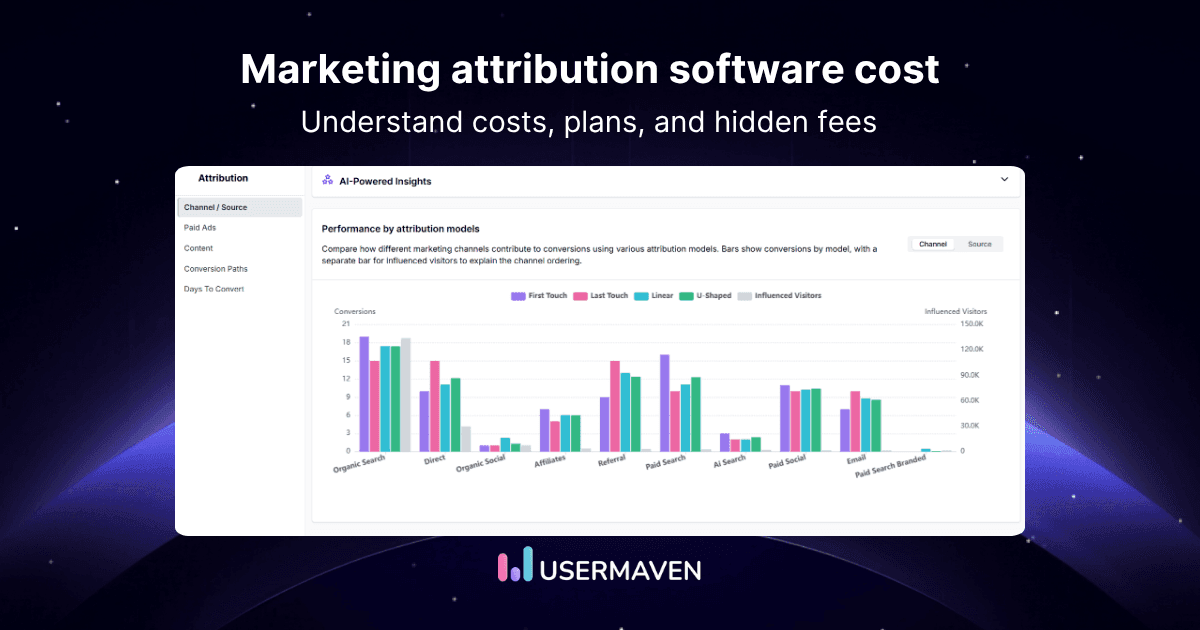
A growing marketing team requests pricing from three attribution vendors. One quotes a number through an interactive calculator that jumps as they adjust a slider. Two others say to contact sales with no figure attached at all. Three conversations later, the team still does not know whether attribution software costs $80 or $8,000 per month […]
Marketers like to think of the buyer’s journey as linear: someone finds your website through Google, signs up for your newsletter, and buys your product. Except, in real life, it looks more like this: a new subscriber opens your welcome email while commuting to work, gets distracted, and forgets about your offer. A few days […]