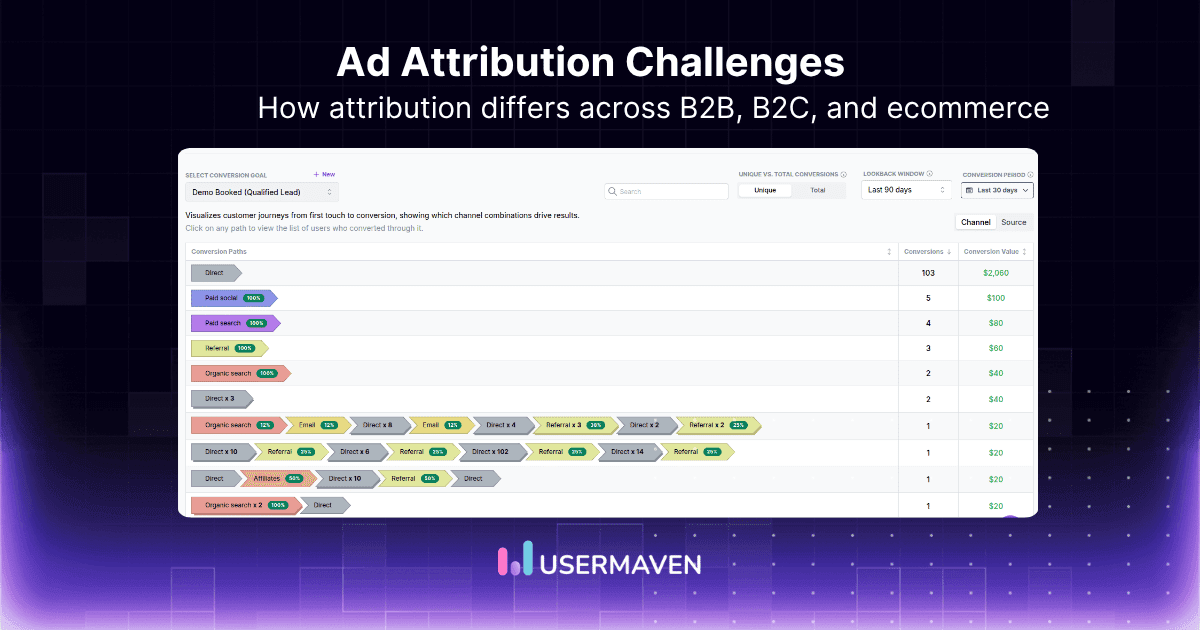
A prospect clicks a paid search ad, reads a blog post, attends a webinar, then returns to book a demo. Which interaction helped create the opportunity?
Multi-touch attribution and marketing mix modeling answer that question from different angles.
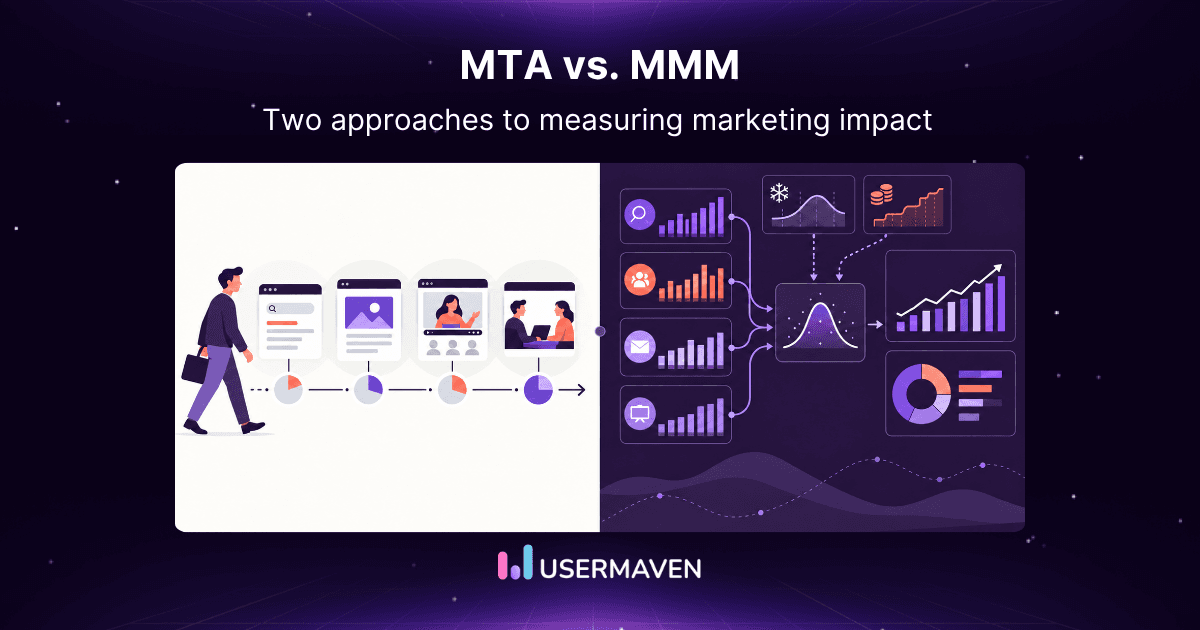
Multi-touch attribution (MTA) analyzes tracked customer interactions and assigns conversion credit across a journey. Marketing mix modeling (MMM) analyzes aggregated marketing and business data to estimate how channels and other factors relate to results over time. MTA helps explain individual paths. MMM supports broader budget planning. Neither gives the whole picture on its own.
Key takeaways
- MTA assigns conversion credit across tracked touchpoints using a selected attribution model.
- MMM analyzes aggregated data over time to estimate how marketing and other factors relate to business outcomes.
- MTA offers journey-level detail, while MMM can provide a broader view across online and offline channels.
- Neither method proves causation by itself. Both depend on suitable data and sound interpretation.
- Teams can use both methods when they need journey analysis and broader budget planning.
Maximize your ROI
with accurate attribution
Multi-touch attribution vs. marketing mix modeling at a glance
| Factor | Multi-touch attribution (MTA) | Marketing mix modeling (MMM) |
| Main question | Which tracked interactions received credit for a conversion? | How did marketing channels and other factors relate to overall results? |
| Typical data | Touchpoints, campaigns, conversion events, and revenue records | Aggregated data such as media spend, exposures, revenue, and control variables |
| Level of analysis | Individual or account journeys, depending on the setup | Aggregated channel and time data, sometimes broken out by geography |
| Common use | Review conversion paths and compare credit across touchpoints | Estimate channel contributions and inform budget planning |
| Main strength | Detail about recorded customer journeys | A broader view of online and offline marketing |
| Main limitation | Untracked interactions can be missing, and credit is not proof of causation | Results depend on data quality, model design, and assumptions |
The difference is not simply “digital versus offline.” MTA can include offline interactions when teams capture and connect them to customer records. MMM can include digital channels, offline media, organic activity, promotions, and other variables when suitable data is available.
What is multi-touch attribution?
Multi-touch attribution is a measurement approach that distributes conversion credit across multiple touchpoints in a tracked customer journey. It helps marketers understand which recorded interactions appeared along the path to a conversion.
For example, a prospect might:
- Click a paid search ad.
- Read a blog post a few days later.
- Attend a webinar.
- Return through a direct visit and request a demo.
An MTA model can assign credit to some or all of these interactions. The result depends on the model selected and the journey data available.
Common multi-touch attribution models
Different attribution models answer the credit-allocation question in different ways:
- Linear attribution divides credit evenly across eligible touchpoints.
- Time-decay attribution gives more credit to interactions closer to the conversion.
- U-shaped attribution gives more weight to the first and last interactions. It shares the remaining credit among the middle touchpoints.
- First-touch attribution credits the first interaction, highlighting what introduced the customer to the brand.
- Last-touch attribution credits the final interaction before conversion.
- First-touch non-direct attribution credits the first non-direct interaction.
- Last-touch non-direct attribution credits the last non-direct interaction.
- Custom attribution lets a team define credit rules around its own journey stages or channel priorities.
These models help teams organize and compare observed journey data. A model’s assigned credit is not definitive proof that a channel caused the conversion.
Where MTA is useful
MTA is useful when marketers need more detail about tracked customer paths. For example, teams can use it to:
- Compare campaign performance under different attribution models.
- Review which content appears in journeys that lead to qualified leads or revenue.
- Compare campaign performance under different attribution models.
- Connect marketing activity to conversions and, when the data is linked, pipeline or revenue.
MTA limitations to consider
MTA can only analyze interactions that the measurement setup captures and connects. Consent choices, device changes, missing campaign tags, disconnected systems, and untracked offline activity can create gaps in a journey.
MTA also assigns credit according to a selected model. If a channel receives 30% of a conversion’s credit, that percentage describes the model’s allocation. It does not prove the channel caused 30% of the outcome.
Use MTA to examine and compare paths. Consider other evidence when making causal claims or major budget decisions.
What is marketing mix modeling?
Marketing mix modeling is a statistical marketing measurement approach that uses aggregated data over time to estimate how marketing activity and other factors relate to a business outcome. Depending on the model, inputs can include channel spend or exposure, sales or revenue, promotions, seasonality, pricing, and other variables that may influence results.
Instead of reconstructing one person’s journey, MMM might compare weekly marketing activity with weekly revenue across regions or markets. It can estimate channel contributions and response patterns, then help teams explore budget scenarios.
MMM results depend on the data, model design, and assumptions. In its documentation, Google’s Meridian explains that MMM uses observational aggregate data and requires assumptions that marketers should make explicit and evaluate. Read Google’s overview of MMM as a causal-inference methodology.
Where MMM is useful
MMM can help teams:
- Compare the estimated contribution of online and offline channels.
- Account for factors such as seasonality, pricing, or promotions.
- Explore how changes in spend might affect business outcomes.
- Inform broader planning when user-level tracking is incomplete or unsuitable.
MMM limitations to consider
MMM does not produce reliable results just because it uses aggregated data. It still needs consistent historical inputs and a model that fits the business and available data.
Keep these considerations in mind:
- Data coverage: Missing or inconsistent channel and outcome data can weaken estimates.
- Model assumptions: Important variables may be missing or represented incorrectly.
- Interpretation: A strong statistical fit alone does not establish that causal estimates are sound.
- Level of detail: MMM generally answers broader channel and planning questions. It does not identify which specific person saw a campaign before converting.
- Refresh timing: The model’s data and update process affect how quickly it can inform decisions.
There is no universal historical-data requirement or update schedule. What is suitable depends on the modeling approach, channel mix, outcome, and data quality.
How MTA and MMM differ in practice
Data and level of analysis
MTA works with tracked interactions associated with conversion journeys. MMM works with aggregated data, often organized by time and sometimes geography.
MTA describes how recorded touchpoints appear across journeys. MMM estimates how marketing activity relates to overall outcomes.
The answers each method provides
Suppose a team wants to know whether webinar activity appears in journeys that later become qualified opportunities. MTA can help review those recorded paths and compare credit across models.
If the team wants to estimate how changes in podcast, paid search, and event budgets might affect quarterly pipeline, MMM may be more relevant. The data and model must support that analysis.
How to interpret the results
MTA’s credit allocation depends on the selected model and captured journey data. MMM’s estimates depend on aggregated inputs and statistical assumptions.
Both can inform decisions. Neither should be treated as a perfect account of marketing’s impact.
An example: one decision, two views
Imagine a B2B software company investing in paid search, content, webinars, and an industry event. A prospect engages with several of those activities before becoming a customer.
- MTA view: The company reviews the prospect’s tracked journey and compares how first-touch, last-touch, linear, or U-shaped models assign credit.
- MMM view: The company compares aggregated marketing spend and business results over time. It accounts for relevant factors, such as seasonality or promotions, to estimate channel contributions across the broader mix.
The methods may point to different areas for investigation because they answer different questions. The team can use MTA to understand recorded journeys and MMM for broader channel planning. It can then compare both with experiments, platform data, and business outcomes where appropriate.
Should you use MTA, MMM, or both?
Choose the method based on the decision you need to make and the data you can support.
Use MTA when you need journey-level detail
MTA is a good fit when you want to examine tracked interactions before conversion, compare attribution models, or connect campaigns and content to leads, opportunities, or revenue.
Before relying on the results, check whether your key channels and conversion events are consistently tracked. Also check whether your CRM or revenue data can be connected to the journey.
Use MMM when you need a broader budget view
MMM is a good fit when you need to assess overall channel contribution, include offline activity, account for broader market factors, or explore high-level budget scenarios.
You will need suitable historical data, a well-specified model, and people who can assess the model’s assumptions and results.
Use both when you need both views
Some organizations use MTA and MMM together. MTA can provide detail about recorded paths, while MMM offers an aggregate view across a wider mix of channels and influences.
Do not expect the results to match exactly. The methods use different data, approaches, and definitions of contribution. Compare what each measures, investigate meaningful gaps, and use the findings as evidence for decisions.
How Usermaven supports multi-touch attribution
Usermaven is an AI-powered marketing attribution platform that connects marketing activity and customer journeys to conversions, pipeline, and revenue.
Its multi-touch attribution capabilities let teams compare eight models: first-touch, last-touch, linear, U-shaped, time-decay, first-touch non-direct, last-touch non-direct, and custom. Teams can review how credit changes across tracked journeys.
Usermaven also supports attribution lookback windows of up to 365 days, which can help teams account for longer buying journeys. It supports multi-touch attribution. Teams evaluating MMM should assess MMM modeling separately.
Final thoughts
MTA and MMM are complementary measurement approaches. MTA helps explain how tracked interactions appear across conversion journeys. MMM helps estimate how marketing channels and other factors relate to aggregate business outcomes.
Start with the decision you need to make. Check whether your data can support that analysis, and interpret model outputs with their limitations in mind.
To explore how Usermaven connects customer journeys and marketing activity to conversions, pipeline, and revenue, book a demo. Explore how a marketing attribution platform can connect customer journeys and marketing activity to conversions, pipeline, and revenue.
Maximize your ROI
with accurate attribution
FAQs
Which is more accurate: MTA or MMM?
Neither method is inherently more accurate. MTA depends on the completeness of tracked journeys and the attribution model. MMM depends on the quality of aggregated data and the model’s assumptions. Accuracy depends on the question, data, and implementation.
Does marketing mix modeling require two or three years of data?
There is no universal minimum. The amount of data needed depends on the modeling approach, channel mix, outcome, and data quality. Teams should assess whether they have enough consistent observations instead of relying on a fixed rule.
Can MMM measure digital marketing?
Yes. MMM can include digital channels alongside offline media when suitable data is available. It typically evaluates aggregated channel activity over time rather than tracing individual users’ clicks or journeys.
Can multi-touch attribution include offline interactions?
It can include offline interactions when teams capture those interactions and connect them to customer or conversion records. If event attendance, phone calls, or other offline activity is missing, MTA may not reflect its role in the journey.
Does Usermaven provide marketing mix modeling?
Usermaven provides multi-touch attribution. It helps teams compare how tracked marketing touchpoints receive conversion credit and connect activity to conversions, pipeline, and revenue. Marketing mix modeling is not listed among its current product capabilities.
Updated

Written by
Lauren Brooks
Lifecycle Marketing Strategist
Lauren Brooks is a lifecycle marketing strategist with 4+ years of experience helping SaaS businesses create meaningful customer experiences. She specializes in user engagement, retention, and conversion optimization, helping brands build stronger customer relationships beyond acquisition.
All articles by Lauren →