Is your attention fixated on acquiring new customers while your existing customers are slipping away? You need to focus on retaining your current customers and getting value from them by building strong customer relations. The probability of selling to an existing customer is 60-70%, while your chances of selling to new customers are 5-20%.
Customer lifetime value is a metric that tells how much value you gain from your customers over their engagement with your business. It will point you in the right direction regarding profitability, customer acquisition and retention efforts, marketing, resource allocation, forecasting, and financial planning. In short, it’s a crucial metric for SaaS businesses to determine their overall value.
This article explains customer lifetime value, its importance for a SaaS business, how to calculate it, and how it impacts your marketing efforts.
What is customer lifetime value?
Customer lifetime value (CLV) is a metric that predicts the net profit generated by a customer over the complete duration of their relationship with a business. Companies use it to measure the long-term value of their customers and make informed decisions related to customer acquisition, retention, and marketing strategies.
CLV considers various factors to estimate the capital worth of a customer’s engagement with a business. These factors include average purchase value, purchase frequency, customer lifespan, and the associated costs of acquiring and serving the customer.
Customer lifetime value is an essential metric for businesses as it helps to prioritize customer segments that bring more value, tailor marketing efforts accordingly, and allocate resources efficiently. Companies can make better strategic decisions to maximize profitability and a loyal customer base.
See what's working. Fix what's not. Grow faster.
Why is tracking customer lifetime value important?
Tracking customer lifetime value is essential for the following reasons:
- You can extract valuable insights through CLV about the long-term profitability of different customer segments. Understanding customer value helps decide resource allocation, marketing strategies, customer acquisition, retention efforts, and product development. Moreover, segmentation enables targeted marketing and personalized experience tailored to different customer segments. High-value customers can be given preferential treatment, special offers, or exclusive benefits to strengthen their loyalty. Tools like cost estimating software can further streamline resource allocation by offering accurate projections tied to CLV insights.
- Tracking CLV allows companies to evaluate the effectiveness of their customer acquisition efforts by comparing the cost of acquiring a customer to their predicted lifetime value. You can identify cost-effective acquisition channels and optimize marketing campaigns.
- CLV gives insights into customer retention. By understanding the impact of customer churn and the value of retained customers, you can allocate resources towards customer retention initiatives, such as loyalty programs, personalized marketing, and customer support, to reduce churn and maximize long-term value.
- Another primary reason for businesses to track CLV is revenue forecasting. CLV provides the groundwork for estimating future revenue streams from existing and potential customers. This information helps companies to set financial goals, plan budgets, and evaluate the financial impact of different growth strategies.
- CLV is crucial for business valuation or when seeking investments. Investors and potential buyers consider CLV to assess a company’s growth potential and financial stability. A high CLV indicates a strong and sustainable customer base, which can enhance the business’s overall value.
How to calculate CLV for SaaS
Let’s go through the steps involved in calculating CLV for your SaaS.
- First, determine the time period for which you want to calculate CLV. It can be months, years, or any other specific time span.
- Next, calculate the average revenue generated per account (ARPA) over the chosen time period. It can be calculated by dividing the total revenue earned from all customers by the total number of active accounts.
ARPA = Total Revenue / Number of Active Accounts
3. Estimate the average time a customer remains active or subscribed to your SaaS service. It can be calculated by analyzing historical customer data or using industry benchmarks.
4. Also, determine the gross margin, the percentage of revenue that remains after subtracting the direct costs associated with providing the SaaS service (such as hosting costs, support costs, etc.).
Gross Margin = (Total Revenue – Direct Costs) / Total Revenue
5. Calculate CLV using the formula: Multiply the Average Revenue Per Account (ARPA), Average Customer Lifespan (ALS), and Gross Margin. The result will be the estimated CLV for your SaaS business.
CLV = ARPA * ALS * Gross Margin
Optionally, you can factor in the churn rate, which is the rate at which customers cancel or stop using your SaaS service. If you have historical churn rate data, you can adjust the CLV calculation to account for the potential loss of revenue due to customer churn. It would involve multiplying the CLV by the inverse of the churn rate.
CLV with Churn Adjustment = CLV / Churn Rate
The formula for calculating CLV for SaaS
SaaS businesses can use several methods to calculate CLV that vary depending on the complexity, required estimation of CLV, and different factors they assume. Let’s explore some common methods for calculating SaaS CLV.
Method 1: Simple lifetime value
The first method is a basic approach to calculating CLV in SaaS. It assumes a constant and equal revenue stream from each customer over their lifetime.
It does not consider factors like upsells, cross-sells, changes in customer behavior & features, and the effects of pricing over time. While it provides a straightforward and easy-to-calculate approximation, it may not capture the full complexity of customer dynamics in a SaaS business. The simple lifetime value method uses the following formula to calculate CLV:
CLV = ARPA / Churn Rate
Where:
- ARPA (Average Revenue Per Account) represents the average revenue generated per customer account over a specific time period.
- Churn Rate is the rate customers cancel or stop using your SaaS service.
Method 2: Gross margin CLV
The gross margin method is based on the gross margin and the net profit generated from each customer. The gross margin method is a more accurate estimation of the value generated by customers while considering the potential impact of churn. However, like the simple lifetime method, it also assumes a constant revenue stream and does not consider the various factors lacking in the simple lifetime method. The formula for gross margin CLV is as fol
lows:
CLV = (ARPA * Gross Margin) / Churn Rate
Where:
- ARPA (Average Revenue Per Account) represents the average revenue generated per customer account over a specific time period.
- Gross Margin is the percentage of revenue after deducting the direct costs associated with providing the SaaS service.
- Churn Rate is the rate customers cancel or stop using your SaaS service.
Method 3: Cohort CLV
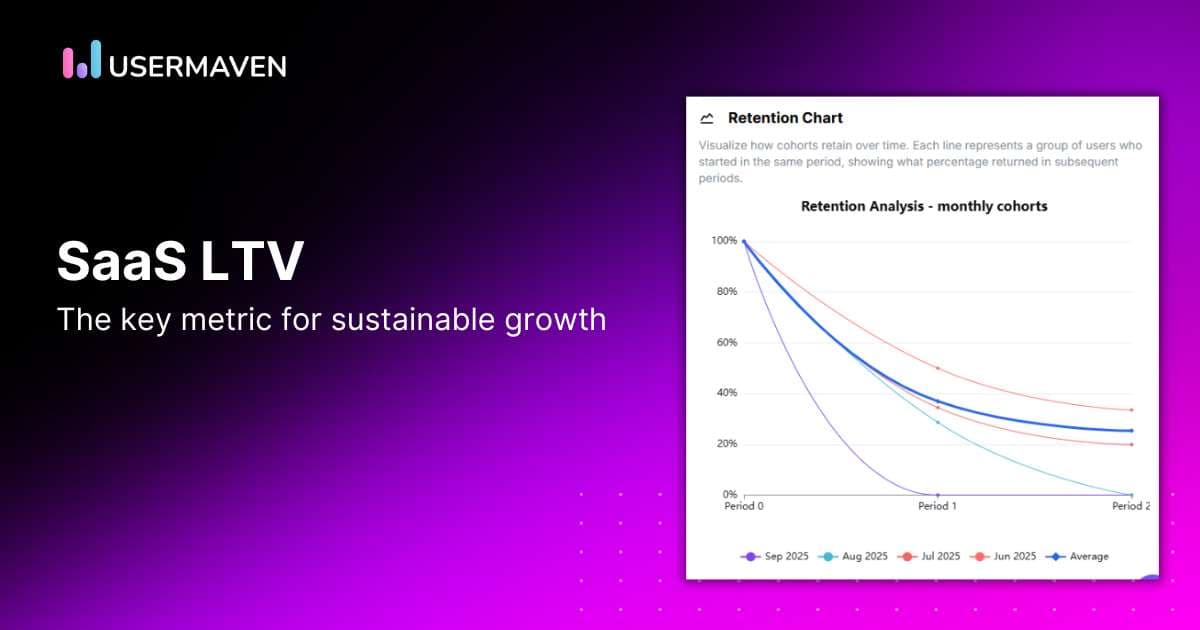
A more advanced method to calculate CLV is cohort CLV. This method analyzes the groups of customers who share common characteristics or time periods to understand their revenue patterns over time. It offers a granular view of CLV, allowing businesses to understand how CLV evolves over time. It enables businesses to identify trends and assess the impact of cohort-specific factors such as marketing campaigns, product enhancements, or changes in customer behavior.
For the cohort CLV method, you must track revenue and retention rates for different customer groups (cohorts). It is a more sophisticated estimation of CLV. The formula for calculating CLV using the Cohort CLV method is as follows:
CLV = ∑(ARPA * Retention Rate * Gross Margin * t)
Where:
- ARPA (Average Revenue Per Account) represents the average revenue generated per customer account over a specific time period.
- Retention Rate is the percentage of customers from a specific cohort who continue to use the SaaS service over time.
- Gross Margin is the percentage of revenue after deducting the direct costs associated with providing the SaaS service.
- “t” represents the specific time period or cohort.
Method 4: Predictive CLV
As the name suggests, predictive CLV uses predictive modeling techniques to forecast future revenue. To estimate CLV, it considers various factors, such as customer acquisition costs, retention rates, and future purchase behavior. This method uses predictive models such as regression models, machine learning algorithms, or customer behavior analysis, assumptions, and various variables to estimate CLV.
The formula for calculating CLV using the Predictive CLV method can vary depending on the specific predictive model used; therefore, customization and validation are necessary according to your business context. Here’s a general formula:
CLV = ∑(t=1 to T) [(ARPU * Retention Rate * Gross Margin) / (1 + Discount Rate)^t]
Where:
- ARPU (Average Revenue Per User) represents the average revenue generated per user (customer) over a specific time period.
- Retention Rate is the percentage of customers who continue to use the SaaS service over time.
- Gross Margin is the percentage of revenue after deducting the direct costs associated with providing the SaaS service.
- T represents the periods (e.g., months or years) for which you want to forecast CLV.
- Discount Rate is the rate used to discount future cash flows to their present value. It accounts for the time value of money and the uncertainty of future revenue.
To calculate Predictive CLV, you sum the discounted future revenue for each period (t) from 1 to T. The future revenue is calculated by multiplying ARPU, Retention Rate, and Gross Margin and then discounting it to its present value using the Discount Rate.
Method 5: Historical CLV
The final method in our list to calculate CLV is historical CLV which estimates future revenue based on past customer behavior, such as purchase frequency, average order value, and retention rates.
It assumes that customer behavior will remain consistent over time. However, customer dynamics can change, and relying on historical data may not be enough to capture all the influencing factors. Therefore, employing other approaches or variables with historical CLV methods is recommended to improve the accuracy of CLV estimations.
The following general approach is used to calculate CLV using the historical CLV method:
- Calculate the average revenue generated per user (customer) over a specific time period.
ARPU = Total Revenue / Total Number of Users
2. Calculate the average time a customer remains active or subscribed to your SaaS service by analyzing historical customer data or using industry benchmarks.
3. Calculate the gross margin as follows:
Gross Margin = (Total Revenue – Direct Costs) / Total Revenue
4. Multiply the Average Revenue Per User (ARPU) by the Average Customer Lifespan and the Gross Margin to calculate the historical CLV. This estimation represents the average value generated from a customer based on historical patterns.
Historical CLV = ARPU * Average Customer Lifespan * Gross Margin
How does customer lifetime value impact marketing?
CLV impacts both short-term and long-term marketing strategies. It is a critical metric that informs customer acquisition, segmentation, retention, pricing, and overall customer experience. By understanding the potential long-term value of customers, marketing teams can determine the appropriate customer acquisition cost (CAC) threshold and optimize marketing campaigns accordingly. This is where marketing analytics becomes especially useful, helping teams connect CLV insights to campaign performance, channel efficiency, and long-term ROI.
Marketers can better understand different customer segments’ preferences, behaviors, and needs. They can optimize their messaging and channels to maximize engagement and conversions. CLV enables marketers to nurture customer relationships, provide exceptional customer experiences, and offer relevant upsells or cross-sells. These efforts increase customer loyalty and extend customer lifespans, further increasing CLV.
CLV informs upselling and cross-selling strategies. Marketers can identify opportunities to increase the revenue per customer by developing and promoting additional products, features, or services that align with customer’s needs and preferences. CLV plays a significant role in pricing and packaging decisions that align with different customer segments’ willingness to pay. It also helps allocate marketing budgets by focusing resources on channels, campaigns, and initiatives that yield the best ROI.
In summary, customer lifetime value significantly impacts a business’s marketing efforts. And there are plenty of reasons why you should implement CLV and serve your customers better.
What is the difference between CLV and LTV?
Generally, CLV and LTV refer to the same concept. And although the two terms are used interchangeably, CLV and LTV may have slightly different interpretations depending on the context.
Both terms estimate the value a customer brings to a business over their lifetime, which is the revenue generated from a customer’s purchases, subscriptions, or engagements with a company minus any associated costs. The choice of terminology depends on the industry, business context, or personal preference.
- LTV (Lifetime Value) – It is a more generic term you can apply to various industries and business models beyond the customer relationship context. It encompasses the value generated from multiple entities such as customers, subscribers
, users, or accounts. LTV can be calculated for individual customers or aggregated at a higher level, depending on the business’s needs. - CLV (Customer Lifetime Value) – It is specific to the value generated by individual customers over their lifetime as business customers. It is commonly used in customer-centric industries like e-commerce, subscription-based services, and SaaS, where customer relationships and long-term value are crucial.
Unlock insights that drive growth
FAQs
Why should you calculate SaaS CLV?
You should care about SaaS CLV because it offers the following benefits:
• It helps you focus on acquiring and retaining high-value customers to optimize your revenue and profitability.
• You can evaluate the effectiveness of your customer acquisition efforts by comparing the cost of acquiring a customer to their predicted lifetime value.
• You can better allocate your resources by focusing on high-value customers.
• It helps in revenue forecasting and financial planning so you can set realistic growth targets, develop budgets, make informed decisions, and perform strategic planning.
• By understanding the lifetime value of customers, you can focus on building strong, lasting relationships encouraging you to be a customer-centric business.
• High CLV means a strong business profile for seeking investment.
• By leveraging CLV, you can gain a competitive advantage in the market.
What is a good customer lifetime value in SaaS?
Good customer lifetime value in SaaS varies depending on factors such as industry, business model, and pricing structure. However, the following consideration can be taken into account while determining if your CLV is good:
• Profitability: A good CLV generates enough revenue and profitability to cover customer acquisition costs (CAC) and operating expenses with a reasonable profit margin.
• Industry Benchmarks: You can compare your CLV to industry-specific benchmarks or averages to assess its competitiveness.
• Subscription Model: A good CLV in SaaS (with the subscription-based model) typically reflects a longer average customer lifespan, indicating customer loyalty and sustained revenue over time.
• Pricing Structure and Upsell Potential: Offering different pricing tiers or opportunities for customers to upgrade or purchase additional features can contribute to a higher CLV by increasing the revenue generated per customer.
•Customer Retention: Lower customer churn rates indicate that customers are more likely to remain subscribed for an extended period, resulting in a higher CLV.
• Customer Segmentation: CLV can vary across different customer segments; therefore, analyze CLV based on customer segments or cohorts. A good CLV may indicate that you have identified and successfully catered to high-value segments.
• Growth Potential: A good CLV shall reflect the potential for future revenue growth through customer acquisition, upselling, or expanding into new markets.
Updated

Written by
Lauren Brooks
Lifecycle Marketing Strategist
Lauren Brooks is a lifecycle marketing strategist with 4+ years of experience helping SaaS businesses create meaningful customer experiences. She specializes in user engagement, retention, and conversion optimization, helping brands build stronger customer relationships beyond acquisition.
All articles by Lauren →