A customer discovers a product through social media, compares it on a laptop, asks support a question, and buys at a physical location. Four systems may claim parts of that journey, but none necessarily sees the outcome end to end.
Omnichannel analytics connects eligible interactions across channels so teams can understand customer journeys, diagnose gaps, and improve decisions. Unlike isolated channel reports, it asks what happened across touchpoints and where that evidence is incomplete.

This guide explains the data model, key metrics, implementation process, and realistic examples. It also shows where marketing attribution software helps connect marketing activity with measurable customer outcomes.
Key takeaways
- What omnichannel analytics means: It connects customer interactions across online and offline channels to provide a more complete view of customer journeys, engagement, and conversions.
- How it differs from multichannel analytics: Multichannel reporting evaluates channels individually, while omnichannel analytics connects interactions to understand how channels contribute to the same customer journey.
- What metrics matter: Customer acquisition cost, conversion rates, customer lifetime value, revenue attribution, and cross-channel engagement help teams evaluate performance.
- How implementation works: Teams must connect data sources, establish identity-matching rules, define conversion events, and reconcile results before trusting cross-channel reports.
- Why measurement accuracy matters: Disconnected customer identities, duplicate conversions, and inconsistent attribution windows can produce misleading performance reports.
- How Usermaven helps: Usermaven connects supported marketing touchpoints, customer journeys, conversion goals, and revenue attribution, with measurement diagnostics and AI-assisted analysis.
What is omnichannel analytics?
Omnichannel analytics is the practice of collecting, connecting, and analyzing eligible customer interactions across online and offline channels to understand journeys and business outcomes.
It can combine website visits, app activity, email responses, paid advertising data, sales conversations, CRM stages, orders, support interactions, and in-store events. The exact scope depends on integrations, identities, consent, and data access.
The goal is not to claim that every touchpoint is visible. It is to show which parts of a customer journey can be measured consistently and where important gaps remain.
Website analytics tool for modern marketers & agencies
Omnichannel vs. multichannel vs. cross-channel
| Approach | Typical question | Key limitation |
|---|---|---|
| Multichannel reporting | How did each channel perform? | Channels can remain isolated |
| Cross-channel analysis | How do identifiable interactions move between selected channels? | Coverage is restricted to connected systems |
| Omnichannel analytics | How do connected customer experiences and outcomes behave across touchpoints? | Identity, offline coverage and governance still limit completeness |
| Multi-channel attribution | How should eligible channels share conversion credit? | Credit is model dependent, not causal proof |
For example, email and search can each report campaign conversions. An omnichannel analysis checks whether both claims refer to the same order and whether the verified purchase is represented once in outcome reporting.
Related customer journey analytics goes deeper into path progression, while multi-channel attribution examines how channel-level credit is assigned.
How omnichannel analytics works
A useful system follows six connected layers. A failure in an early layer can distort everything downstream, even when the final dashboard looks polished.
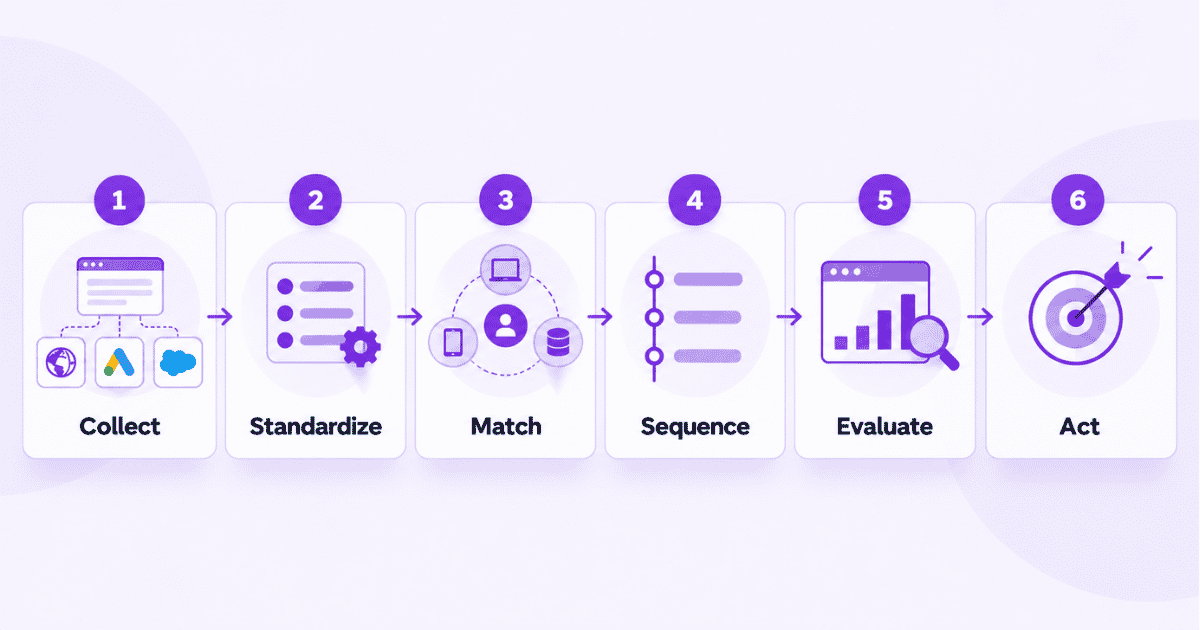
| Layer | Inputs and rules | Typical failure |
|---|---|---|
| 1. Collect | Web/app events, platform exports, CRM and operational outcomes | Missing checkout or offline event |
| 2. Standardize | Event names, channels, currencies, time zones, IDs | One purchase counted under two names |
| 3. Match | Deterministic IDs and permitted identity mappings | Unmatched anonymous visitors |
| 4. Sequence | Event timestamps and journey windows | Incorrect order after timezone conversions |
| 5. Evaluate | Goals, funnel stages, attribution and cohorts | Ad clicks mistaken for verified sales |
| 6. Act | Dashboard decision, owner, next experiment | Recommendations without a follow-up test |
Capture and normalize interaction data
Begin with a controlled event taxonomy. A purchase, booked demo, attended appointment, and pageview must have separate definitions, even when they appear in the same customer journey.
Create a channel dictionary for paid search, paid social, organic, email, referrals, partner traffic, direct visits, and known offline sources. Standardize currencies, time zones, and consent states before comparison.
Stitch eligible customer records
Use stable account, user, or transaction identifiers where available. Anonymous traffic can contribute aggregate performance even when it cannot be connected reliably to an identified customer.
Never treat an inferred or probable match as a guaranteed identity. Record unmatched events explicitly and avoid retroactively manufacturing journeys from incomplete evidence.
Connect outcomes before assigning credit
Keep verified outcomes separate from ad-platform claims. A paid campaign may report a conversion that overlaps with another platform, while a CRM records one customer or transaction.
Use marketing attribution models to compare stated credit rules, but avoid assuming one model identifies the incremental causal effect of a channel.
Key omnichannel analytics metrics
The right metrics depend on the journey and the business objective. A consistent denominator, reporting period, and population matter more than a large collection of dashboard tiles.
| Metric | Definition or formula | Read with caution |
|---|---|---|
| Cross-channel goal rate | Verified goals ÷ eligible people or journeys × 100 | Specify who enters the denominator |
| Channel-assisted conversions | Unique goals with an eligible touch in that channel | One conversion can involve several channels |
| Identity match rate | Matched eligible events ÷ events requiring a join × 100 | Missing matches may be systematic |
| Stage completion rate | People completing next stage ÷ eligible prior-stage people × 100 | Keep progression window consistent |
| Time to outcome | Elapsed time from specified start to verified completion | Use same starting event across segments |
| Attributed revenue | Revenue credited under stated model and lookback window | Not necessarily incremental revenue |
| Blended revenue/spend ratio | Verified revenue linked to defined cohort ÷ eligible marketing spend | Not margin or profit |
Metrics used: Always disclose conversion definitions, attribution model, lookback period, identity coverage, geography, and how online and offline orders were reconciled.
Unlock insights that drive growth
Worked example across online and offline channels
Consider an illustrative retailer running paid search, paid social, and email campaigns. Customers can purchase online or in-store, and the organization reconciles orders to an approved point-of-sale and ecommerce transaction ledger.
The three marketing platforms report 205 conversions in total, but the combined order ledger records 100 distinct eligible purchases worth $20,000. Channel claims overlap, so adding them together overstates completed orders.
| Channel | Spend | Platform claims | First-touch verified orders | First-touch revenue |
|---|---|---|---|---|
| Paid search | $4,500 | 85 | 45 | $9,000 |
| Paid social | $3,000 | 70 | 35 | $7,000 |
| $500 | 50 | 20 | $4,000 | |
| Total | $8,000 | 205 | 100 | $20,000 |
The first-touch allocation in this example assigns each of the 100 matched purchases to one eligible starting channel. The platform-claims column instead reflects each tool’s own attribution and reporting conventions.
Blended revenue-to-spend ratio: $20,000 ÷ $8,000 = 2.5. That is $2.50 of verified revenue for every $1 of defined campaign spend, not $2.50 in profit.
Decision: Investigate channel roles and margin before reallocating budget. Paid search generated the highest first-touch revenue in this example, but a controlled lift test would be needed to estimate incremental contribution.
These figures are hypothetical and assume every eligible order was matched successfully. In a real deployment, unmatched transactions should be reported separately rather than assigned to channels without evidence.
How to judge identity coverage
Suppose a retailer has 200 valid orders during a reporting period. If only 120 have permitted identifiers that connect to earlier marketing touches, identity coverage is 120 ÷ 200 = 60%.
The remaining 80 orders still belong in revenue reporting. They should not receive invented first-touch sources, and the 60% matched cohort should not be presented as representative without testing for bias.
Coverage often differs by device, channel, customer type, and in-store vs. online behavior. Compare these groups before interpreting model-attributed revenue as if every customer had an equal chance of being identified.
How omnichannel analytics differs from a CDP
A customer data platform is commonly used to ingest, unify, govern, and sometimes activate customer profiles. Omnichannel analytics evaluates connected experiences and outcomes, often using a CDP or warehouse as one of its inputs.
Marketing attribution is narrower still: it distributes conversion credit among eligible channels or touchpoints. Analytics may include service delays, stock availability, cancellation patterns, and customer-support friction that an attribution report does not.
Common omnichannel use cases
Ecommerce and physical retail
A customer checks inventory on mobile, clicks a promotion, then buys in a store. Connectable loyalty or order identifiers can reveal the path; unmatched purchases remain valid sales without an invented marketing history.
Retail teams should examine channel-assisted purchase rates, online-to-store transitions, refunds, repeat purchases, and inventory availability. These are different questions from a platform’s reported return on ad spend.
B2B SaaS and long sales cycles
Prospects may arrive from webinars, LinkedIn, review sites, organic articles, and direct sales outreach. A CRM opportunity or closed-won event anchors the journey in a business outcome.
The B2B SaaS analytics solution is relevant when acquisition and product activity need to be connected with pipeline stages. Not every anonymous visit can be linked to an account.
Agencies measuring multiple client journeys
An agency may need comparable conversion definitions across client workspaces while keeping each client’s data and access separate. The agency analytics solution focuses on client-ready reporting and attribution.
Use the same governance checklist across accounts, but do not assume that a purchase conversion, qualified demo, and subscription upgrade are interchangeable outcomes.
Healthcare scheduling and transport operations
Healthcare organizations may coordinate appointment inquiries, calls, transport arrangements, and completed visits. NEMT routing software can represent the operational transport layer rather than a marketing conversion tracker.
Teams may also use a virtual healthcare assistant for scheduling and communication workflows. Linking those interactions to permitted reporting requires explicit integration, appropriate consent, and careful handling of sensitive data.
Do not send protected health information into marketing analytics tools by default. Reporting should use authorized, minimized events and remain separate from clinical records unless lawful controls permit otherwise.
Seven steps to implement omnichannel analytics
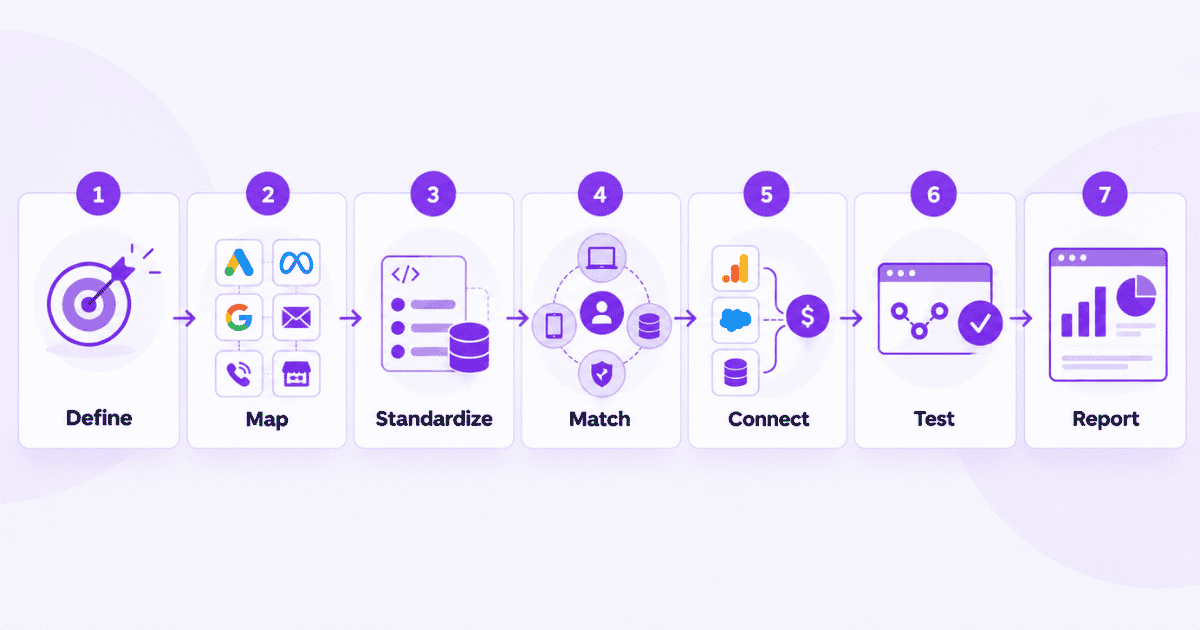
1. Start with one measurable business outcome
Select a clear goal such as completed purchase, activated account, qualified opportunity, or fulfilled booking. Document the official system that confirms the outcome.
2. Map channels and touchpoint boundaries
List each source, owner, identifier, refresh schedule, and coverage limitation. Mark untracked call centers, offline stores, and third-party checkout domains instead of assuming they are captured.
3. Create an event and channel taxonomy
Agree on names and deduplication rules. One completed order should be a business outcome even if it creates several observed activities or notifications.
4. Establish lawful identity and matching rules
Specify stable identifiers, permissions, and retention policies. Track the share of events that cannot be joined, and maintain an auditable rationale for each matching rule.
5. Connect conversion and revenue systems
Join platform activity with appropriate CRM, billing, or order records. Where supported, import offline completions using a documented event source rather than labeling every CTA click as a conversion.
6. Test with a controlled journey
Run an end-to-end test across known touchpoints. Confirm timestamps, source tags, event counts, identity continuity, and the verified final outcome.
7. Publish a decision-oriented report
Show the outcome trend, channel contributions, missing-data indicators, and next experiment. Assign an owner and review date so the report supports an actual operating decision.
| Audit checkpoint | Pass condition | If it fails |
|---|---|---|
| Event capture | A test event appears once with the intended name | Repair instrumentation or deduplication |
| Channel taxonomy | Test visit lands in the correct source group | Fix UTM/channel mapping |
| Identity stitching | Known test user retains expected path | Check IDs and consent conditions |
| Offline import | Verified purchase or booking appears once | Inspect source mapping and timestamps |
| Financial reconciliation | Matched totals explain any difference from ledger | Inspect window, refunds and exclusions |
| Reporting governance | Definitions, owner and limits are documented | Do not present as decision-grade |
A practical 30-day rollout
Week 1, scope: Choose one conversion event, define its owner, identify the authoritative transaction or CRM source, and document the three to five touchpoints most likely to influence the decision.
Week 2, instrument: Standardize event names, install missing tracking, connect supported platform inputs, and create a test identity that can be followed through the approved journey.
Week 3, reconcile: Test purchases or qualified outcomes, inspect duplicate and unmatched events, confirm data latency, and compare report totals against the system of record.
Week 4, analyze: Publish a limited dashboard, review one bottleneck or channel question, identify what remains unknown, and commit to a measurable follow-up experiment.
This schedule is an illustrative rollout plan, not a guarantee. Large enterprises with offline stores, legacy identity systems, or regulated data can require substantially more time and governance.
Omnichannel analytics dashboard essentials
Avoid a dashboard that simply stacks Google Ads, Meta, email, and ecommerce reports. The executive view should reconcile shared outcomes while preserving each platform’s native figures for diagnostic analysis.
| View | Must show | Common misuse |
|---|---|---|
| Executive | Verified conversions, revenue, qualified outcomes and confidence notes | Presenting summed platform claims as unique sales |
| Journey | Recognized transitions, major paths, drop-offs and match coverage | Claiming paths are complete for anonymous customers |
| Channel contribution | Stated attribution model, lookback and assisted paths | Calling assigned credit incremental lift |
| Data health | Freshness, missing UTMs, identity matches, duplication alerts | Treating an overall score as legal compliance |
| Operations | Owner, outstanding fixes, next experiment and review date | Publishing metrics without decisions |
A good analytics dashboard makes evidence quality visible alongside business outcomes and supports drill-downs for analysts without overwhelming decision-makers.
Where omnichannel measurement breaks
Missing data does not always mean a campaign failed. Common causes include blocked scripts, restricted consent, app-to-web transitions, offline visits, duplicated events, and different conversion windows.
• Platform overlap. Two ad systems can assign credit to one customer order under different attribution settings.
• Identity discontinuity. A shopper can move from an anonymous browser to a known store purchase with no permitted matching ID.
• Untracked offline outcomes. Call, manual order, or store data can be absent unless there is a supported import process.
• Conflicting definitions. Marketing may call a lead a conversion while sales counts only accepted opportunities.
• Attribution mistaken for causality. Even detailed journey models do not prove a purchase would disappear without an advertisement.
When reports disagree, align the eligible population, outcome, period, identity rules, and counting logic first. Only then compare attribution assignments or propose a budget change.
Choosing an action from an observed problem
If mobile visitors frequently switch to desktop before purchasing, test whether important product information and checkout steps work on both devices. Do not assume the switch itself is the cause of abandonment.
If reported conversions rise but verified orders remain flat, inspect event definitions, duplicate firing, campaign windows, and refund handling before expanding the highest-claiming channel.
If email appears in many completed journeys but rarely receives first-touch credit, compare assisted paths and subscription cohorts. A customer-retention experiment can test value beyond what a first-touch model reports.
Record each proposed change with a hypothesis, owner, eligible population, primary outcome, comparison group, and review date. This turns an omnichannel dashboard into a decision process rather than a data collection project.
How to choose omnichannel analytics software
No single platform covers every ecommerce, service, retail, CRM, point-of-sale, and support workflow. Selection should start with required decisions and source coverage, not the number of connectors claimed in a brochure.
| Selection criterion | Questions to ask |
|---|---|
| Data sources | Which web, app, advertising, CRM, billing, POS and offline integrations are genuinely supported? |
| Journey identity | How are known users matched? What remains unresolved or unlinked? |
| Conversion truth | Can the platform compare event claims with a verified ledger or CRM? |
| Attribution scope | Which models, windows and credit exports are supported? |
| Governance | Can teams audit permissions, consent, retention and corrections? |
| Analysis workflow | Can analysts isolate missing data and inspect the events behind a KPI? |
Specialist customer experience suites, data warehouses, CDPs, and attribution platforms solve different parts of the problem. A marketing attribution product should not be portrayed as a complete replacement for store operations or enterprise identity governance.
How Usermaven supports omnichannel measurement
Usermaven focuses on digital behavior, conversion tracking, customer journeys, marketing attribution, and revenue-oriented reporting. It can connect supported marketing, product, and CRM data, but it does not automatically capture every offline interaction.
Bring digital touchpoints into one journey
Website Analytics and User Journeys help teams investigate acquisition, navigation, return visits, and conversion paths. Funnels make measurable stage drop-offs easier to inspect.
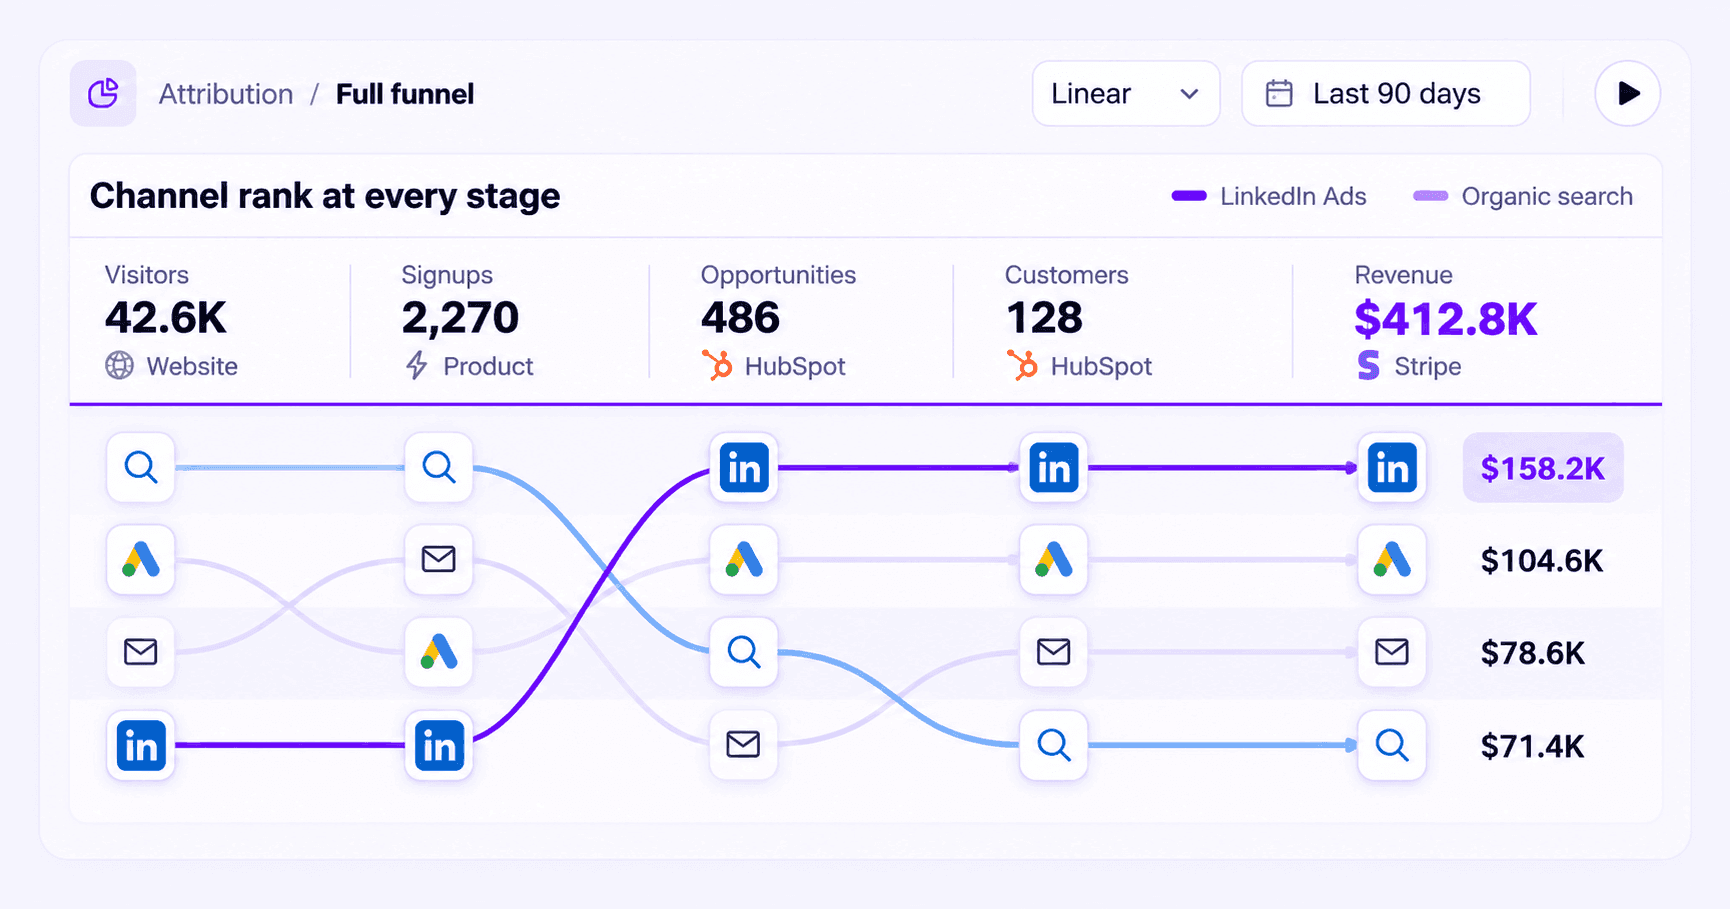
Contact Profiles can provide additional known-user context when identification is available. Anonymous or unmatched traffic remains a reporting limitation rather than a reason to infer an identity.
Connect supported CRM and off-site outcomes
Usermaven’s Event Sources documentation explains how eligible webhook, payment, embedded-form, and CSV events can enter goals and attribution.
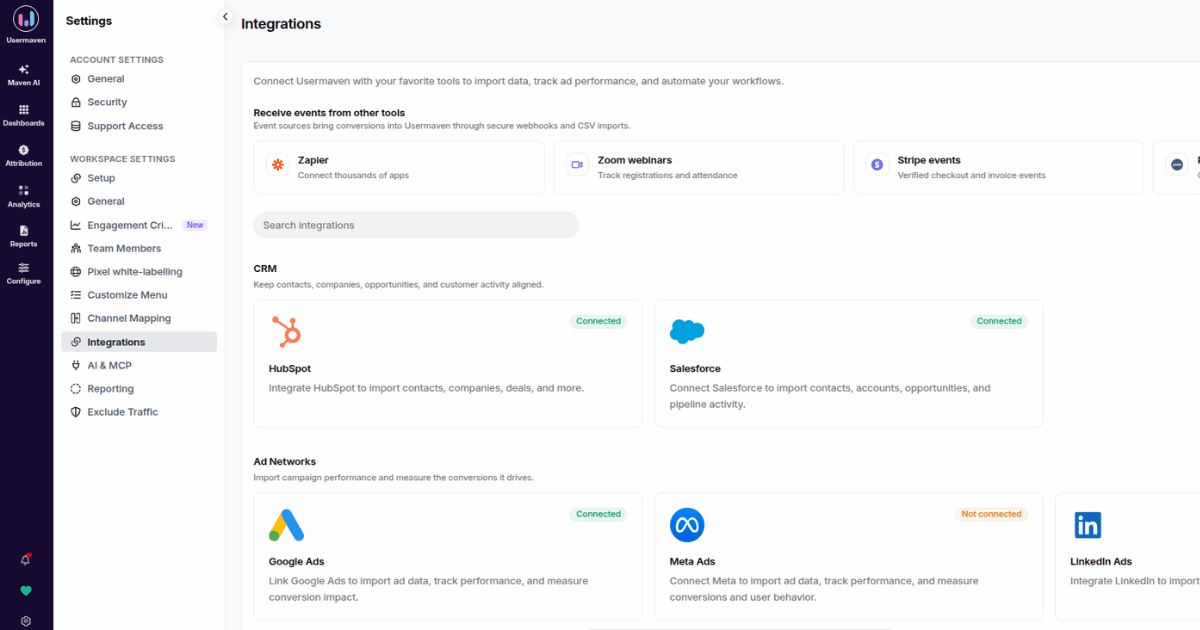
The Salesforce integration documentation describes read-only CRM ingestion and matching to tracked people or accounts. It does not claim every record will match automatically.
Compare marketing credit with a stated model
The channel and source attribution documentation covers built-in credit models and Enterprise custom models. Analysts should document model choices, eligible events, and lookback windows.
Validate inputs with the Measurement Trust Center
The Measurement Trust Center provides a Trust Score, categorized checks, and prioritized fixes for campaign tracking, customer matching, connected platforms, conversion feedback, and data confidence.
Its results help identify measurement gaps; a healthy score does not independently establish legal compliance or prove that all offline touchpoints are present.
Investigate patterns with Maven AI Agents
Maven AI supports analysis and dashboard building from eligible workspace data. Maven AI Agents run scheduled read-only investigations and report findings rather than automatically modifying ad budgets.
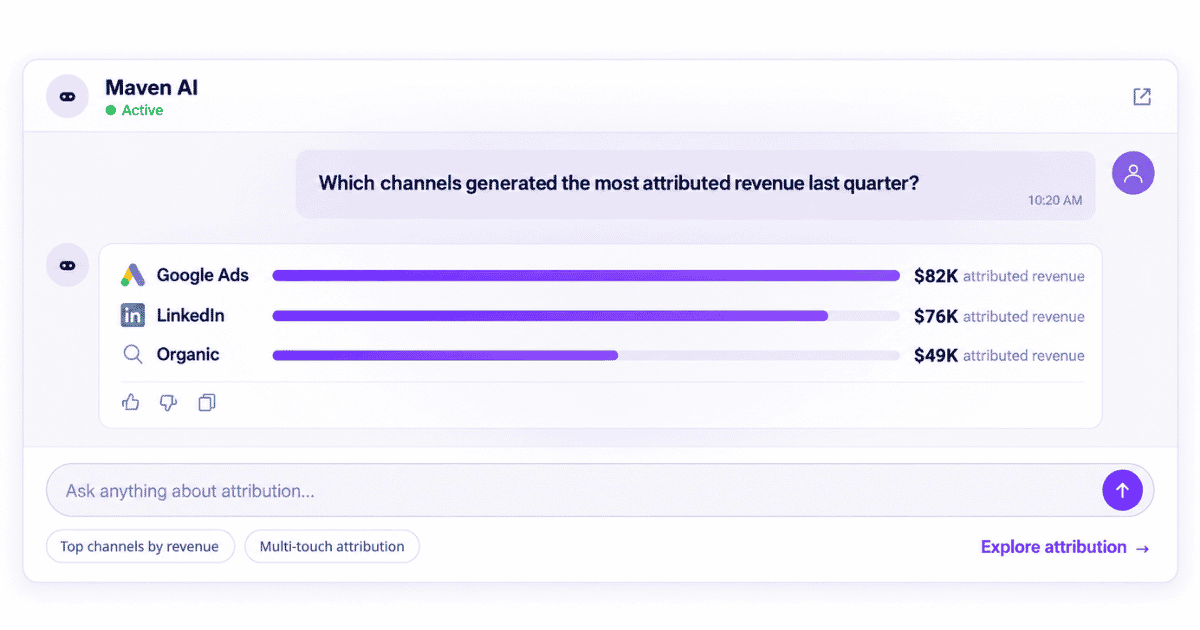
A practical workflow is to schedule a campaign investigation, review a reported conversion-rate change, confirm data quality, and only then decide whether a manual optimization test is justified.
Apply the right fit by industry
For ecommerce teams, the ecommerce analytics solution connects marketing spend with supported orders and repeat-sale outcomes. Enterprise point-of-sale stitching may still require separate data architecture.
What a first-party case study actually shows
Hyperengage previously compared Google Analytics, CRM information, platform dashboards, and manual tracking, which made the role of early marketing touchpoints difficult to interpret.
In the published Hyperengage case study, Usermaven reports that attribution coverage expanded from four channels to six. Organic search received eight first-touch conversions under the revised reporting view.
The case demonstrates improved visibility into measurable channel contribution. It does not isolate the incremental revenue created by the analytics platform, and it is not evidence of complete online-to-offline coverage.
Turn connected data into better decisions
Effective omnichannel analytics begins with a verified outcome, clear data boundaries, and a repeatable quality check. Connected customer paths become useful when teams can explain what is measured and what remains unknown.
For teams connecting digital acquisition, user behavior, CRM events, and revenue, book a demo to evaluate how Usermaven supports trustworthy marketing attribution and journey analysis.
FAQs
1. What is omnichannel analytics in simple terms?
It connects eligible customer interactions across online and offline touchpoints so teams can analyze journeys, outcomes, and reporting gaps rather than viewing every channel separately.
2. How is omnichannel analytics different from multichannel analytics?
Multichannel reporting often compares channels independently. Omnichannel analytics attempts to connect measurable interactions and verified outcomes across channels, while acknowledging identity and integration limits.
3. What data sources are used for omnichannel analytics?
Common sources include website and app events, ad platform activity, email, CRM records, ecommerce or point-of-sale purchases, support conversations, and authorized offline events.
4. Can omnichannel analytics track offline purchases?
It can incorporate offline purchases when a supported operational system supplies verified events and lawful, usable identifiers. Purchases without permitted identity matching should remain unmatched.
5. Which omnichannel analytics metrics matter most?
Prioritize verified conversion rate, channel-assisted conversions, journey-stage completion, time to outcome, match coverage, and revenue tied to clearly defined cohorts.
6. Does omnichannel attribution prove which channel caused a sale?
No. Attribution distributes credit under a model and rules. Incrementality experiments or other causal methods are needed to estimate what would have happened without the intervention.
7. How long does omnichannel analytics implementation take?

Written by
Ryan Mitchell
Marketing Analytics Strategist
Ryan Mitchell is a marketing analytics strategist specializing in campaign measurement, customer journeys, and marketing performance. He writes about analytics, reporting, and data-driven marketing strategies, helping SaaS and B2B teams measure what matters across every stage of the customer journey.
All articles by Ryan →