Your marketing dashboard can look complete and still be wrong.
The numbers add up. The charts look clean. But some of your buyers never show up in them at all.
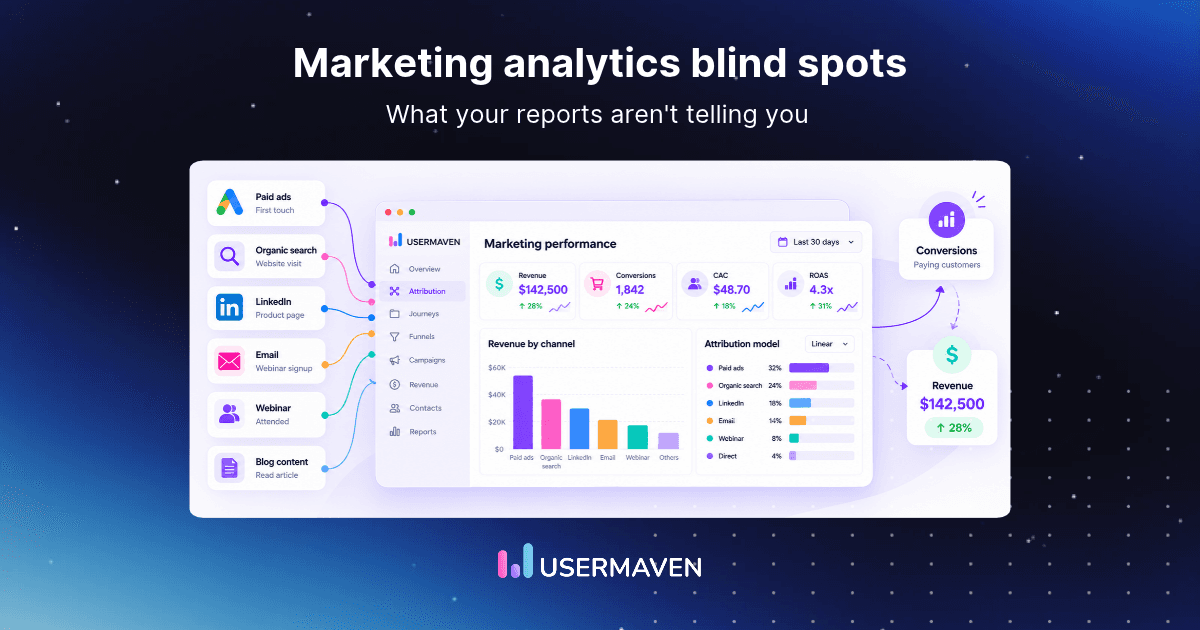
That’s the core problem with marketing analytics. It can only report what it can see. Marketing analytics blind spots are the places where real buyer activity goes missing, gets mislabeled, or gets credited to the wrong channel.
Those gaps matter because budgets follow the data. If a channel looks weak only because its buyers are hidden, you may cut the thing that’s working.
This guide covers the 10 most common blind spots, how to spot each one, and how to fix it. So let’s get right into it.
Make data-driven decisions
faster with Maven AI
Key takeaways
- Your reports don’t always reflect the full customer journey. Ad blockers, cookie restrictions, device switching, and offline interactions can hide important marketing activity.
- Some channels are harder to measure than others. Content, social media, events, and other channels involved early in the buying journey may receive less credit than they deserve.
- Missing data can change your budget decisions. A channel that looks expensive in your dashboard might actually be bringing in more customers than your reports suggest.
- Your CRM can help uncover reporting gaps. Comparing actual customers and revenue with marketing analytics is a useful starting point for identifying missing or disconnected data.
What are marketing analytics blind spots?
Marketing analytics blind spots are parts of the customer journey that your reports fail to capture, connect, or interpret correctly.
Think about a typical B2B buying journey.
A potential customer discovers your company through an industry article. A week later, they click a LinkedIn ad. They return through Google, attend a webinar, and eventually request a demo.
Your dashboard might show Google as the channel responsible for that conversion.
Technically, the report isn’t necessarily wrong. Google may have brought the visitor back before they converted. But the report leaves out the other interactions that helped move the buyer toward that decision.
That’s the difference between having marketing data and having enough context to understand it.
You might also hear the term marketing analytics data gaps. The two concepts are closely related, but they aren’t exactly the same.
| Data gap | Blind spot | |
|---|---|---|
| What it is | Data that’s missing or broken | A decision made without seeing the full picture |
| Example | 30% of visits never reach your analytics tool | Cutting LinkedIn because its buyers were in that missing 30% |
| How you find it | Comparing tools and source systems | Asking which decisions rest on incomplete data |
| Main risk | Wrong numbers | Wrong budget calls |
In other words, data gaps often create blind spots. But blind spots can also come from how you interpret perfectly valid data.
This becomes especially important when your business has a long sales cycle, multiple decision-makers, or several marketing channels contributing to a conversion.
For a closer look at how missing interactions affect channel credit, read our guide to the marketing attribution blind spot.
10 marketing analytics blind spots and how to fix them
Most marketing analytics blind spots fall into three groups: data you never collect, data you can’t connect, and data you read the wrong way.
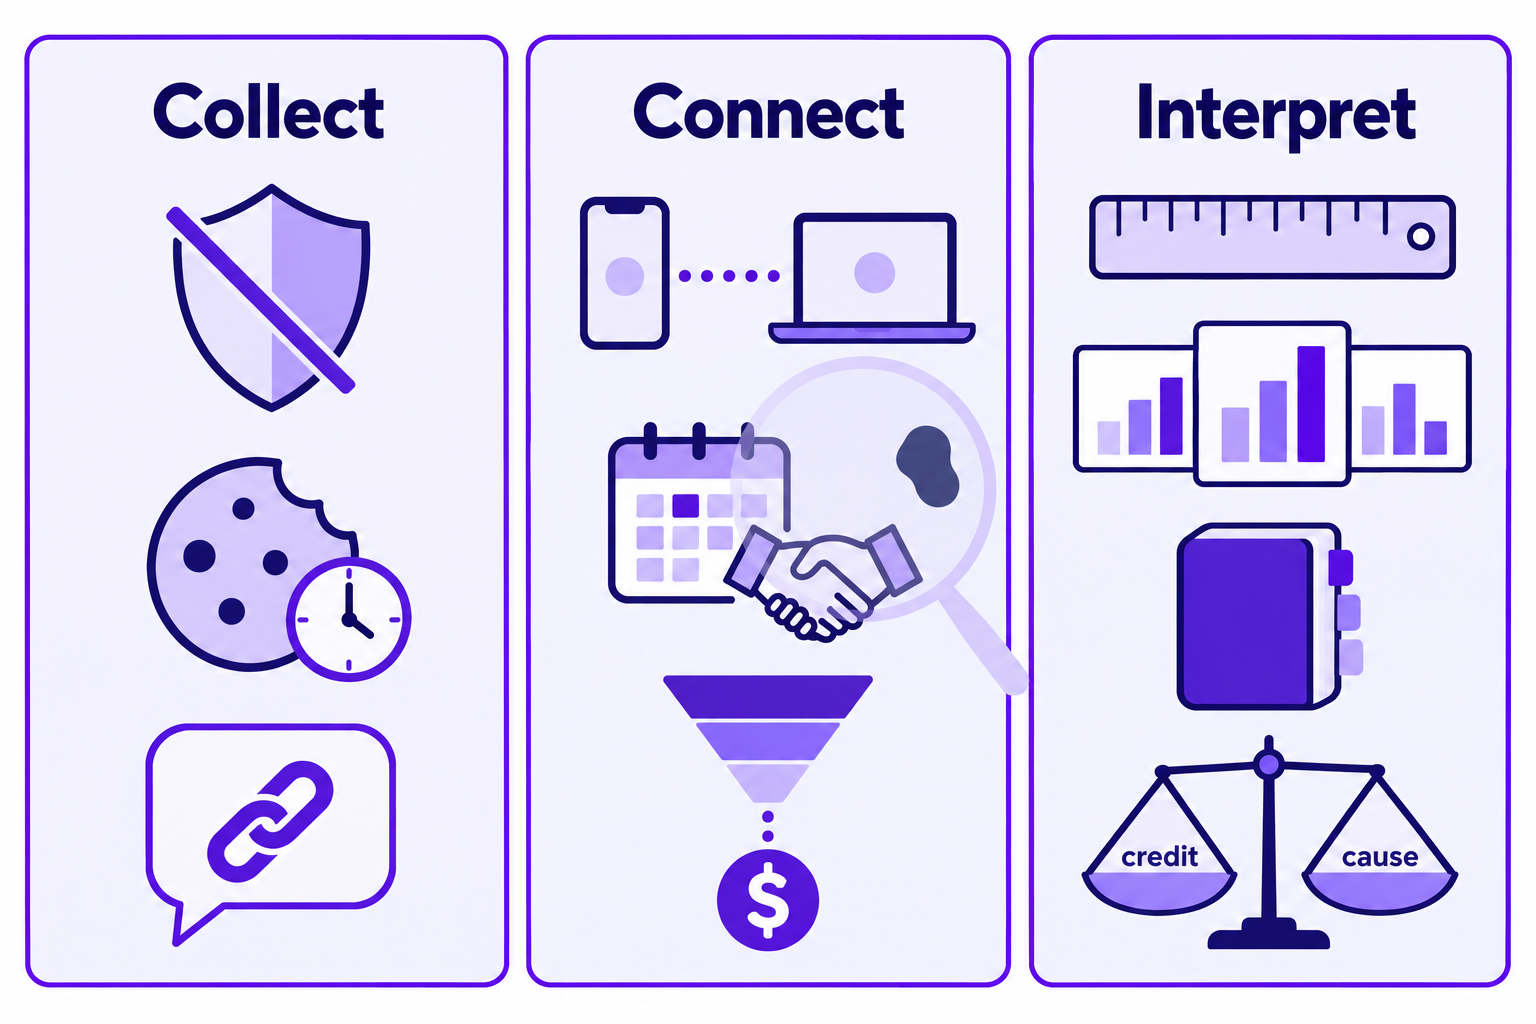
Here are the 10 we see most often:
- Ad blockers and browser limits hide visits
- Consent and cookie limits break journeys
- “Direct” traffic that isn’t really direct
- Buyers switch devices
- Offline and sales touchpoints never get recorded
- Reports stop at the lead
- Lookback windows are shorter than your sales cycle
- Ad platforms grade their own homework
- Zero-click searches and AI overviews hide brand exposure
- Your CRM and ad platforms aren’t sharing conversion data
1. Ad blockers and browser limits hide visits
Imagine you’re running a LinkedIn campaign targeting marketing leaders.
The campaign generates clicks, and people are visiting your website. Some explore your product pages, others read your content, and a few eventually sign up.
But when you open your analytics dashboard, the numbers don’t match what you’re seeing elsewhere.
Your database shows more signups than your analytics platform recorded.
What happened?
Some visitors may have been using ad blockers or browsers that restricted your tracking scripts. Their visits happened, but your analytics tool never received the information.
Now think about what that means for your reporting.
If those visitors came from LinkedIn, the campaign may appear to generate fewer conversions than it actually did. You could end up reducing its budget because the tracking system missed some of its results.
And this isn’t limited to paid advertising. Organic search, referral traffic, and other channels can also lose visibility when browser-based tracking fails.
How to identify this blind spot
Start by comparing completed signups or other key conversions in your analytics platform with records in your database or CRM.
If the numbers consistently differ, investigate whether browser restrictions, blocked scripts, consent settings, or tracking implementation issues are responsible.
Make sure you’re comparing the same events and time periods before drawing conclusions.
How to reduce the gap
Consider server-side tracking to reduce reliance on browser-based scripts.
Instead of depending entirely on the visitor’s browser to send information, supported events can be collected and forwarded through your server infrastructure.
This can improve data collection reliability, although it doesn’t eliminate every tracking restriction or override consent requirements.
The important thing is to recognize that missing visits aren’t just a technical issue. They can change how successful your marketing channels appear.
2. Consent and cookie limits break journeys
Not every blind spot involves a visit disappearing completely.
Sometimes the visit is recorded, but the connection to everything that happened before it gets lost.
Let’s say someone discovers your SaaS product through an organic search.
They read a blog post, explore your features, and leave.
Two weeks later, they return to compare your product with a competitor. A few days after that, they book a demo.
From your perspective, this is one buyer gradually moving toward a decision.
But if the cookie used to recognize that visitor expires or becomes unavailable between visits, your analytics may treat them as separate people.
The first visit might appear as an organic search session. The final conversion could be attributed to direct traffic.
Suddenly, the content that introduced your business gets little or no recognition.
This is particularly problematic for B2B companies, where buyers often take weeks or months to evaluate their options.
How to identify this blind spot
Look at the customer journeys associated with your conversions.
Do an unusually large number of customers appear to convert during their first recorded session?
If your product typically requires considerable research before purchase, that pattern deserves investigation.
It doesn’t automatically prove cookie-related data loss, but it can point toward missing earlier interactions.
How to reduce the gap
Use first-party data where appropriate and make sure your tracking respects visitor consent.
You can also explore cookieless tracking methods that reduce dependence on traditional cookies.
The goal isn’t to track people without permission. It’s to preserve the continuity of permitted customer journeys so your reports don’t repeatedly treat returning buyers as new visitors.
3. “Direct” traffic that isn’t really direct
Direct traffic can look reassuring.
People are visiting your website without coming through an identifiable campaign or referral source. Maybe your brand awareness is improving.
But there’s another possibility.
Imagine a prospect finds your product in a LinkedIn discussion and shares the link in a private Slack channel.
A colleague clicks it, explores your website, and eventually books a demo.
Depending on how the link was shared and what referral information was preserved, that visit might appear as direct traffic.
Your dashboard shows another direct conversion, even though the buying journey involved LinkedIn and a private recommendation.
The same thing can happen with links shared through WhatsApp, email applications, private messages, and other environments that don’t always pass referral information.
This hidden sharing is commonly called dark social.
Visits from AI assistants (such as traffic from ChatGPT) can create similar reporting challenges when referral information is missing, although identifiable AI referrals can be tracked separately.
The problem is that direct traffic can become a collection of journeys your analytics couldn’t properly classify.
How to identify this blind spot
Look for unusual changes in direct traffic.
For example, suppose you publish a popular LinkedIn post on Monday and direct traffic increases significantly over the next two days.
That doesn’t prove LinkedIn caused the increase, but it gives you a reason to investigate.
You can also compare direct conversions with customer responses to questions such as “How did you first hear about us?”
How to reduce the gap
Use consistent campaign tags on links you control, especially those shared through email, social campaigns, and partner promotions.
Combine that information with self-reported attribution to understand where customers remember discovering your business.
You can also use AI traffic attribution to identify visits from AI assistants when the necessary referral signals are available.
You won’t uncover every private conversation, but you can reduce the amount of valuable marketing activity that disappears into the direct traffic category.
4. Buyers switch devices
Think about how you research software.
You might discover a tool while scrolling through LinkedIn on your phone. Later, you open its website on your personal laptop. When you’re ready to book a demo, you use your work computer.
To you, it’s one continuous buying journey.
To an analytics platform without cross-device identity resolution, it may look like three unrelated visitors.
The first visitor reads a blog post. The second compares product features. The third books a demo.
Only the last interaction gets connected to the conversion.
Now imagine this happening across hundreds of potential customers.
Channels that introduce buyers on mobile devices may appear less effective, while channels associated with later desktop visits receive more credit.
That’s not necessarily a reflection of how people discovered your business. It’s partly a reflection of what your tracking can connect.
How to identify this blind spot
Review how many converting customers appear to have very short journeys or first visits immediately before conversion.
Compare those patterns with what you know about your sales cycle and buyer behavior.
If customers typically spend weeks researching your product but analytics shows mostly same-day journeys, you may be missing earlier activity.
How to reduce the gap
Use identity resolution methods to connect anonymous and known activity where technically possible and permitted.
For example, when someone signs in or submits a form, an analytics platform may be able to associate eligible earlier activity with their known profile.
This makes customer journey analytics more useful because you’re evaluating connected interactions rather than treating every device as an entirely new prospect.
Cross-device recognition won’t always be possible, but improving it can reveal marketing contributions that previously went unnoticed.
5. Offline and sales touchpoints never get recorded
A potential customer attends your webinar.
They like what they hear, ask a question during the session, and request more information from your sales team.
Over the next few weeks, they have two sales calls, speak with a colleague who already uses your product, and eventually become a customer.
Now open your web analytics dashboard.
What does it show?
Possibly just a website visit and a demo form submission.
The webinar, conversations, and other interactions that influenced the decision may be sitting in your CRM, event platform, or sales team’s notes.
Your marketing reports never connected them.
This is one of the reasons offline and sales-assisted channels can be difficult to evaluate.
You might spend money sponsoring an industry event that contributes to several valuable deals, but your website analytics alone won’t tell you that.
Without the missing context, the event looks like an expense rather than a potential source of pipeline.
How to identify this blind spot
Talk to your sales team about recently closed deals.
Ask which webinars, events, partner introductions, and sales conversations played a role.
Then check whether those interactions appear in your marketing reporting.
If they exist in your CRM but not in your attribution data, you’ve found an important disconnect.
How to reduce the gap
Bring relevant offline events and sales milestones into your analytics through CRM integrations, event imports, or other supported data connections.
This might include webinar attendance, event check-ins, demo outcomes, opportunity creation, and closed deals.
Our guide to event marketing attribution explains how to approach measurement for event-driven customer journeys.
The goal is to connect what happens outside your website with what happens on it.
Otherwise, you risk judging marketing performance using only the interactions that were easiest to track.
6. Your reports stop at leads instead of revenue
Here’s a situation many marketing teams recognize.
You’re reviewing monthly performance, and one campaign stands out.
It generated 200 leads at a relatively low cost. Another campaign produced only 60 leads and cost considerably more.
At first glance, the decision seems obvious. Increase spending on the campaign generating cheaper leads.
But then you check your CRM.
Of the 200 leads, only three became customers.
The campaign that generated 60 leads brought in 12 customers, including several larger deals.
Which campaign performed better now?
This is what happens when marketing reporting ends at lead generation.
You can measure how efficiently a channel produces form submissions, but you can’t determine whether those leads contribute to meaningful business results.
For B2B SaaS companies, this can be especially misleading because lead quality, deal size, and sales cycles vary considerably.
How to identify this blind spot
Ask whether your marketing reports can answer these questions:
- Which channels generate the most qualified opportunities?
- Which campaigns contribute to closed-won deals?
- How much revenue is associated with each channel?
- Are your cheapest leads actually becoming customers?
If you can only answer these questions by manually combining spreadsheets, your marketing and revenue reporting probably aren’t connected well enough.
How to reduce the gap
Connect marketing analytics with your CRM so lead activity can be linked to opportunity stages, deal outcomes, and revenue.
Our guide to marketing attribution and CRM integration explains why that connection matters.
With revenue attribution, you can evaluate channels based on their contribution to paying customers, not just their ability to generate leads.
That changes the conversation from “Which campaign brought the most leads?” to “Which marketing investments are associated with actual revenue?”
7. Your attribution window is shorter than your sales cycle
Suppose someone discovers your business through an educational blog post in January.
They return in February to explore your product, compare alternatives in March, and finally become a customer in April.
That’s a fairly normal journey for a B2B product with a considered purchasing process.
But imagine your attribution platform only looks back 30 days before conversion.
By the time the customer purchases, the January interaction is outside the reporting window.
It may have been the moment that introduced the buyer to your business, but it no longer appears in the eligible attribution history.
Now consider what happens when this pattern repeats.
Early-stage marketing activities, such as SEO, educational content, and awareness campaigns, may receive less credit than they deserve.
Meanwhile, channels that bring people back shortly before conversion appear disproportionately valuable.
Your marketing reports may unintentionally favor activities that capture existing demand over those that help create it.
How to identify this blind spot
Measure how long customers typically take to move from their first recorded interaction to a closed deal.
Look beyond the average, too. Some customers may convert quickly while others take several months.
Then compare those journey lengths with your attribution platform’s lookback window.
If a meaningful share of your customers take longer to convert than your reporting window allows, earlier interactions may be excluded.
How to reduce the gap
Choose an attribution lookback window that reflects your actual buying cycle.
For a business with a longer sales process, that may mean evaluating interactions over 90, 180, or even 365 days.
A longer window doesn’t automatically make attribution more accurate. It needs to match the way customers buy.
The important thing is to avoid excluding meaningful early interactions simply because your reporting window is too short.
8. Ad platforms grade their own homework
Imagine you’re advertising on Google, Meta, and LinkedIn.
At the end of the month, you open each platform’s dashboard.
Google reports 40 conversions. Meta reports 30. LinkedIn reports 20.
That sounds like 90 conversions.
But your CRM shows only 55 new customers.
Where did the other 35 come from?
They may not be additional customers at all.
Each advertising platform uses its own attribution rules, reporting windows, and conversion definitions.
A buyer might interact with a LinkedIn ad, later click a Google ad, and eventually convert after seeing a Meta campaign.
Depending on their settings, multiple platforms may claim credit for that same conversion.
So when you add the reported conversions together, you’re potentially counting overlapping activity.
This becomes a problem when you compare channels as though every platform is measuring results in exactly the same way.
How to identify this blind spot
Compare the conversions reported by your advertising platforms with actual conversions recorded in your CRM or another consistent source.
Before comparing, check whether the platforms are reporting the same conversion event, date range, and attribution settings.
Differences aren’t automatically evidence of duplicate credit, but large discrepancies deserve investigation.
How to reduce the gap
Use a consistent, independent reporting view to evaluate performance across advertising channels.
You can still use platform dashboards for campaign optimization, but avoid treating their reported conversions as mutually exclusive customers.
Our guide to ad platform discrepancies explains why these numbers differ and how to interpret them.
The bigger lesson is that every advertising platform gives you its own perspective.
To make cross-channel budget decisions, you need a view that accounts for how those channels work together.
9. Zero-click searches and AI overviews hide brand exposure
Imagine someone searching Google for the best marketing attribution tools.
Instead of clicking through to different websites, they read an AI overview that summarizes several options, including yours. They learn about your product, compare features, and move on without visiting your website.
A few days later, they search for your brand directly and book a demo.
Your analytics records the branded visit and conversion. But what about the earlier Google search that introduced your business?
That’s another marketing analytics blind spot.
With AI overviews, featured snippets, and other search features answering questions directly on the results page, people can discover your brand without generating a website visit.
This makes traditional traffic-based reporting less useful for understanding the full impact of your SEO efforts. Your content might influence potential customers even when organic clicks don’t reflect that visibility.
How to identify this blind spot
Look beyond organic traffic when evaluating SEO performance.
- Check Google Search Console for queries gaining impressions but generating relatively few clicks.
- Monitor whether your brand appears in AI overviews for important industry searches.
- Compare branded search trends with your non-branded search visibility.
- Ask new customers how they first discovered your business.
These signals can suggest where exposure is happening without website visits, although they can’t prove that a particular AI overview influenced a conversion.
How to reduce the gap
Expand your SEO measurement beyond rankings, clicks, and organic sessions.
Track search visibility, branded demand, qualified conversions, and revenue alongside traditional SEO metrics. Monitor your presence in AI-generated answers and use self-reported attribution to capture discovery sources that website tracking misses.
You won’t be able to connect every AI overview impression to a customer, but you can develop a more complete understanding of how search contributes to brand discovery and demand.
The important thing is to avoid assuming that fewer clicks automatically mean your SEO efforts are creating less value.
10. Your CRM and ad platforms aren’t sharing conversion data
Imagine you’re running Google Ads and generating hundreds of leads every month.
Google sees the form submissions and keeps optimizing for more of them. But your sales team knows something Google doesn’t.
Some of those leads never respond. Others book demos, become qualified opportunities, and eventually turn into paying customers.
That information lives in your CRM, but it never makes its way back to Google Ads.
So while your marketing reports may show which campaigns generate revenue, the ad platform could still be optimizing for leads rather than the customers who actually bring value to your business.
This is the CRM-to-ad platform disconnect, and it can quietly affect how efficiently your advertising budget is spent.
How to identify this blind spot
Check whether your advertising platforms receive conversion information beyond initial website actions.
- Are your campaigns optimizing for form submissions rather than qualified leads or purchases?
- Can Google Ads or Meta Ads receive relevant downstream conversion events?
- Are important CRM milestones, such as qualified opportunities or closed deals, missing from your conversion setup?
If your CRM knows which leads became customers but your ad platforms don’t receive that information, you may be missing valuable optimization signals.
How to reduce the gap
Connect your CRM and marketing attribution data with your advertising platforms through conversion syncing.
This allows supported conversion events, such as qualified leads, purchases, and upgrades, to be sent back to ad platforms using first-party data and available matching identifiers.
For example, Usermaven’s Conversion Sync supports sending eligible conversion and revenue events to Google Ads and Meta Ads, helping their optimization systems learn from outcomes beyond initial lead generation.
Our guide to improving ad performance with conversion syncs explains how this works.
The goal isn’t just to understand which campaigns generate customers. It’s to make sure your advertising platforms receive the signals they need to optimize toward more valuable outcomes.
How blind spots change your numbers: a worked example
It’s easy to think a few missing visits don’t matter. This example shows how quickly small gaps change a budget decision. The numbers are illustrative.
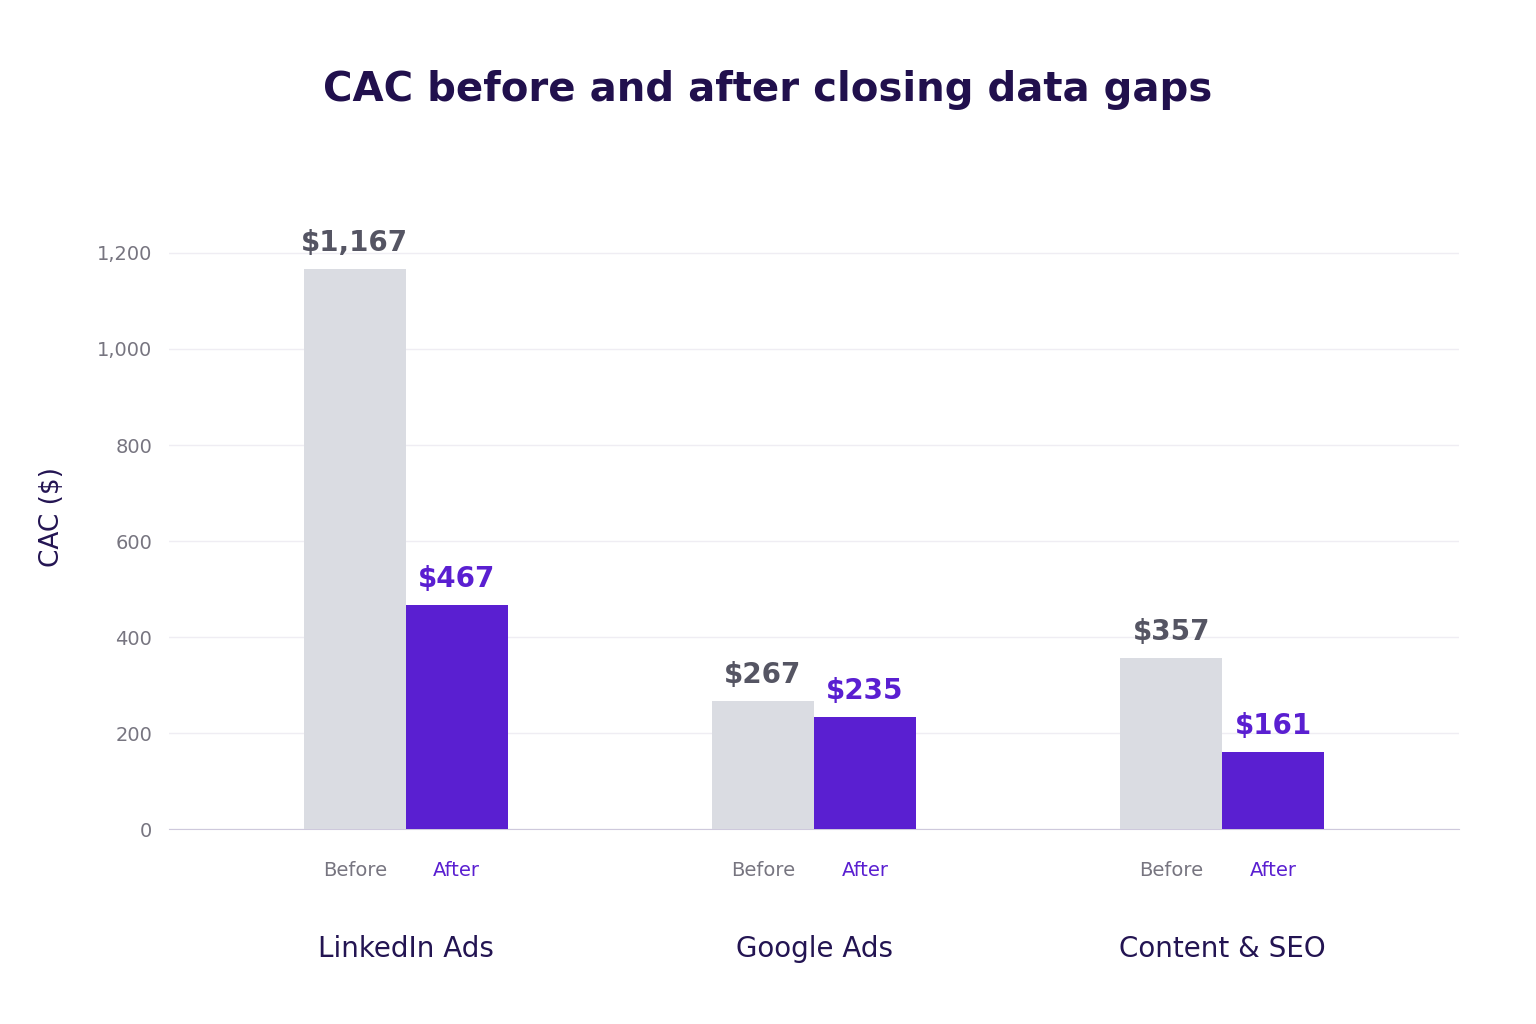
A B2B SaaS company spends $20,000 a month on three channels. Its marketing dashboard reports 50 new customers. But its CRM shows 80 new customers for the same month.
The team traces the 30 missing customers to four marketing analytics data gaps:
- 9 customers were hidden by ad blockers and browser limits.
- 8 customers were filed under “direct” but came from shared links and AI assistants.
- 7 customers first touched a campaign more than 30 days before buying.
- 6 customers came through webinars and sales calls that were never imported.
After the team fixes these gaps, each customer is matched to the channel that brought them. The formula stays the same:
CAC = Channel spend ÷ New customers
Here’s how the numbers change.
| Channel | Spend | Customers in dashboard | Customers after closing gaps | CAC before | CAC after |
|---|---|---|---|---|---|
| LinkedIn Ads | $7,000 | 6 | 15 | $1,167 | $467 |
| Google Ads | $8,000 | 30 | 34 | $267 | $235 |
| Content and SEO | $5,000 | 14 | 31 | $357 | $161 |
| Total | $20,000 | 50 | 80 | $400 | $250 |
What does this example tell us?
Before the fix, Google Ads looked like the clear winner, and LinkedIn looked like the worst channel by far. Content looked average.
After the fix, content was the cheapest channel. LinkedIn’s CAC fell by more than half. Google Ads barely changed, because its buyers were already easy to track.
That’s the pattern behind most blind spots. Short, click-driven journeys are easy to see. Long, research-heavy journeys are not. If you trust the first dashboard, you’d likely cut the two channels doing the most work.
How to find marketing analytics data gaps
You don’t need a full audit to know if you have gaps. Certain symptoms show up again and again.
Use this table to trace a symptom back to its likely cause.
| What you notice | Likely blind spot | First thing to check |
|---|---|---|
| CRM shows more customers than analytics | Blocked tracking or lost identity | Signups in analytics vs. your database |
| Direct traffic spikes after campaigns | Dark social or AI traffic | Sources of new direct visitors |
| Most buyers seem to convert on day one | Device switching or cookie limits | Share of single-session conversions |
| Platform conversions beat real sales | Ad platforms self-reporting | Sum of platform claims vs. CRM |
| Cheap leads rarely become customers | Reports stop at the lead | Revenue by channel, not leads |
| Teams argue about the numbers | Different definitions | How each team defines a lead |
| Brand work never seems to pay off | Short windows or short-term bias | Lookback window vs. sales cycle |
Start with a CRM reconciliation
One useful first step is comparing your marketing analytics with your CRM.
Choose a reporting period, such as last month, and identify how many customers or qualified conversions each system recorded.
Make sure both systems are using comparable definitions, time periods, and event dates.
Then investigate any unexplained differences.
Some gaps may come from missing tracking. Others may result from attribution settings, delayed CRM updates, or differences in how each system counts conversions.
The comparison won’t reveal every blind spot, especially problems involving attribution interpretation, but it gives you a practical starting point.
Our guide to data discrepancies explains how to investigate reporting differences and determine which ones require attention.
Marketing analytics blind spot audit: a 10-point scorecard
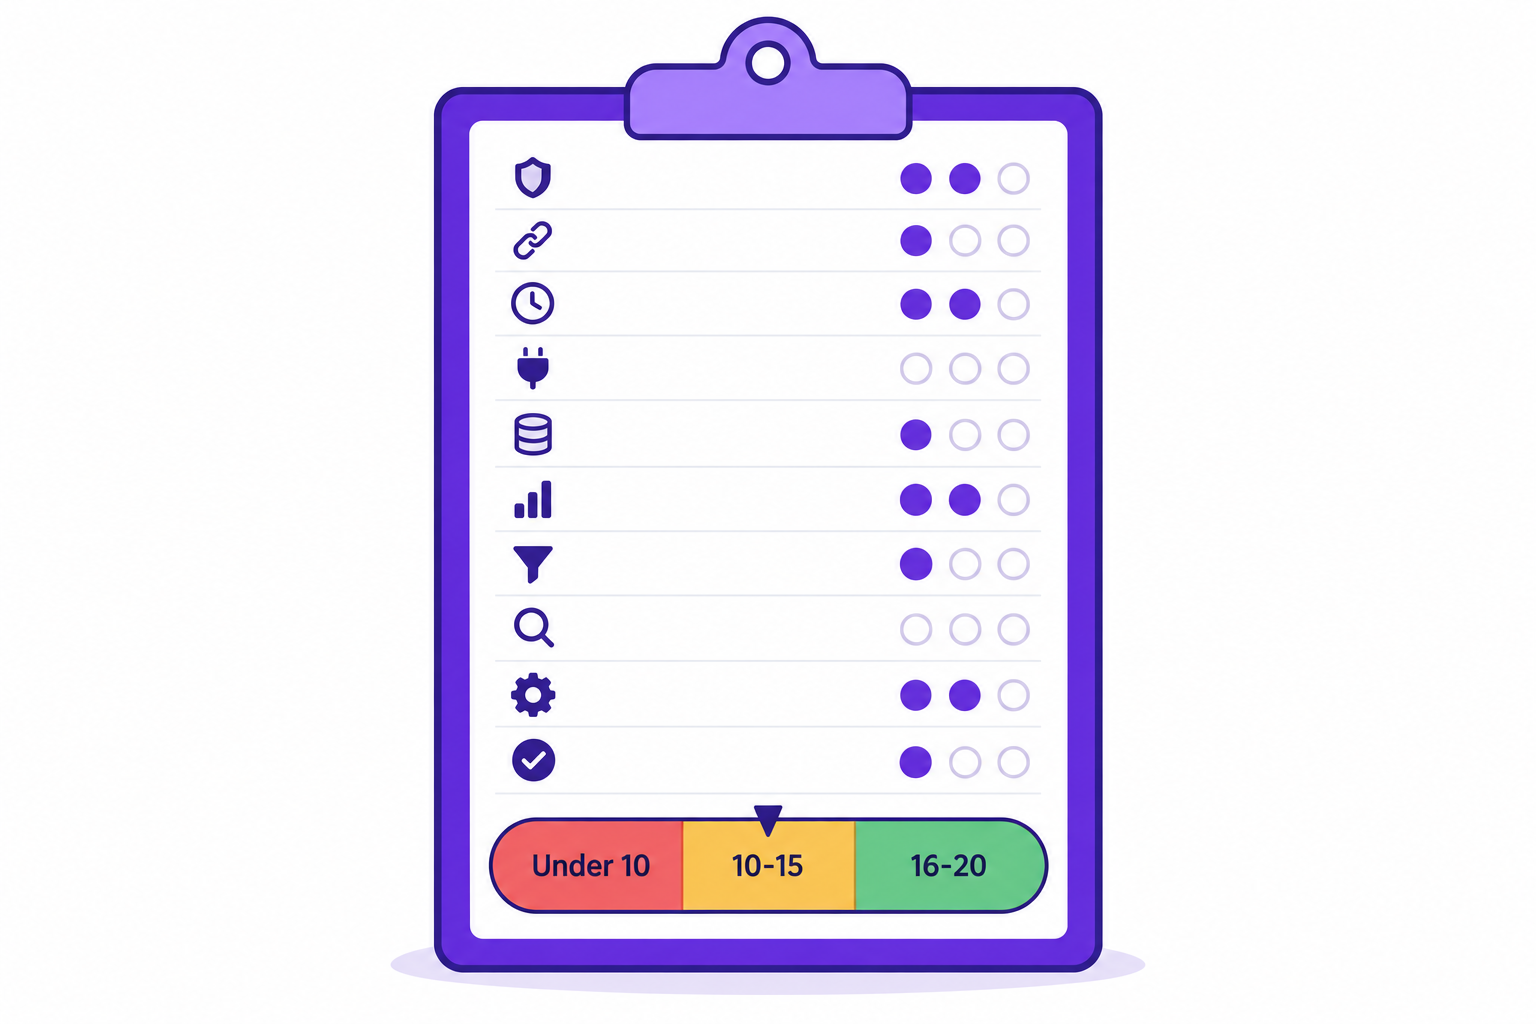
A scorecard turns a vague worry into a clear plan. Answer each question below, and score 0 for no, 1 for partly, and 2 for yes.
| Question | Blind spot it checks | Score (0-2) |
|---|---|---|
| Does key conversion tracking run server-side? | Blocked tracking | |
| Do you collect first-party data on your own domain? | Cookie limits | |
| Can you separate AI and shared-link traffic from true direct? | Dark social and AI traffic | |
| Do you link anonymous visits to known profiles? | Device switching | |
| Do offline events and calls reach your reports? | Offline touchpoints | |
| Can you see revenue by channel? | Reports stop at the lead | |
| Does your lookback window match your sales cycle? | Short windows | |
| Do you count conversions in one independent place? | Platform self-reporting | |
| Do all teams share written metric definitions? | Different definitions | |
| Do you test channels before making major budget shifts? | Credit vs. cause |
How to read your score:
- 16 to 20: Your data is in good shape. Review it every quarter.
- 10 to 15: You have a few blind spots. Fix the 0s first.
- Under 10: Major decisions likely rest on incomplete data. Start with the CRM reconciliation above.
Gain deeper insights with
360° view of your customers
How Usermaven helps close marketing analytics blind spots
Knowing that your marketing data is incomplete is frustrating. What’s harder is figuring out which channels, campaigns, and customer interactions you’re missing.
Usermaven is an AI-powered marketing attribution platform that brings your marketing, website, product, and CRM data together. It helps you uncover missing touchpoints, connect user journeys to revenue, and make better decisions about where to invest.
Here’s how it helps address the blind spots we’ve discussed.
Capture more of the customer journey
Ad blockers, browser restrictions, and disconnected sessions can leave important interactions out of your reports.
Usermaven uses server-side and cookieless tracking to reduce avoidable data loss. Identity resolution and contact profiles help connect customer activity across sessions and devices, so you can better understand what happened before someone converted.
Understand where customers discover you
Not every buyer arrives through a clearly identifiable marketing channel.
Usermaven’s AI traffic attribution helps identify visitors coming from AI assistants such as ChatGPT and Perplexity, while its attribution reporting connects recorded marketing interactions to conversions.
Although zero-click searches and AI overviews don’t always generate trackable visits, you can combine search visibility data with customer journey and conversion reporting to better understand your organic marketing performance.
Connect marketing activity to pipeline and revenue
Generating leads is only part of the story. You also need to know which channels bring qualified opportunities and paying customers.
Usermaven connects with CRMs such as HubSpot and Salesforce and supports offline conversion tracking, helping you link marketing touchpoints with deal stages and revenue.
With attribution lookback windows of up to 365 days, you can also evaluate longer B2B buying journeys without losing sight of earlier interactions.
Send valuable conversions back to ad platforms
Your advertising platforms shouldn’t have to optimize using form submissions alone when you have better conversion data available.
With Usermaven’s conversion sync, you can send supported conversion and revenue events back to Google Ads and Meta Ads.
This helps advertising platforms receive signals from deeper in the customer journey, such as qualified leads and purchases, so campaigns can optimize toward outcomes that matter to your business.
Find reporting gaps and opportunities with AI
Even with connected data, it’s not always obvious where reporting gaps exist or which changes deserve attention.
Usermaven’s Measurement Trust Center checks your tracking setup, connected platforms, and data quality to highlight issues that may affect attribution accuracy.
Maven AI helps you investigate performance through natural-language questions, compare channels, analyze customer journeys, and understand changes in conversions and revenue.
Instead of spending hours piecing together reports, you can focus on understanding what’s happening and what to investigate next.
Final thoughts
Marketing analytics blind spots don’t always mean your tracking is broken. Sometimes important interactions are missing, customer journeys are disconnected, or your reports simply aren’t showing the full picture.
The problem is that these gaps can make effective channels look underperforming and lead you to invest in the wrong places.
Start by comparing your marketing reports with CRM data, reviewing how customers discover your business, and identifying where valuable conversion information gets lost.
Usermaven helps bring those pieces together. As a multi-touch attribution software, it connects customer journeys, marketing spend, conversions, pipeline, and revenue, so you can understand what’s driving growth and make more informed budget decisions.
Explore Usermaven or book a demo to learn more.
Drive business growth
with AI-powered analytics
FAQs
What are marketing analytics blind spots?
Marketing analytics blind spots are parts of the customer journey that your reports fail to capture, connect, or interpret correctly. They can result from blocked tracking, cookie restrictions, device switching, missing offline interactions, or attribution limitations. These gaps can lead marketers to underestimate certain channels or make budget decisions using incomplete information.
What causes data gaps in marketing analytics?
Common causes include ad blockers, browser privacy restrictions, missing tracking events, expired cookies, disconnected customer identities, and offline activities that never reach marketing reports. Data gaps can also arise when marketing and CRM systems use different conversion definitions or reporting periods.
How do you find blind spots in marketing data?
Start by comparing conversion and customer records across your analytics platform, CRM, and other relevant systems. Investigate unexplained discrepancies, unusual direct traffic patterns, short customer journeys, and channels that generate leads but little revenue. Reviewing attribution settings and speaking with your sales team can reveal additional gaps.
How much data do ad blockers hide?
The amount varies by audience, browser, device, and tracking implementation. Some audiences use ad blockers more frequently than others, especially technically experienced users. Because ad blocker adoption doesn’t translate directly into an equivalent percentage of lost analytics events, the most reliable approach is to measure discrepancies in your own tracking setup.
Is direct traffic really direct?
Not always. Direct traffic generally includes visits where analytics can’t identify a referring source. This may include people typing your URL, using bookmarks, or arriving through private messages and applications that don’t preserve referral information. Proper campaign tagging, self-reported attribution, and identifiable AI referral tracking can help clarify some of these visits.

Written by
Lauren Brooks
Lifecycle Marketing Strategist
Lauren Brooks is a lifecycle marketing strategist with 4+ years of experience helping SaaS businesses create meaningful customer experiences. She specializes in user engagement, retention, and conversion optimization, helping brands build stronger customer relationships beyond acquisition.
All articles by Lauren →