Your customers rarely take a straight path from discovering your business to making a purchase.
They visit different pages, interact with campaigns, compare options, and sometimes disappear before converting. But where are they getting stuck, and which interactions actually move them forward?
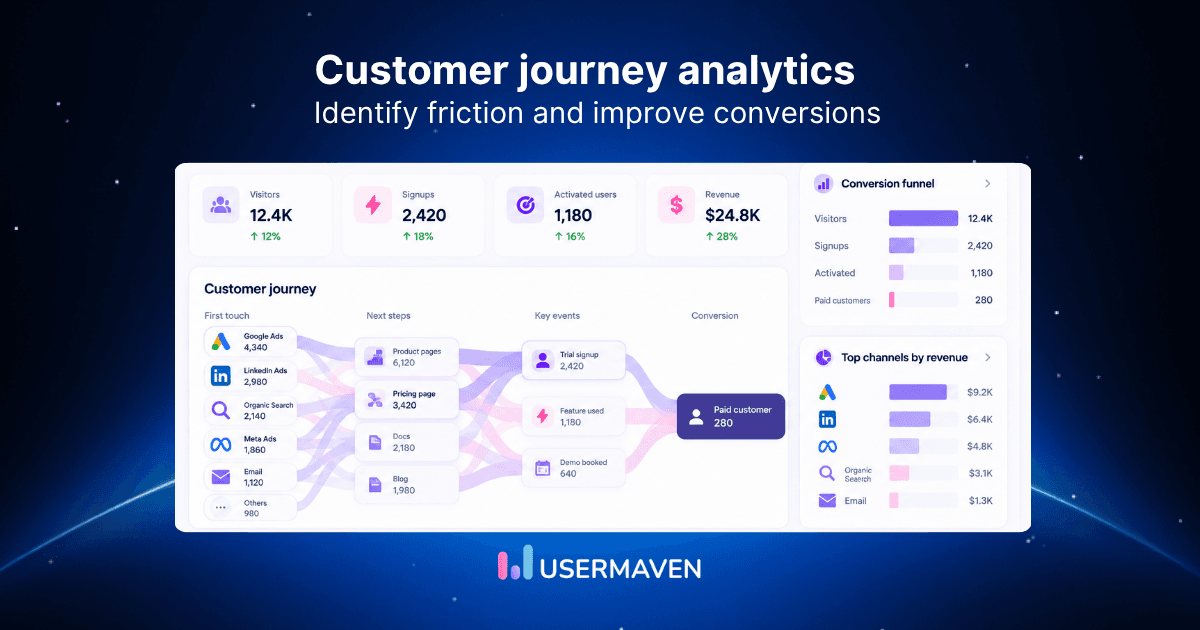
Customer journey analytics helps you connect these interactions, uncover conversion gaps, and understand what contributes to better business outcomes.
Let’s explore how it works, what you should measure, and how to turn customer behavior into insights that improve conversions, retention, and revenue.
Gain deeper insights with
360° view of your customers
Key takeaways
- Customer journey analytics reveals how customers interact with your business. It connects touchpoints across marketing, sales, and product to help you understand their paths to conversion.
- Analyzing customer behavior helps uncover conversion gaps. Funnel analysis, path analysis, and customer segmentation reveal where users drop off or struggle to move forward.
- The right metrics turn journey data into actionable insights. Track conversion rates, drop-offs, activation, retention, and revenue to measure performance.
- Marketing attribution connects customer journeys to business outcomes. It helps you understand how different channels and interactions contribute to conversions, pipeline, and revenue.
- Customer journey analysis is an ongoing process. Regularly review customer behavior, test improvements, and measure results to improve experiences and drive growth.
What is customer journey analytics?
Customer journey analytics is the process of collecting and analyzing customer interactions across different channels and touchpoints to understand how people move from initial interest to conversion and beyond.
It brings together data from your website, marketing campaigns, product, and CRM to reveal the paths customers take and where they drop off.
For example, a B2B SaaS might use customer journey analytics to understand:
- Which marketing channels attract qualified leads?
- What pages do prospects visit before booking a demo?
- Where do users abandon the signup or onboarding process?
- How long does it take for a lead to become a paying customer?
- Which interactions contribute to conversions and revenue?
Unlike traditional analytics that often examines individual channels or events, customer journey analytics looks at how interactions connect across the customer lifecycle.
This helps businesses identify patterns, investigate friction, and make more informed decisions about improving customer experiences and business results.
Gain deeper insights with
360° view of your customers
How does customer journey analytics work?
Customer journey analytics works by connecting data from different customer touchpoints to reveal how people interact with your business over time.
The process typically involves four stages:
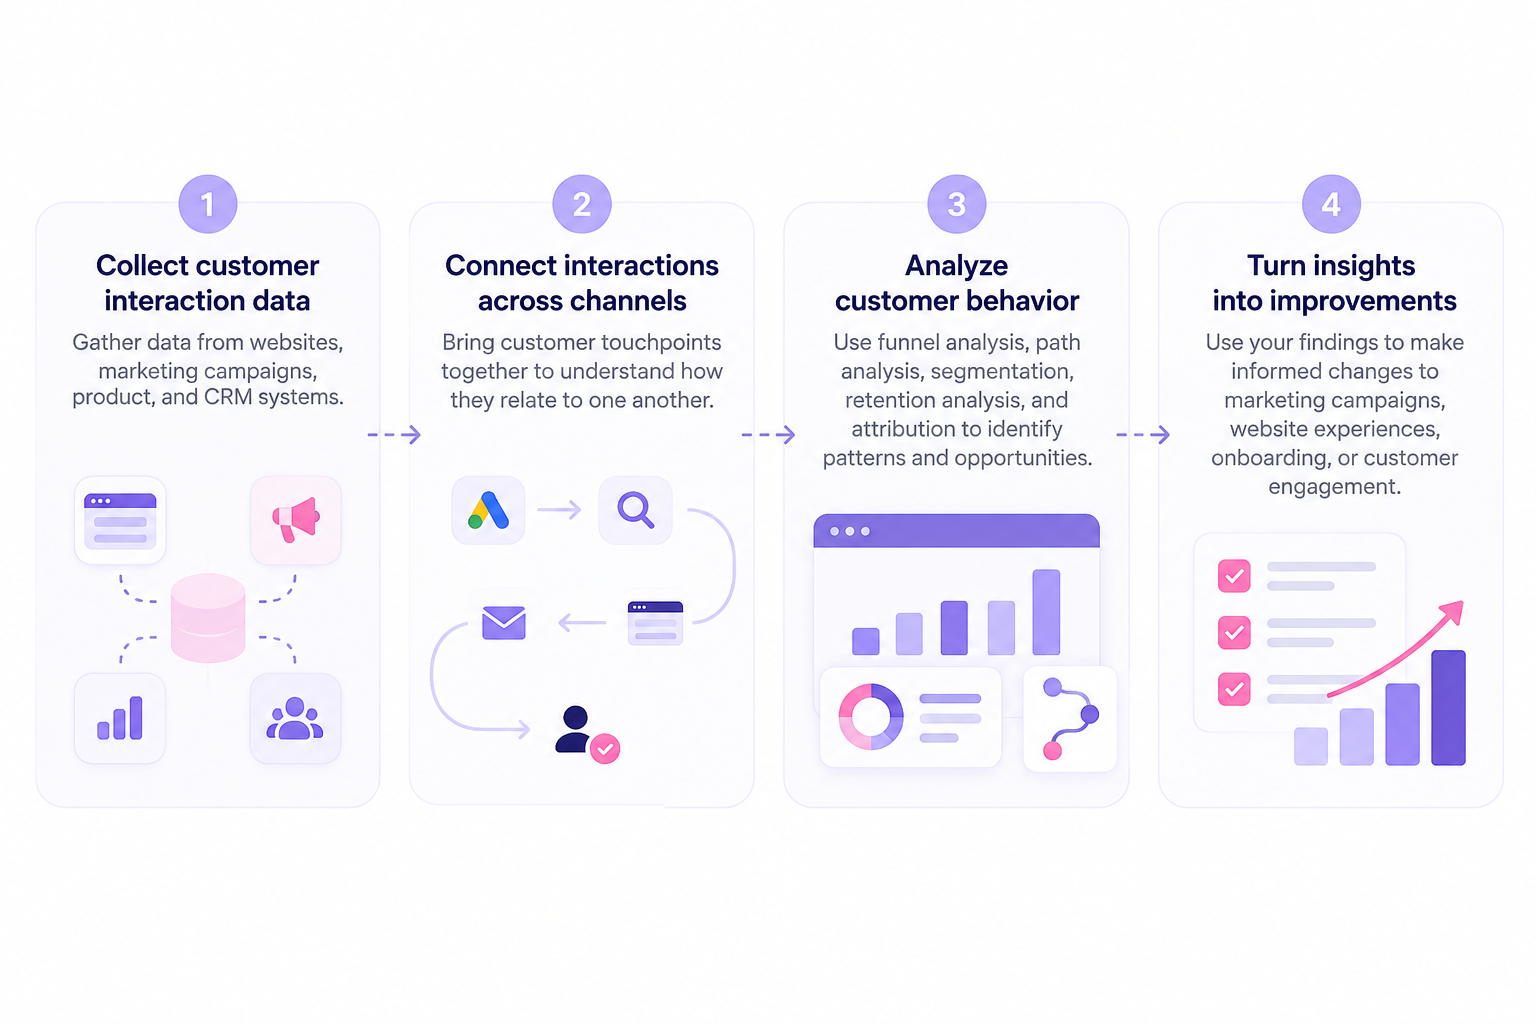
1. Collect customer interaction data
Gather data from websites, marketing campaigns, product usage, and CRM systems.
This includes page visits, ad clicks, form submissions, signups, purchases, and other meaningful events.
2. Connect interactions across channels
Bring customer data together to understand how different touchpoints relate to one another.
For example, a prospect might discover your business through Google Ads, return through organic search, and book a demo after receiving an email.
Connecting these touchpoints matters because customers don’t experience your business one channel at a time. According to Salesforce’s State of the Connected Customer research, 74% of customers have used multiple channels to start and complete a transaction.
Analyzing these interactions together helps businesses understand the complete journey instead of evaluating each channel separately.
3. Analyze customer behavior
Use different analytical methods to identify patterns and opportunities:
- Path analysis: Understand the routes customers take through your website or product.
- Funnel analysis: Identify where customers drop off before completing a goal.
- Segmentation: Compare behavior across customer groups, channels, or campaigns.
- Retention analysis: Understand how customer engagement changes over time.
- Marketing attribution: Evaluate how different touchpoints contribute to conversions and revenue.
4. Turn insights into improvements
Use your findings to make informed changes to marketing campaigns, website experiences, onboarding, or customer engagement.
For example, if users from a particular campaign frequently abandon signup, you can investigate the landing page experience, test improvements, and measure whether conversion rates increase.
The goal is to move beyond tracking individual events and understand how customer interactions contribute to business outcomes.
5 benefits of customer journey analytics
Customer journey analytics gives businesses a clearer view of performance across the customer lifecycle.
Here are five ways it can help improve results:
- Improve conversion rates: Discover which experiences lead to successful conversions and where changes could help more visitors complete their goals.
- Reduce customer acquisition costs: Evaluate how different channels contribute to customer acquisition and identify opportunities to use your marketing budget more efficiently.
- Create more relevant experiences: Understand how different customer segments engage with your business and tailor content, messaging, and offers accordingly.
- Increase customer retention: Spot changes in engagement that may indicate customers are losing interest, giving teams an opportunity to respond.
- Improve marketing ROI: Connect customer interactions with conversions and revenue to make more informed decisions about marketing investments.
Customer journey analytics vs. customer journey mapping
Customer journey analytics and customer journey mapping both help businesses understand customer experiences, but they serve different purposes.
Customer journey mapping visualizes the experience customers have with your business, including their goals, expectations, and challenges.
Customer journey analytics uses behavioral data to examine actual customer interactions, identify patterns, and measure performance.
Here’s how they compare:
| Aspect | Customer journey analytics | Customer journey mapping |
|---|---|---|
| Main focus | Customer behavior and performance | Customer experience and expectations |
| Data sources | Analytics, events, CRM data | Interviews, feedback, research |
| Approach | Quantitative analysis | Qualitative and visual research |
| Key output | Paths, funnels, trends, and metrics | Visual journey map |
| Best for | Measuring behavior and outcomes | Understanding customer needs |
Which one should you use?
Ideally, both.
A journey map might reveal that customers find onboarding confusing. Journey analytics can then show how many users abandon setup, which steps have the highest drop-offs, and whether improvements make a difference.
Together, they help you understand both the customer experience and the measurable behavior behind it.
How to analyze customer journeys in 6 steps
Knowing how customer journey analytics works is one thing. The real value comes from using that data to answer specific business questions and improve performance.
Here’s a practical approach to customer journey analysis.
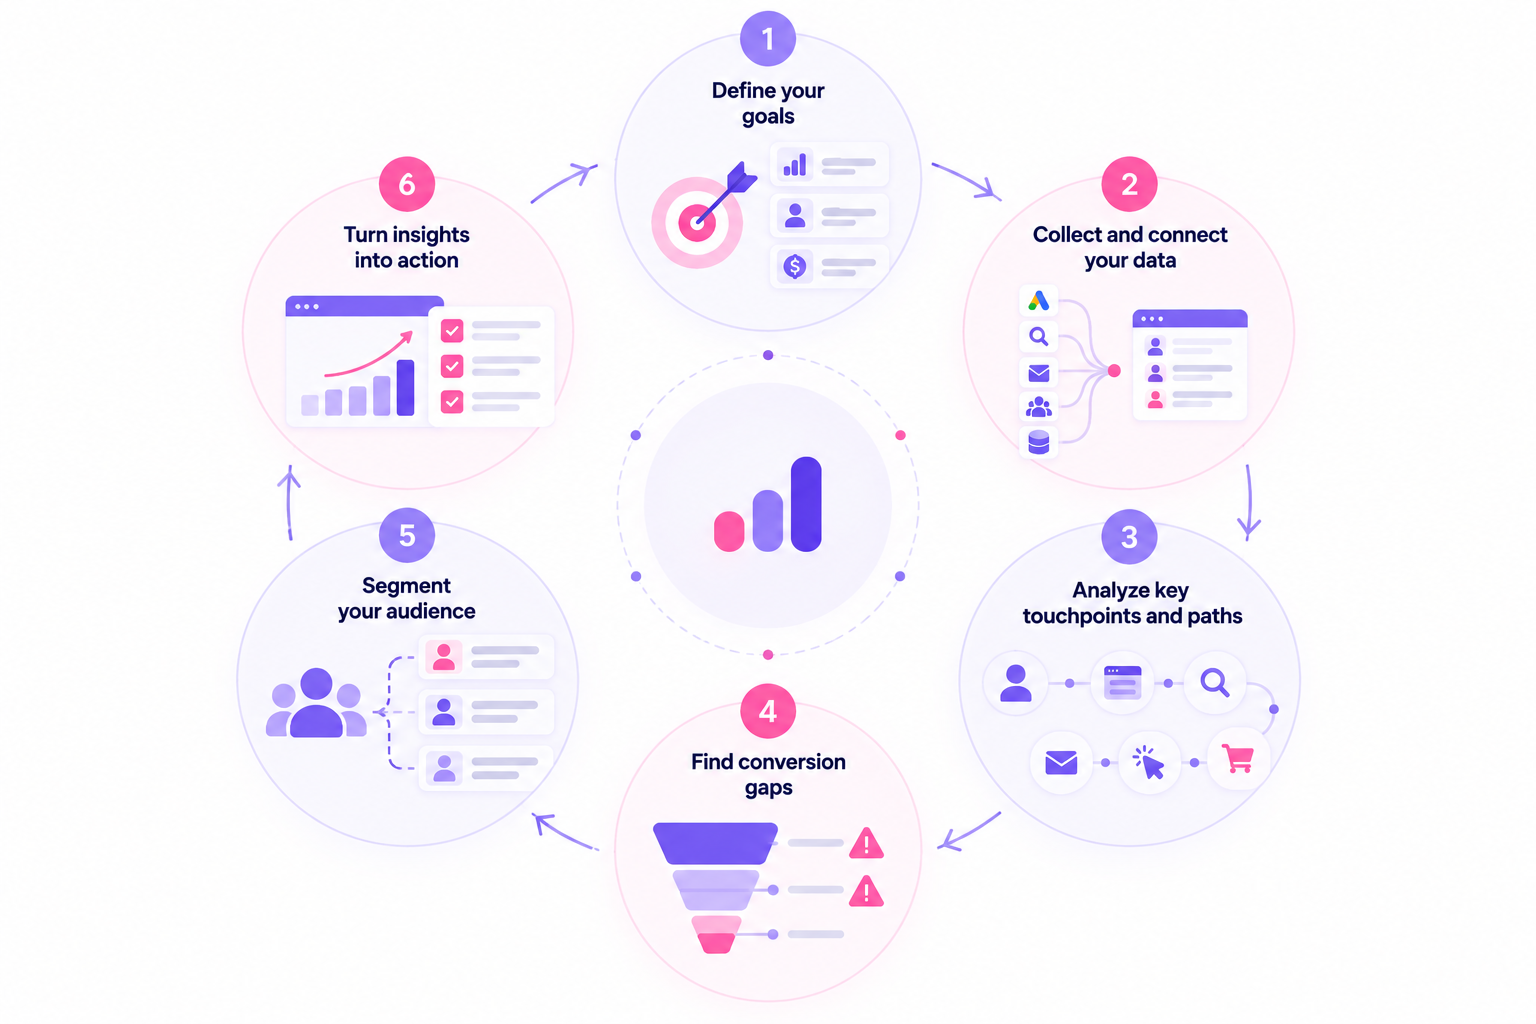
1. Start with a specific business question
Before opening your analytics dashboard, decide what you want to investigate.
For example:
- Why are visitors abandoning the demo booking process?
- Which acquisition channels bring customers who activate?
- Why do some trial users convert while others don’t?
- How long does it take prospects to move from signup to purchase?
Choose one question and define the conversion event or outcome you want to analyze.
Example: A SaaS company notices that trial signups are increasing, but paid conversions remain flat. Its goal is to understand what prevents trial users from upgrading.
2. Choose the right data and time period
Focus on the events and data sources relevant to your question.
For trial-to-paid conversion, you might need:
- Trial signup dates and acquisition sources.
- Onboarding completion and key feature events.
- Subscription upgrades and payment events.
- Customer segments and plan information.
Choose a time period that gives customers enough time to complete the journey.
For example, analyzing seven days of data may be misleading if customers typically take 30 days to purchase.
3. Build a funnel around your conversion goal
Create a journey funnel showing the important steps customers complete before reaching your goal.
For a SaaS trial, that might look like:
Trial signup → Onboarding completed → Key feature used → Paid subscription
Measure how many users reach each step and where the largest drop-offs occur.
If 60% of users complete onboarding but only 25% use a key feature, that gap deserves further investigation.
Remember that a funnel measures progression through defined events. It doesn’t necessarily capture every interaction or explain why someone drops off.
4. Compare journeys across customer segments
Overall conversion rates can hide important differences between customer groups.
Break down your analysis by relevant segments, such as:
- Acquisition channel or campaign.
- New versus returning visitors.
- Company size or customer type.
- Device or geographic market.
- Product plan or signup cohort.
For example, users from organic search might activate more frequently than users from paid campaigns.
That doesn’t automatically mean one channel is better. Compare lead quality, acquisition costs, revenue, and other relevant factors before drawing conclusions.
5. Investigate what happens before and after drop-offs
Once you’ve identified a problem, explore the surrounding customer behavior.
Use path analysis to understand which actions customers take before leaving a funnel or returning later.
You can also review customer feedback, support requests, or interviews to investigate possible reasons.
Example: If users abandon onboarding after connecting an integration, support tickets might reveal that setup instructions are unclear.
This gives your team a specific issue to investigate rather than assuming customers simply aren’t interested.
6. Test improvements and measure the results
Turn your findings into a testable change.
For example, if integration setup appears to be causing friction, you could introduce clearer instructions or a guided setup experience.
Then:
- Establish your current conversion rate as a baseline.
- Test the proposed improvement.
- Compare results across comparable customer groups.
- Monitor downstream outcomes, not just the immediate conversion.
- Keep, adjust, or reverse the change based on the evidence.
Where practical, use A/B testing to separate the impact of your changes from other factors.
The goal of customer journey analysis is to make better decisions using evidence, not simply produce more reports.
Customer journey analytics example for a B2B SaaS
Imagine a B2B SaaS getting 2,000 trial signups in a month, but only a small percentage become paying customers.
The team analyzes its trial-to-paid funnel to understand where users are dropping off.
Here’s what the data reveals:
| Journey stage | Users | Conversion from previous step |
|---|---|---|
| Trial signup | 2,000 | 100% |
| Onboarding completed | 1,400 | 70% |
| First key feature used | 700 | 50% |
| Paid subscription | 280 | 40% |
What can we learn from this data?
The company has an overall trial-to-paid conversion rate of 14%, but the biggest drop-off occurs between onboarding and first feature use.
Half of the users who complete onboarding never reach the first key feature.
This suggests that the company should investigate what prevents users from experiencing the product’s value.
For example, the team could:
- Review the steps between onboarding and first feature use.
- Compare activation rates across acquisition channels.
- Interview users who completed onboarding but never activated.
- Test more relevant onboarding guidance.
The team can then measure whether these changes increase feature adoption and, ultimately, paid conversions.
The takeaway: Customer journey analytics helps you identify where to investigate and measure whether improvements lead to better outcomes. It doesn’t automatically explain why customers behave a certain way.
Key customer journey analytics metrics to track
Not every metric matters equally. The right customer journey analytics KPIs depend on what you’re trying to improve, whether that’s conversions, product engagement, or revenue.
Here are the most useful metrics to monitor:
| Metric | What it measures |
|---|---|
| Conversion rate | Percentage of users completing a desired action |
| Funnel drop-off rate | Percentage leaving between two funnel steps |
| Time to conversion | Time taken to complete a conversion |
| Activation rate | Percentage reaching a defined product milestone |
| Customer retention rate | Percentage of customers retained over a period |
| Customer churn rate | Percentage of customers lost over a period |
| Customer acquisition cost (CAC) | Average cost of acquiring a customer |
| Customer lifetime value (CLV) | Estimated value of a customer relationship |
| Attributed revenue | Revenue credited to marketing touchpoints under an attribution model |
How to choose the right metrics
Focus on the metrics that match your business goals.
For example, if you’re trying to improve trial conversions, track activation rates, funnel drop-offs, and trial-to-paid conversions.
If your priority is marketing performance, look at acquisition costs, attributed revenue, and conversion rates across channels.
One important point: Don’t evaluate these metrics in isolation. A channel with a high conversion rate isn’t necessarily your most profitable channel, especially if acquisition costs are high or customer value is low.
Common customer journey analytics challenges and solutions
Customer journey analytics can reveal valuable insights, but getting an accurate picture isn’t always easy.
Here are some common challenges businesses face and how to address them.
| Challenge | Why it matters | How to address it |
|---|---|---|
| Disconnected data | Customer interactions remain scattered across tools | Connect relevant analytics, CRM, and marketing data |
| Missing touchpoints | Some interactions aren’t tracked or identifiable | Improve event tracking and review data gaps |
| Cross-device tracking | One customer may appear as multiple users | Use reliable identity matching where permitted |
| Inconsistent event data | Incorrect or duplicate events distort reports | Standardize event names and validate tracking |
| Long buying cycles | Short reporting windows miss earlier interactions | Use appropriate attribution lookback periods |
| Misleading conclusions | Correlation may be mistaken for causation | Validate findings with experiments and customer research |
How to improve data reliability
Start by reviewing your tracking setup, fixing missing or duplicate events, and keeping data consistent across your analytics and CRM tools.
For example, Usermaven’s Measurement Trust Center helps teams monitor tracking health, identify data quality issues, and improve confidence in their analytics.
Regularly validate your data, respect customer privacy preferences, and account for tracking limitations when interpreting results.
Reliable customer journey analytics starts with data you can trust.
Turn customer journey insights into revenue with Usermaven
Usermaven is an AI-powered marketing attribution platform that helps you investigate these questions by connecting customer behavior with marketing and revenue data.
Here’s how you can use its capabilities to find answers:
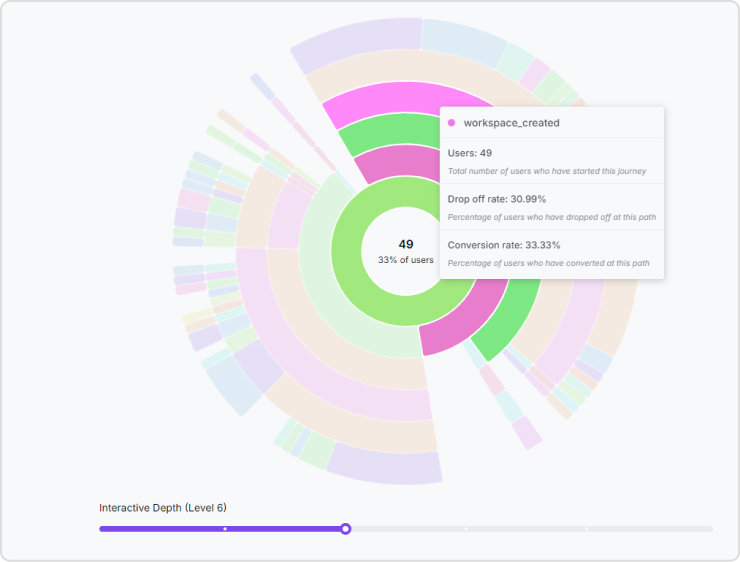
- User Journeys: Explore the paths visitors take before and after important actions. Identify common routes, unexpected exits, and pages that influence conversions.
- Funnels and Segments: Compare signup, activation, and purchase funnels across different customer groups to find where conversion opportunities are being lost.
- Contact Profiles: Follow individual customer activity alongside acquisition sources to understand how visitors become users and engage with your product.
- Multi-touch Attribution: Connect marketing interactions with conversions, CRM opportunities, and revenue to evaluate which channels contribute to valuable customers.
- Maven AI: Ask questions like “Where are users dropping off during onboarding?” or create an AI Agent to review conversion performance regularly and highlight meaningful changes.
- Model Context Protocol (MCP): Connect Usermaven with compatible AI assistants to explore customer journey data, investigate conversion patterns, and get insights without manually switching between dashboards.
Instead of simply knowing that conversions dropped, you can investigate where the drop happened, which customers were affected, and what the results mean for your business.
Gain deeper insights with
360° view of your customers
In summary
Customer journey analytics helps you understand what customers actually do, where they struggle, and which interactions contribute to conversions.
The real value comes from turning those findings into action. By analyzing customer behavior, tracking the right metrics, and testing improvements, you can create better experiences and make more informed growth decisions.
Usermaven helps you take this a step further by connecting customer behavior with marketing attribution and revenue data, so you can identify what drives conversions and make smarter growth decisions.
Book a demo now and learn how Usermaven can help you get more value from your customer journey data.
FAQs
What is the difference between customer journey analytics and traditional web analytics?
Traditional web analytics focuses on website activity, such as traffic, page views, and conversions. Customer journey analytics connects interactions across multiple channels and systems to understand how customers progress over time, including activities that happen beyond the website.
What are the different types of customer journey analytics?
Common approaches include descriptive analytics to understand past behavior, diagnostic analytics to investigate performance changes, predictive analytics to estimate future outcomes, and prescriptive analytics to recommend actions. Predictive and prescriptive capabilities depend on the tools and data available.
Can customer journey analytics predict customer churn?
Customer journey analytics can help identify behavioral patterns associated with churn, such as declining engagement or reduced feature usage. Predictive models can estimate churn risk when sufficient historical data is available, but they cannot predict individual customer decisions with certainty.
How often should businesses analyze customer journeys?
It depends on your business and customer lifecycle. High-volume conversion funnels may need daily or weekly reviews, while longer B2B buying journeys may benefit from monthly analysis. Significant changes in conversion rates, customer behavior, or revenue are also reasons to investigate sooner.
How do you choose the right customer journey analytics tool?
Look for a tool that supports your important data sources, customer identification needs, funnel and path analysis, segmentation, and reporting requirements. If your goal includes measuring marketing’s contribution to revenue, prioritize CRM and multi-touch attribution capabilities.

Written by
Lauren Brooks
Lifecycle Marketing Strategist
Lauren Brooks is a lifecycle marketing strategist with 4+ years of experience helping SaaS businesses create meaningful customer experiences. She specializes in user engagement, retention, and conversion optimization, helping brands build stronger customer relationships beyond acquisition.
All articles by Lauren →