A campaign can bring people to your website and generate signups, but those numbers do not show whether new users reach value, adopt important features, or stay. A product can retain customers well, yet the team may not know which acquisition efforts brought them in.
Marketing analytics measures how campaigns, channels, and other marketing activities contribute to business outcomes. Product analytics examines how people behave while using a website, app, or software product.
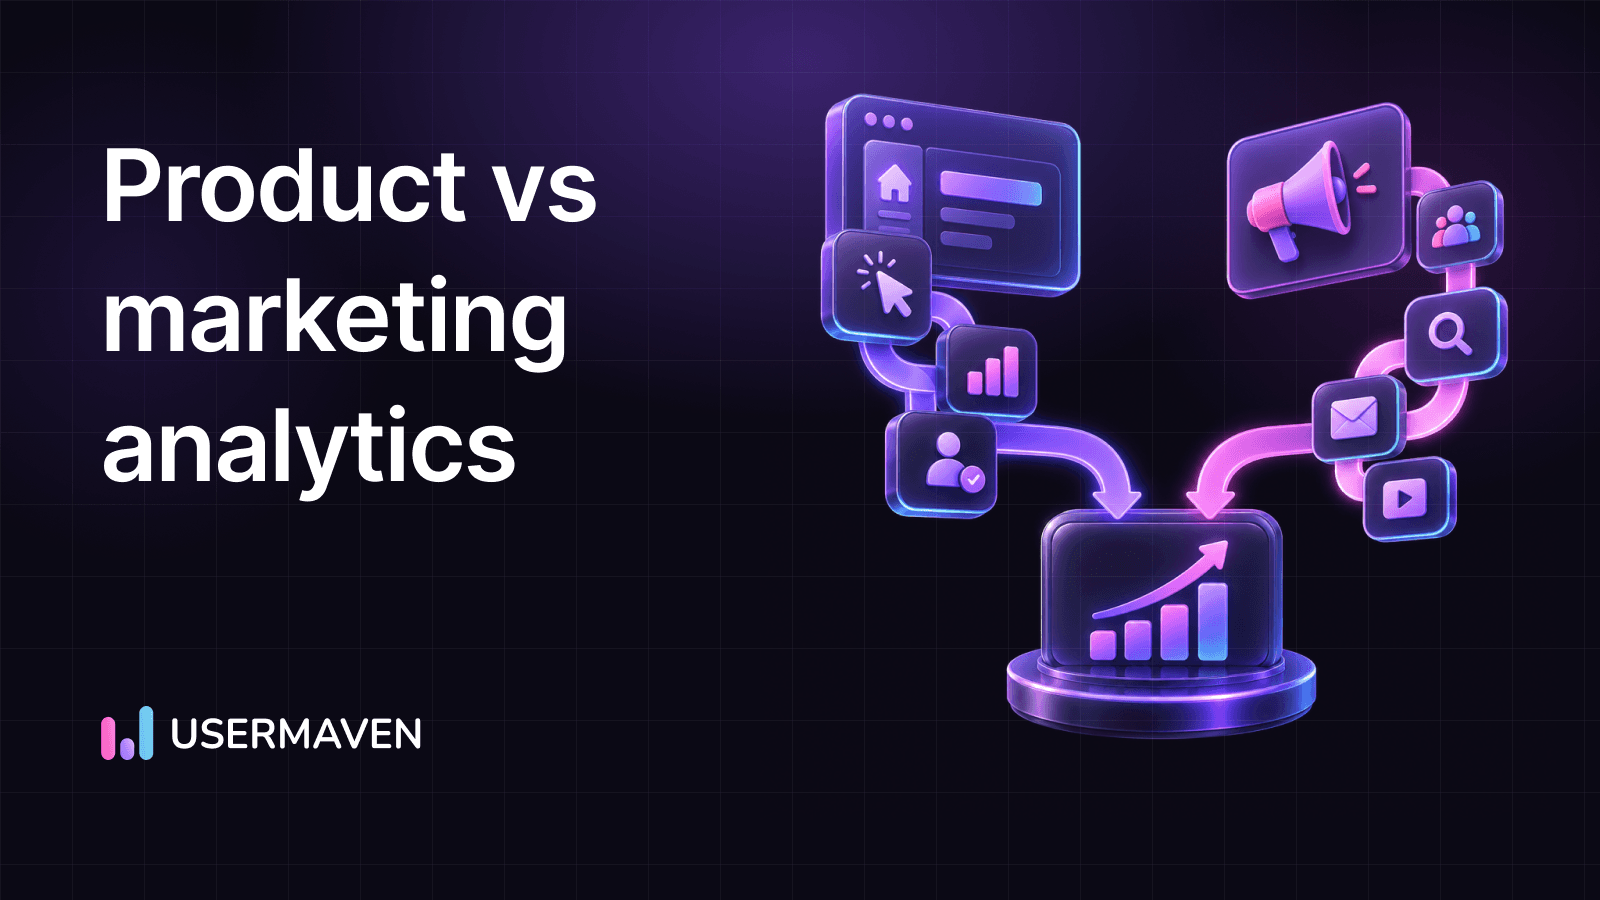
The two disciplines answer different questions, but they are most useful when connected. Together, they help teams understand not only where users come from, but also what they do next and which journeys lead to lasting value.
Key takeaways
- Marketing analytics: Marketing analytics evaluates channels, campaigns, website conversions, acquisition costs, and the revenue influenced by marketing.
- Product analytics: Product analytics studies user behavior inside a digital product, including activation, feature adoption, engagement, and retention.
- Shared outcomes: The disciplines overlap around conversion, customer journeys, and revenue, but they use different views of the same customer lifecycle.
- Acquisition quality: Connecting acquisition sources with product behavior helps teams compare the quality of users from different campaigns, not just the volume of signups.
- Reliable measurement: A useful analytics setup depends on consistent event definitions, reliable identity data, and shared business outcomes.
Product vs. marketing analytics at a glance
| Comparison | Marketing analytics | Product analytics |
| Main question | Which marketing activities attract and convert the right audience? | How do users experience and get value from the product? |
| Primary focus | Channels, campaigns, traffic, leads, conversions, and revenue contribution | Activation, feature usage, engagement, user journeys, and retention |
| Typical data | Ad platforms, campaign links, website sessions, forms, CRM, and sales outcomes | Product events, user and account properties, sessions, funnels, and cohorts |
| Common metrics | CTR, CPC, conversion rate, CAC, CPL, ROAS, pipeline, and attributed revenue | Activation rate, DAU/WAU/MAU, feature adoption, retention, churn, and time to value |
| Main users | Marketing, demand generation, growth, and revenue teams | Product, product growth, UX, engineering, and customer success teams |
| Typical decisions | Where to invest, which messages to improve, and which channels generate valuable demand | What to improve, where users struggle, and which behaviors signal product value |
| Lifecycle emphasis | Often strongest before and around acquisition, but can include revenue and retention campaigns | Often strongest after signup or product access, but can include the full digital experience |
What is marketing analytics?
Marketing analytics is the process of collecting and interpreting data from marketing channels, campaigns, and customer interactions to understand performance and improve decisions. It helps teams evaluate how effectively they reach an audience, generate demand, convert prospects, and contribute to revenue.
It can cover paid search, paid social, organic search, email, referrals, content, events, partner campaigns, and other acquisition activities. Website analytics often forms part of this picture because it shows what visitors do after clicking an ad, search result, or campaign link.
Questions marketing analytics helps answer
- Which channels and campaigns attract qualified visitors or leads?
- Which landing pages and messages generate meaningful conversions?
- How much does it cost to acquire a lead or customer?
- Which campaigns contribute to pipeline, purchases, or revenue?
- Where should the team shift budget, improve creative, or change targeting?
Common marketing analytics metrics
| Metric | What it helps measure |
| Impressions and reach | How often content or ads are shown and how many people they reach. |
| Clicks, CTR, CPC | How audiences respond to campaigns and what traffic costs. |
| Sessions and traffic sources | Where website visits originate and how visitors arrive. |
| Conversion rate | The share of visitors or leads completing a defined action. |
| CPL and CAC | The cost of generating a lead or acquiring a customer, using a clearly defined cost scope. |
| ROAS and ROI | The return associated with advertising spend or a broader marketing investment. |
| Pipeline and attributed revenue | How marketing touchpoints relate to qualified opportunities, purchases, or revenue. |
No single metric explains campaign performance on its own. A channel may generate inexpensive clicks but few qualified leads. Another may bring fewer visitors who are more likely to become customers. Teams should compare cost and volume with downstream conversion quality.
For ecommerce teams, product-page messaging can also be tested against meaningful actions such as add-to-cart and purchase completion. A product description generator can help create copy variations to test, while analytics shows whether those variations improve the outcomes that matter.
What is product analytics?
Product analytics is the practice of collecting and analyzing behavioral data to understand how people use a digital product. It looks beyond visits and page views to examine the actions users take, the paths they follow, the features they adopt, and whether they return.
For a SaaS company, those actions might include creating a workspace, completing onboarding, connecting an integration, building a report, inviting a teammate, or using a key feature repeatedly. For an ecommerce app, they might include searching a catalog, saving an item, adding it to a cart, or completing checkout.
The goal is not simply to count activity. Product teams use behavioral evidence to find friction, understand which experiences deliver value, prioritize improvements, and measure whether product changes improve outcomes. A dedicated product analytics software solution can help teams analyze these behaviors through events, funnels, cohorts, and engagement reports.
Common product analytics metrics
| Metric | What it helps measure |
| Activation rate | The share of new users who complete a meaningful first-value action. |
| DAU, WAU, and MAU | The number of unique active users in daily, weekly, or monthly periods. |
| Feature adoption | How many eligible users start using a feature and how usage develops over time. |
| Engagement frequency | How often users return and perform meaningful actions. |
| Onboarding completion | How many users complete the steps needed to start using the product. |
| Retention rate | The share of a defined user or account cohort that returns after a given period. |
| Churn rate | The share of customers or users who stop using or paying for the product, according to the chosen definition. |
| Time to value | How long it takes a new user to reach a meaningful outcome. |
Metric definitions matter. An active user should be defined by meaningful product behavior, not automatically by a login. Activation should be tied to an action that signals value for the product. Retention should also specify whether the unit is an individual user, a company account, or a paying customer.
Teams that need a deeper framework for adoption can explore feature adoption metrics and use those definitions to decide which behaviors deserve ongoing measurement.
The key differences between product and marketing analytics
Product and marketing analytics use different evidence to answer different questions. The following differences show how each discipline supports decisions across the customer journey.
1. They start with different business questions
Marketing analytics starts with the audience and the route to conversion. It asks which messages, channels, and campaigns create demand and which interactions contribute to a business result. Product analytics starts with the experience. It asks whether users can complete important tasks, discover useful features, and continue receiving value.
2. They rely on different, but connected, data
Marketing analysis often uses campaign parameters, ad-platform data, landing-page visits, form submissions, CRM records, and sales outcomes. Product analysis relies more heavily on event data, user or account properties, feature interactions, onboarding steps, and repeat activity.
The boundary is not absolute. A signup is both a marketing conversion and the start of a product relationship. A purchase can be a marketing outcome and a product or commerce event. The distinction comes from the question being asked, not from assigning every event to only one team.
3. They guide different decisions
Marketing teams may use their findings to reallocate budget, refine targeting, test landing pages, or change campaign messaging. Product teams may use theirs to simplify onboarding, improve feature discovery, fix confusing workflows, or prioritize roadmap changes.
4. Their time horizons can differ
Campaign reporting may focus on a short promotion or a monthly acquisition period. Product analysis often follows cohorts over weeks or months to understand whether early engagement becomes sustained usage. Neither discipline is limited to one timeframe: marketing can measure long sales cycles and customer value, while product teams can investigate immediate behavior after a release.
How product and marketing analytics work together
The strongest connection is the ability to follow a customer from the first campaign interaction through product use and the eventual business outcome. Consider a B2B SaaS journey:
- A prospect clicks a LinkedIn campaign and visits a landing page.
- The prospect returns through organic search and signs up for a trial.
- The new user completes onboarding and connects an integration.
- The user creates a first report, invites a colleague, and returns to use the product again.
- The account becomes a paying customer and later expands its usage.
Marketing analytics can show which campaign and channel contributed to the visit, signup, and later conversion. Product analytics can show whether the user completed onboarding, reached a key action, adopted important features, and continued using the product.
When the two views are connected, teams can compare product outcomes across acquisition sources. They can investigate whether a campaign attracts users who activate, whether certain messages bring customers who adopt a particular feature, and whether the channels associated with stronger retention also contribute to revenue.
This does not mean attribution proves that a campaign caused retention or revenue. It shows how observed journeys and outcomes are associated. Controlled experiments and other causal methods are still needed when a team wants to estimate incremental impact.
A connected view of the customer lifecycle is the purpose of customer journey analytics. It helps teams investigate the sequence of interactions instead of treating every channel, page, or product action as an isolated report.
When should you use each type of analytics?
| Your immediate question | Start with | Why |
| Which campaigns bring visitors, leads, or customers? | Marketing analytics | It connects traffic and conversions with channels, campaign activity, and cost. |
| Where do new users abandon onboarding? | Product analytics | It shows progression through product steps and identifies where users stop. |
| Which features are used and retained? | Product analytics | It measures feature behavior and repeated use across user groups. |
| Which acquisition sources bring users who become active customers? | Both | You need acquisition context and downstream product behavior. |
| Which campaigns contribute to pipeline or revenue? | Marketing analytics, connected to CRM or sales data | The analysis needs campaign touchpoints and reliable business outcomes. |
| Why are trial users not converting to paid plans? | Both | Marketing can compare acquisition quality while product analytics investigates activation and product friction. |
If the problem is about attracting the right audience or allocating marketing investment, begin with marketing analytics. If it is about product experience, feature usage, or retention, begin with product analytics. If the question crosses those boundaries, bring the datasets together rather than forcing one discipline to answer everything.
Can one platform support both?
Some businesses use separate tools for campaign reporting, website analytics, product analytics, CRM, and revenue reporting. That can work, especially when each system serves a specialist need. The challenge is making sure the tools share consistent definitions and can connect the same person or account across the journey.
A unified platform can reduce the effort involved in comparing reports across systems, but a single interface does not automatically guarantee complete or accurate data. Before choosing a tool, check whether it can:
- Capture campaign and acquisition context, including source, medium, and campaign parameters.
- Track meaningful website and product events with the properties needed for analysis.
- Connect anonymous visits with known users or accounts when a reliable identity signal becomes available.
- Build funnels, journeys, segments, and retention cohorts from the same event foundation.
- Import relevant CRM, payment, or offline conversion events when the business outcome happens outside the website or product.
- Support shared dashboards, access controls, data governance, and clear metric definitions.
If you keep separate platforms, document the source of truth for each metric and define how records are matched. Avoid comparing a marketing platform’s attributed conversions with a product platform’s active users as if they were interchangeable measures.
How Usermaven connects marketing and product analytics
Usermaven is primarily a marketing attribution platform, with website and product analytics capabilities that help teams examine what happens after acquisition. This combination is useful when a business wants to connect campaign performance with the behavior and outcomes of the people those campaigns bring in.
On the marketing side, Usermaven helps teams analyze acquisition sources, campaign performance, and attribution across customer touchpoints. On the product side, its analytics capabilities include engagement metrics, onboarding funnels, feature adoption, power-user analysis, churn insights, and retention cohorts.
Teams can use funnels to investigate where users stop progressing, segments to compare groups, and user journeys to examine the paths people take. These views help connect the question of where users came from with what they did after arriving.
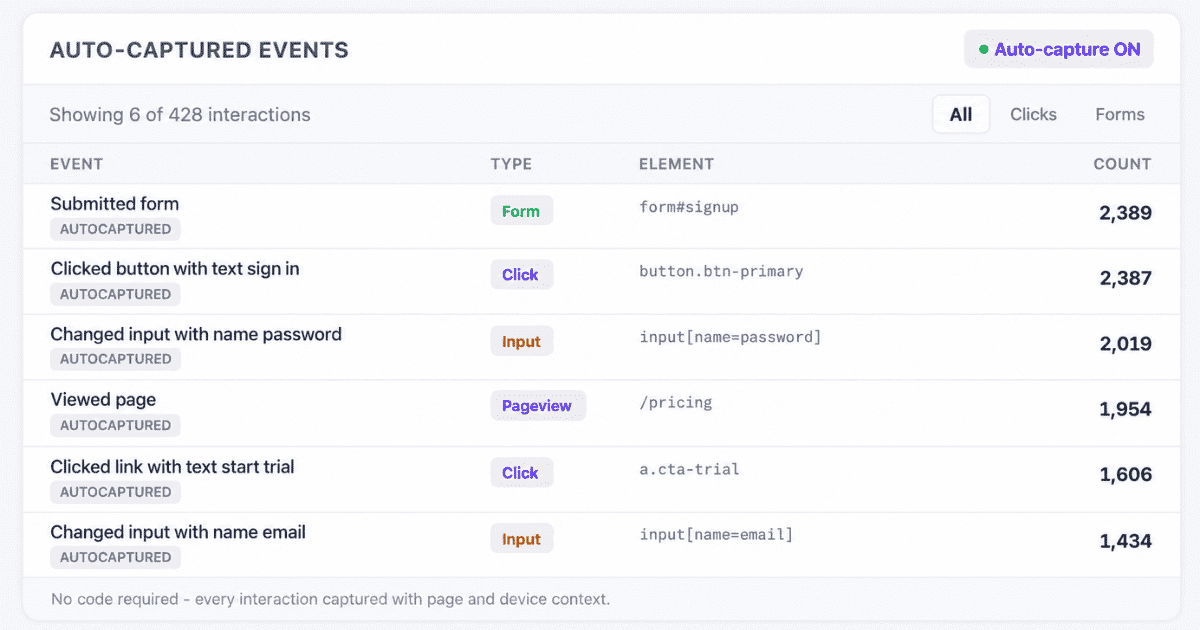
Usermaven’s Event Sources also allow businesses to bring events from payment providers, CRMs, spreadsheets, and other systems into the analytics workspace. This can help connect off-site outcomes, such as payments or sales events, with website and product interactions. Imported events can then be used across reports including Funnels, Journeys, Trends, and Attribution.
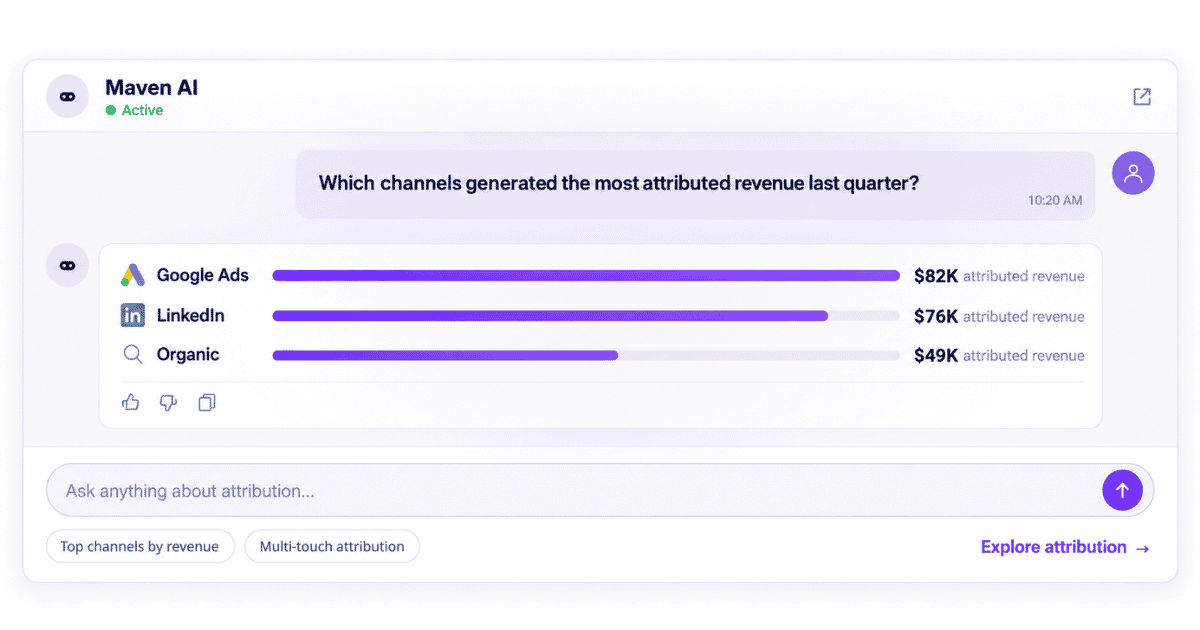
Maven AI adds another layer to the workflow. Teams can ask questions about their analytics, explore generated reports, and use Maven AI Agents to run recurring analyses and surface insights proactively. AI-generated charts and reports can also be saved to dashboards, helping teams share a consistent view of performance.
For teams evaluating a combined setup, the important question is not whether every metric lives in one dashboard. It is whether acquisition context, product behavior, and business outcomes can be analyzed together with reliable definitions. Explore Usermaven’s Maven AI analytics alongside its marketing attribution workflows to see how those views can support a connected measurement process.
Common mistakes to avoid
Optimizing for signups alone: A signup is an important conversion, but it does not prove that a user reached value. Track the next meaningful product action.
Treating clicks as business outcomes: High click volume can hide poor lead quality, low activation, or weak revenue contribution.
Using inconsistent definitions: Agree on what counts as an active user, qualified lead, activated account, retained customer, and conversion before comparing reports.
Ignoring identity and data quality: Missing campaign parameters, duplicate events, or disconnected user and account records can make the combined journey incomplete.
Confusing correlation with causation: A channel associated with high retention is worth investigating, but the relationship alone does not prove the channel caused that retention.
Reporting without an action: Every important finding should lead to a decision, an owner, or a test. Otherwise, teams collect dashboards without improving the customer experience.
Conclusion
Product analytics and marketing analytics serve different purposes. Marketing analytics helps teams understand how campaigns and channels attract and convert an audience. Product analytics reveals whether people can use the product successfully, adopt valuable features, and continue engaging over time.
The distinction matters, but the connection matters more. When teams link acquisition sources with activation, feature adoption, retention, and revenue, they can make decisions based on customer quality and long-term outcomes instead of isolated campaign or usage metrics.
Usermaven brings marketing attribution, website analytics, and product analytics into a connected measurement workflow. Book a demo to explore how your team can connect acquisition activity with what users do next.
Frequently asked questions
1. What is the difference between product analytics and marketing analytics?
Marketing analytics measures how campaigns, channels, and marketing activities attract and convert audiences. Product analytics examines how users interact with a digital product, including activation, feature usage, engagement, and retention. They overlap around conversions and revenue, but answer different questions.
2. Can product and marketing analytics work together?
Yes. Connecting acquisition data with product events lets teams compare how users from different channels behave after signup. They can investigate activation, feature adoption, retention, and revenue alongside campaign performance.
3. What metrics are used in product analytics?
Common product analytics metrics include activation rate, daily, weekly, and monthly active users, onboarding completion, feature adoption, engagement frequency, retention, churn, and time to value. The right metrics depend on the product’s value moment and business model.
4. What metrics are used in marketing analytics?
Marketing analytics commonly uses impressions, clicks, click-through rate, cost per click, sessions, conversion rate, cost per lead, customer acquisition cost, return on ad spend, pipeline, and attributed revenue. Teams should interpret these metrics together rather than relying on one measure.
5. Can one platform handle both product and marketing analytics?
Some platforms combine marketing attribution with website and product analytics. Before choosing one, check whether it captures campaign context and product events, connects users or accounts reliably, supports funnels and retention analysis, and can incorporate relevant CRM or payment outcomes.
6. Why should marketing teams care about product analytics?
Product analytics helps marketing teams understand what happens after acquisition. It can reveal whether campaigns bring users who complete onboarding, adopt important features, and remain active. This helps teams evaluate acquisition quality, not just traffic or signup volume.

Written by
Adeel Khan
Growth Marketing Expert
Adeel Khan is a full-stack SaaS marketer with 10+ years of experience in content marketing, paid advertising, analytics, and conversion rate optimization. He shares practical insights and strategies drawn from hands-on experience, helping B2B SaaS marketers improve performance and make better marketing decisions.
All articles by Adeel →