Launching a product is exciting. But the real question begins after the launch goes live.
Did people actually adopt the product? Are they using it? Is the launch generating revenue or long-term growth?
Without tracking the right product launch metrics, it becomes almost impossible to answer those questions. Teams might see traffic spikes or social media buzz, but those numbers rarely tell the full story.
This is where clearly defined product launch success metrics become essential. By measuring the right KPIs before, during, and after launch, teams can understand how well the product is performing and whether it is meeting its goals.
Let’s take a closer look at the key product release metrics that help teams evaluate and improve launch performance.
What are product launch metrics, and why are they important?
Product launch metrics are key performance indicators (KPIs) used to measure how well a new product performs after it launches.
These metrics help teams track important outcomes such as user interest, product adoption, engagement, and revenue. Instead of relying on assumptions, companies use product launch analytics to analyze these metrics and understand whether their launch strategy is actually working.
Tracking the right metrics helps teams answer important questions like:
- Is there real demand for the product?
- Are marketing campaigns attracting the right audience?
- Are users adopting the product after signing up?
- Is the product generating sustainable revenue?
Product launch KPIs also help teams stay aligned around clear goals. Marketing teams can track acquisition and traffic, product teams monitor activation and engagement, and leadership focuses on revenue and growth.
Most importantly, these metrics help teams learn from every launch. For example, high traffic but low signups may indicate messaging problems, while strong signups but low retention could suggest that users are not finding long-term value in the product.
By tracking the right metrics for a successful product launch, companies can better understand performance, improve future launches, and make smarter product decisions.
Pre-launch product launch metrics
Pre-launch metrics help teams understand market interest and launch readiness before the product is publicly available.
These metrics indicate whether your marketing campaigns are building awareness and whether potential customers are excited about the upcoming product.
Tracking these metrics for new product launch success allows teams to validate demand and refine positioning before launch day.
1. Market demand validation
Before launching any product, the most important question is whether there is real demand for the solution.
Market demand validation measures how strongly the target audience needs the product you’re building.
Companies evaluate demand through multiple signals:
- Keyword search trends
- Market research reports
- Competitor analysis
- Customer interviews
- Problem validation surveys
If potential customers consistently report the same problem your product solves, demand is likely strong.
Demand validation is a critical product launch success metric because launching a product without real demand dramatically increases the risk of failure.
2. Waitlist signups
Waitlist signups measure how many users register to receive early access to the product before launch.
Many companies create pre-launch landing pages where visitors can join a waiting list in exchange for updates, early access, or special incentives.
Tracking waitlist signups helps teams estimate potential adoption levels. A large waitlist often indicates strong interest and demand before launch.
It also gives companies an initial audience that can provide early feedback and help refine the product.
3. Website traffic and awareness
Website traffic measures how many users are discovering your product pages during the pre-launch phase.
This metric helps teams evaluate the effectiveness of the product marketing campaigns and awareness strategies.
Traffic can come from several channels:
Organic traffic is particularly important when measuring SEO KPIs for product launch metrics, as it reflects how well your content and product pages rank in search engines.
Increasing traffic typically signals growing interest in the upcoming launch.
Power up your SaaS
with perfect product analytics
4. Landing page conversion rate
Before launching a product, many teams create a pre-launch landing page to capture interest from potential users.
Landing page conversion rate measures the percentage of visitors who take a specific action on this page. These actions usually indicate early demand for the product.
Common pre-launch conversions include:
- Joining the waitlist
- Signing up for early access
- Requesting a demo
- Subscribing to launch updates
A high conversion rate suggests that your messaging and value proposition resonate with your target audience.
If traffic is high but conversions remain low, it may indicate that the product positioning or messaging needs improvement. Optimizing this metric before launch helps teams ensure their pre-launch marketing strategy is effective.
Before a product launch, companies often promote the upcoming release through teaser campaigns, announcements, and product previews on social media.
Social media engagement measures how audiences interact with this launch-related content.
Common engagement signals include:
- Likes
- Comments
- Shares
- Mentions
- Follower growth
Strong engagement indicates growing awareness and interest in the upcoming product. It can also help teams identify which content resonates most with their audience.
Monitoring engagement during the pre-launch phase allows teams to refine their messaging and build momentum leading up to launch day.
Planning a new launch? Our guide on product launch stages explains the complete lifecycle and where these metrics fit in.
Launch phase product launch metrics
Once the product goes live, teams focus on user acquisition and adoption metrics.
These indicators show how effectively your launch converts interest into active users.
Monitoring these product marketing KPIs helps teams evaluate the immediate impact of the launch.
6. Product signups
Product signups represent the number of users who create accounts or register for the product after launch.
This is one of the first metrics teams monitor when evaluating new product launch metrics.
Signups reflect the success of launch campaigns, announcements, and marketing strategies.
However, signups alone do not guarantee long-term success. They must be analyzed alongside activation and engagement metrics.
7. Activation rate
Activation rate measures the percentage of users who reach their first meaningful success milestone inside the product.
Examples of activation events include:
- Completing onboarding
- Creating their first project
- Using a core feature
- Uploading their first dataset
Activation is crucial because it indicates whether users actually experience the product’s value.
If activation rates are low, onboarding improvements may be required.
8. Time to first value
Time to First Value or TTFV measures how quickly a new user reaches the product’s first meaningful outcome, often known as the “aha moment.”
It reflects the time it takes for users to see immediate value after signing up or getting started.
A shorter TTFV usually leads to higher engagement and improved retention, as users quickly understand why the product matters.
If it takes too long to reach this point, users may drop off before experiencing any real benefit.
9. Customer acquisition cost (CAC)
Customer acquisition cost measures how much it costs to convert a user into a paying customer.
The formula is:
Customer acquisition cost = total marketing and sales spend ÷ number of customers acquired
CAC helps businesses evaluate the efficiency of their marketing campaigns.
If acquisition costs are too high relative to revenue, the launch strategy may need adjustments.
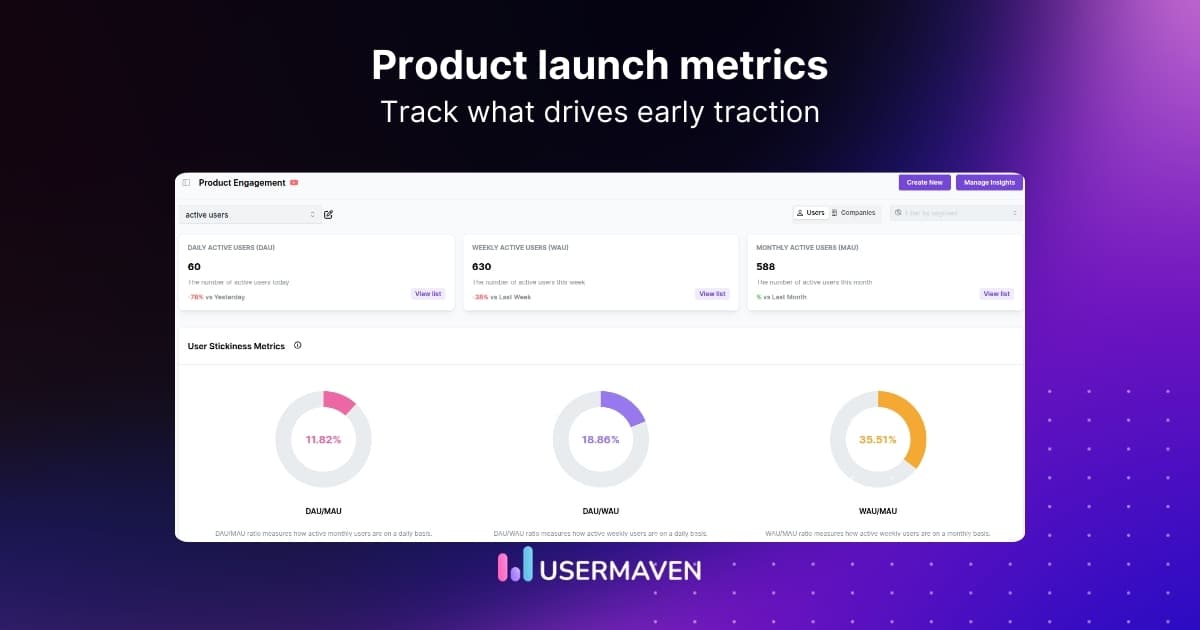
10. User engagement
User engagement measures how actively users interact with the product after signing up.
Common engagement indicators include:
- Daily active users (DAU)
- Weekly active users (WAU)
- Session frequency
- Feature usage
High engagement signals that users find the product valuable and continue returning to it.
Post-launch product launch metrics
Once the initial excitement fades, the focus shifts to long-term product performance.
Post-launch metrics help teams determine whether the product continues to deliver value to users.
These metrics also support post launch analysis, allowing teams to evaluate adoption, retention, and overall product impact after the launch period.
11. Customer retention rate
Customer retention rate measures how many users continue using the product over time.
High retention indicates that users consistently find value in the product. If users keep returning after their first experience, it suggests the product is meeting their needs and solving the problem it was designed for.
Teams often perform retention analysis to understand how user engagement changes over time and identify where users may drop off. This helps product teams improve onboarding, optimize features, and strengthen long-term adoption.
Because it reflects sustained product value, retention is often considered one of the most reliable metrics for successful product launch outcomes.
12. Churn rate
Churn rate measures how many users stop using the product during a specific period.
A high churn rate may indicate issues such as:
- Poor onboarding
- Missing features
- Weak product-market fit
Reducing churn is essential for maintaining sustainable growth.
13. Revenue growth
Revenue growth measures the financial performance of the product after launch.
Businesses may track metrics such as:
- Monthly recurring revenue (MRR)
- Total product sales
- Average revenue per user
Revenue remains one of the most critical new product launch KPIs for evaluating overall success.
Net promoter score (NPS) measures how likely customers are to recommend your product to others.
Users rate their likelihood of recommending the product on a scale from 0 to 10. Based on their responses, users are grouped into three categories:
- Promoters (9–10): Loyal users who are likely to recommend the product
- Passives (7–8): Satisfied users but less likely to actively promote it
- Detractors (0–6): Users who may be dissatisfied with the product
The NPS formula is:
NPS = % of promoters − % of detractors
A high NPS score indicates strong customer satisfaction and loyalty, while a lower score may highlight areas where the product experience needs improvement.
15. Viral coefficient and referrals
The viral coefficient measures how quickly existing users bring new users to the product.
Referral-driven growth often happens through:
- Referral programs
- Product sharing features
- Word-of-mouth marketing
This metric indicates how effectively the product spreads organically.
Power up your SaaS
with perfect product analytics
How to measure product launch success
Measuring product launch success starts with defining what success actually looks like for your team. Instead of tracking random data points, teams should focus on clear goals and meaningful product launch KPIs that align with business outcomes.
1. Define launch goals
Start by identifying what you want the launch to achieve.
Common launch goals include:
- Generating early product adoption
- Validating product-market fit
- Driving revenue or sales
- Increasing brand awareness
Clear goals make it easier to determine which product launch success metrics you should track.
2. Align metrics with business objectives
The metrics you track should directly reflect your launch objectives.
For example:
- Adoption-focused launches: Track signups, activation rate, engagement
- Revenue-focused launches: Track conversion rate, revenue growth, CAC
- Awareness-focused launches: Track traffic, social engagement, impressions
Aligning metrics with objectives ensures your product launch analytics provide meaningful insights.
3. Set benchmarks
Benchmarks help you evaluate whether performance is strong or needs improvement.
Benchmarks can come from:
- Previous product launches
- Industry benchmarks
- Competitor performance
With benchmarks in place, teams can interpret launch data more accurately and identify areas for optimization.
Tracking product launch metrics across multiple channels can quickly become complex. Product launch analytics tools help teams collect, visualize, and analyze launch data more efficiently.
Below are common categories of tools used during product launches.
Product analytics tools help teams understand how users interact with the product after signing up.
They typically track:
These tools provide valuable insights into user behavior and product adoption. Platforms like Usermaven help teams monitor product usage, track key launch metrics, and understand how users engage with the product after launch.
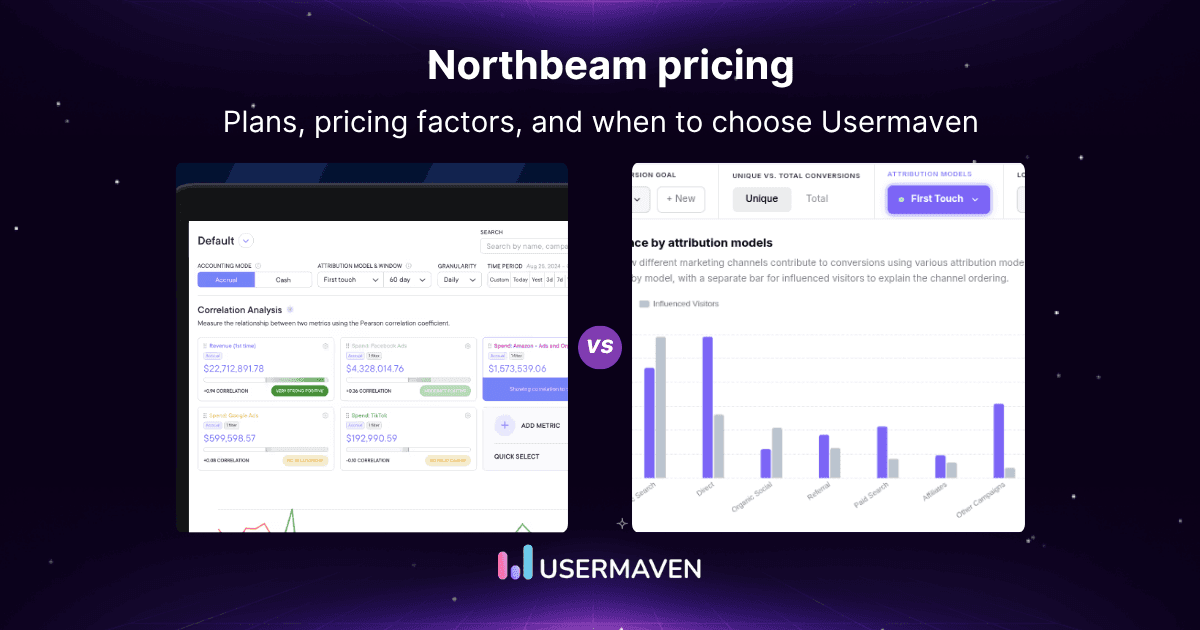
As marketing attribution software, Usermaven helps teams connect acquisition, campaign performance, conversion rates, CAC, and launch outcomes in one place.
These tools help teams measure:
- Traffic sources
- Conversion rates
- Campaign ROI
- Customer acquisition cost (CAC)
This data helps teams understand which marketing channels drive the most users.
Behavioral analytics tools reveal how users interact with the product interface.
They often include:
- Heatmaps
- Session recordings
- User flow analysis
These insights help identify friction points that may affect product adoption.
Customer feedback platforms capture qualitative insights from users.
Common feedback sources include:
- Surveys
- In-app feedback prompts
- Customer interviews
- Product reviews
Combining behavioral data with feedback gives teams a more complete picture of product launch performance.
How to choose the right product launch metrics
Not every product launch requires the same metrics. Some product launch metrics provide meaningful insights, while others may simply be vanity metrics that don’t reflect real performance. The right metrics depend on your product type, launch objectives, and stage of growth.
Consider your business model
Different industries prioritize different metrics.
For example:
- SaaS products: Activation rate, engagement, retention, recurring revenue
- Ecommerce products: Sales volume, conversion rate, average order value
- Marketplaces: User growth, transactions, network effects
Choosing metrics that align with your business model ensures more meaningful insights.
Consider the product stage
Metrics should also reflect the stage of the product lifecycle.
- Early-stage launches: Demand validation, waitlist signups, adoption
- Growth-stage launches: Engagement, retention, product usage
- Mature products: Revenue growth, customer lifetime value
As products evolve, the metrics used to measure success should evolve as well.
Use SMART launch goals
Many teams use the SMART framework when defining launch objectives.
SMART goals are:
- Specific
- Measurable
- Achievable
- Relevant
- Time-bound
When metrics are aligned with SMART goals, teams can track progress more effectively and evaluate whether their launch achieved its intended outcomes.
Final thoughts!
Launching a product successfully requires more than a strong marketing campaign. Teams need to track the right product launch metrics to understand how users discover, adopt, and continue using the product. These product launch success metrics help teams measure real impact across the pre-launch, launch, and post-launch stages.
Whether you’re analyzing retail product launch metrics or SaaS adoption, these metrics provide a clear framework for evaluating launch performance and improving future launches.
Tracking and understanding these metrics is much easier with the right analytics platform. Usermaven helps teams monitor user behavior, analyze product performance, and understand what drives adoption after launch.
Sign up for free or book a demo with Usermaven to start tracking the metrics that matter.
FAQs
How long should you track product launch metrics after launch?
Product launch metrics should be monitored beyond the initial launch period. Many teams track performance for at least 30 to 90 days after launch to understand adoption trends, engagement patterns, and early retention.
What is the difference between product launch metrics and product analytics metrics?
Product launch metrics focus specifically on evaluating launch performance, such as signups, activation, and early adoption. Product analytics metrics, on the other hand, track ongoing product usage and behavior over time.
Which product launch metrics matter most for SaaS products?
For SaaS companies, the most important metrics often include activation rate, customer acquisition cost (CAC), retention rate, churn rate, and recurring revenue. These indicators reflect long-term user adoption and growth.
What are the most important retail product launch metrics?
Retail product launches often focus on sales velocity, conversion rate, average order value, and inventory turnover. These metrics help brands measure demand and revenue performance after launch.
How do startups track product launch success with limited data?
Startups typically focus on a small set of core metrics such as signups, activation rate, user engagement, and early customer feedback. These indicators help validate product-market fit before scaling.
Can product launch metrics help improve future launches?
Yes. Analyzing past launch metrics helps teams identify what worked well and what didn’t. These insights allow companies to refine marketing strategies, improve onboarding, and optimize future launches.