Product analytics tools help teams understand how people move through a product, where they reach value, and which experiences need improvement. But the best tool for funnel analysis is not automatically the best choice for mobile session replay, in-app onboarding, or connecting product engagement with revenue.
This guide compares 13 product analytics platforms by primary use case, core features, current pricing approach, and meaningful tradeoffs. It also explains what to test before buying, so you can choose a platform around your team’s questions rather than the length of a feature list. For teams that need to connect acquisition with product behavior, marketing attribution software can provide an additional layer of context.

Key takeaways
- Best for connected attribution: Usermaven combines product engagement, funnels, and retention with acquisition and marketing attribution data.
- Best for event-based analysis: Mixpanel and Amplitude are strong choices for teams studying funnels, cohorts, user behavior, and product outcomes.
- Best for developer-led teams: PostHog combines analytics with replay, feature flags, and experimentation in a usage-based platform.
- Best for adoption and UX: Pendo and Userpilot focus on guiding users, while Fullstory, LogRocket, UXCam, and Quantum Metric emphasize experience evidence in different ways.
- Best for specific technical needs: Heap emphasizes autocapture, Statsig emphasizes experiments, and Countly offers private-cloud or self-hosted deployment.
- Most useful buying rule: Compare the questions a tool can answer, implementation effort, privacy controls, and costs at your expected volume, not just the entry price.
What are product analytics tools?
Product analytics tools collect and organize data about how people interact with digital products. They help teams study onboarding, feature adoption, conversion funnels, retention, account engagement, and the paths users take before important outcomes.
A report showing that 45% of trial users abandon a setup step may reveal a point worth investigating. It does not prove why they left. Session evidence, customer feedback, and controlled tests can help separate possible explanations from confirmed improvements.
Product analytics connects events, metrics, and methods to the decisions teams make about user behavior and product improvements.
Types of product analytics software
Behavioral and event analytics: Tools such as Mixpanel, Amplitude, and Heap specialize in funnels, paths, cohorts, retention, and comparisons between user segments. Their value depends on clean event definitions and reliable identity tracking.
Analytics and marketing attribution: Usermaven links product and website engagement with the marketing touchpoints and conversions that precede or follow it. This is useful when acquisition quality matters as much as in-app behavior.
Product adoption platforms: Pendo and Userpilot combine analytics with guides, onboarding experiences, surveys, or user engagement. They are relevant when teams want to act inside the product rather than only analyze it.
Experimentation and developer workflows: Statsig and PostHog bring product measurement closer to feature flags and experiments. This can reduce the distance between discovering friction, testing a change, and examining the outcome.
Digital experience intelligence: Fullstory, LogRocket, UXCam, and Quantum Metric add forms of replay, interaction diagnostics, or experience analysis. They are useful for investigating the session-level context behind aggregate reports, subject to appropriate privacy settings.
Deployment-focused analytics: Countly is a meaningful option where the hosting model, data location, and control of infrastructure are major requirements. It should be compared against both functional needs and operational responsibilities.
Best product analytics tools compared at a glance
The table is grouped by the problem each product is well suited to solve, not by an unsupported overall score. Public prices reflect vendor websites reviewed in November 2026; plan limits, contracts, and add-ons can change.
| Tool | Main strength | Best for | Pricing indication |
|---|---|---|---|
| Usermaven | Product analytics + attribution | SaaS growth and marketing teams | Business/Enterprise; custom quote |
| Mixpanel | Event and funnel analysis | Self-service product teams | Free, up to 1M events/month |
| Amplitude | Behavioral analysis and experimentation | Advanced product organizations | Free, up to 2M events/month |
| PostHog | Developer platform and experimentation | Engineering-led teams | Free, up to 1M analytics events/month |
| Heap | Autocapture and historical analysis | Teams with incomplete event plans | Free, up to 10K sessions/month |
| Pendo | Adoption analytics and guides | Product education and adoption | Free, up to 500 MAUs; paid quotes |
| Userpilot | In-app onboarding and adoption | SaaS activation teams | Starter from $299/month |
| Statsig | Experimentation with analytics | Product experiments at scale | Free, up to 2M events/month; Pro $150/month |
| Fullstory | Session and friction analysis | Digital experience teams | Free, up to 30K sessions/month |
| LogRocket | Replay plus technical diagnostics | Engineering and product teams | From $176/month on published annual terms |
| UXCam | Mobile experience analytics | Mobile app teams | Free, up to 3K sessions/month |
| Quantum Metric | Enterprise experience intelligence | Large digital experience teams | Custom quote |
| Countly | Deployment and data control | Privacy- and infrastructure-focused teams | Flex from $175/month; Enterprise quote |
Shortlisted product analytics tools
Start with these three candidates if you want a faster shortlist before comparing all 13 platforms.
| Candidate | Choose it for | Best fit |
|---|---|---|
| Usermaven | Product analytics connected with marketing and paid-ads attribution | SaaS growth, product, and marketing teams |
| Mixpanel | Self-service funnels, cohorts, and event analysis | Product teams centered on behavioral analytics |
| PostHog | Analytics, replay, experiments, and developer workflows | Engineering-led product organizations |
13 best product analytics tools for 2026
These profiles describe documented capabilities, pricing approaches, and practical limitations. They are not hands-on benchmark results or claims that we tested every platform against an identical dataset.
1. Usermaven
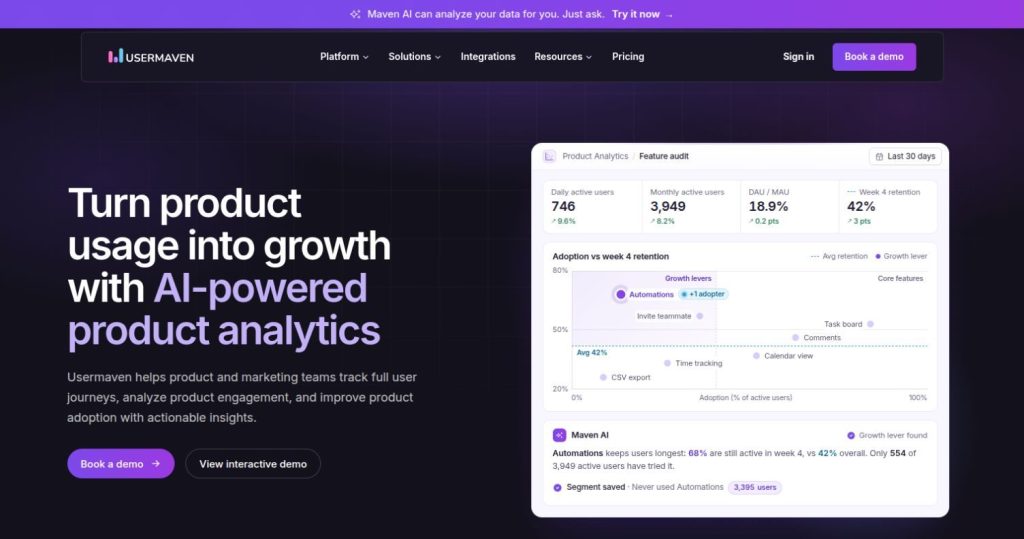
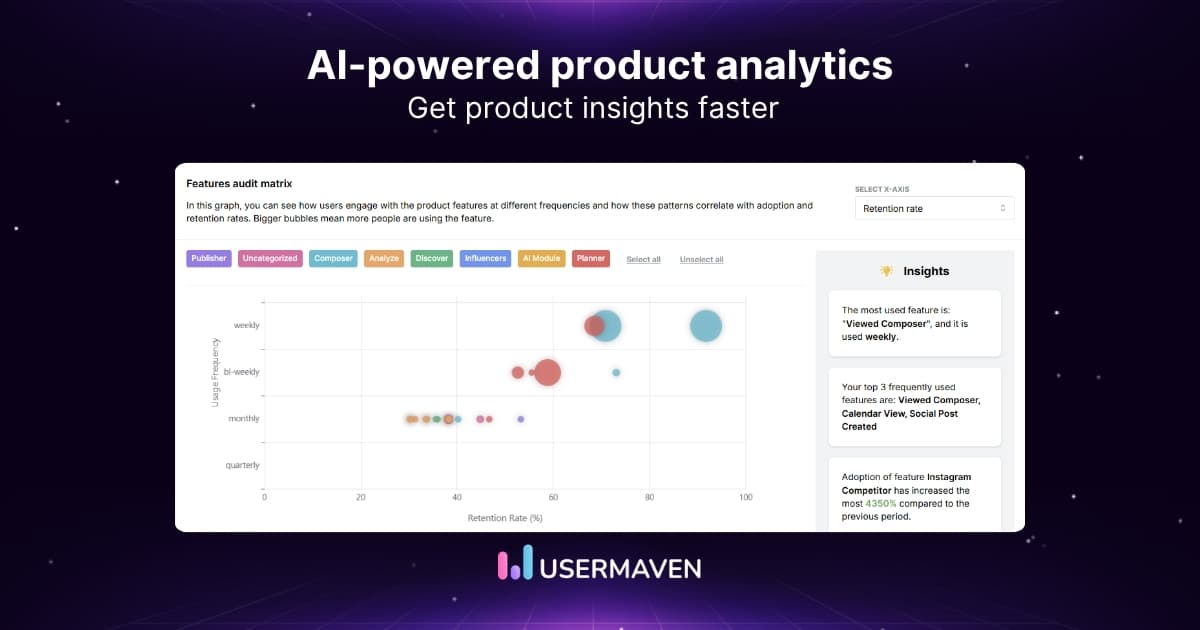
Usermaven is primarily a marketing attribution platform that also includes website and product analytics. It gives growth and product teams a connected view of acquisition, user behavior, funnels, retention, and conversion outcomes. Its advantage is strongest when teams want to understand which channels bring people who actually activate and continue using the product.
Key features:
- Engagement and adoption: Track active users, product actions, feature engagement, and important usage patterns.
- Funnels and retention: Compare onboarding completion, cohort return behavior, and journeys through key events.
- Attribution context: Analyze marketing sources, customer touchpoints, and conversion contributions alongside product activity.
- Maven AI: Ask questions about performance, use recurring Agents, and save eligible AI-generated charts or reports to dashboards.
Pricing: Business and Enterprise plans are priced by custom quote. Usermaven’s old $14 and $24 monthly plans should not be cited as current offers.
When it is best: B2B SaaS companies and marketing-led product teams that need acquisition-to-product insight, especially when CRM conversions or attributed revenue matter to decisions.
Important limitation: It does not replace a dedicated in-app guidance suite, full replay debugging system, or experimentation platform. Compare the actual questions your team needs answered using the product analytics software feature set.
2. Mixpanel
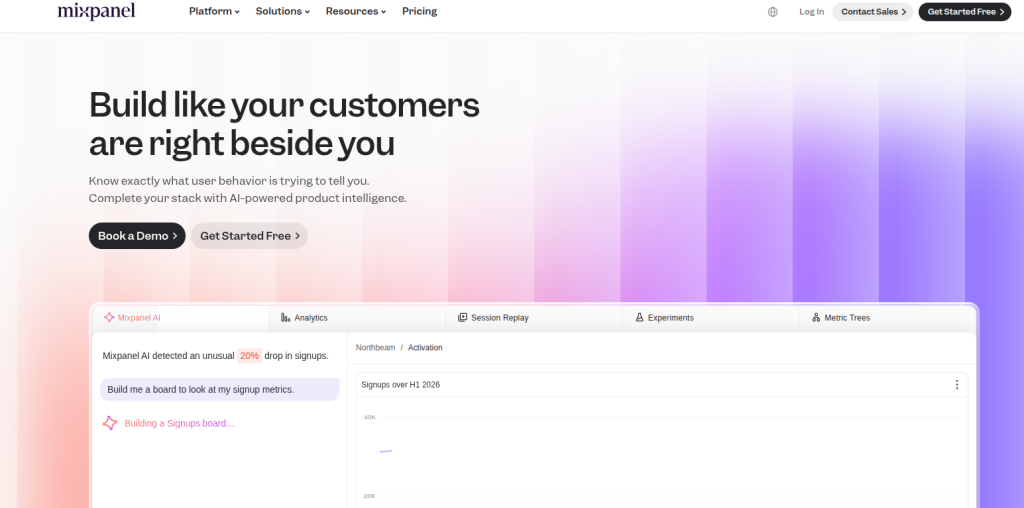
Mixpanel is an event-based analytics platform for studying what users do inside a website or application. Its funnels, flows, retention, and cohort reporting help teams identify behavior patterns and compare outcomes between groups. Its current platform also includes AI-assisted analysis, replay, feature flags, and experimentation capabilities.
Key features:
- Funnels and flows: Examine conversion steps and paths people follow before or after key events.
- Retention and cohorts: Compare returning behavior by signup date, user type, and product actions.
- AI and experiments: Explore findings and test product changes within its broader product intelligence offering.
Pricing: Free plan includes up to 1 million events per month, with usage-based Growth and custom Enterprise options. Session replay and experimentation have their own allowances.
When it is best: Product managers and analysts who want accessible event-based reporting for activation, conversion, and retention decisions.
Important limitation: Event definitions, identity merges, and rising usage volumes need governance. If acquisition-to-CRM revenue attribution drives the purchase, compare how Mixpanel alternatives connect behavioral reporting with marketing and revenue data.
Comparing Mixpanel and Usermaven helps teams assess product analytics alongside marketing attribution and customer journey reporting.
3. Amplitude
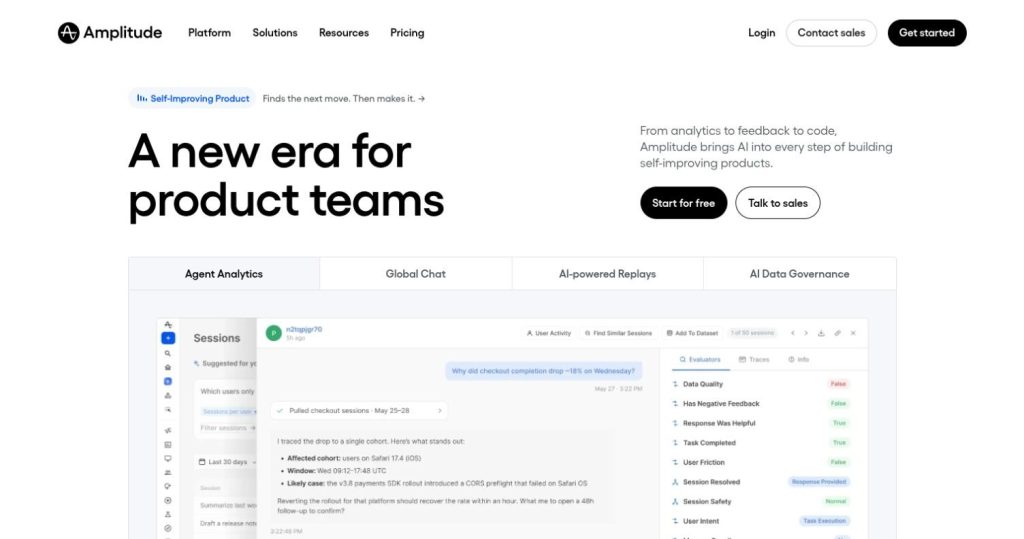
Amplitude offers a broad product analytics platform spanning behavioral analysis, session replay, experimentation, guides, and AI-assisted exploration. It is aimed at organizations that need to go beyond basic funnel reports and coordinate analysis across product, growth, and experimentation teams.
Key features:
- Behavioral analysis: Analyze paths, cohorts, retention, and user segments with a consistent event model.
- Experimentation: Connect product changes with defined outcome metrics and controlled testing.
- AI and governance: Support increasingly sophisticated questions while managing shared definitions and permissions.
Pricing: Free plan includes 2 million events per month; Plus scales with usage, while Growth and Enterprise are custom-priced. Some advanced cohort, governance, and data features depend on plan.
When it is best: Product organizations needing mature analytics workflows, cross-team governance, and experiments to validate improvement ideas.
Important limitation: Broad capabilities can increase setup and operating complexity. Confirm which features and event volumes are included rather than relying on a headline free allowance. Amplitude alternatives offer different balances of behavioral depth, attribution, and operating complexity.
Comparing Amplitude and Usermaven helps teams assess product analytics alongside marketing attribution and customer journey reporting.
4. PostHog
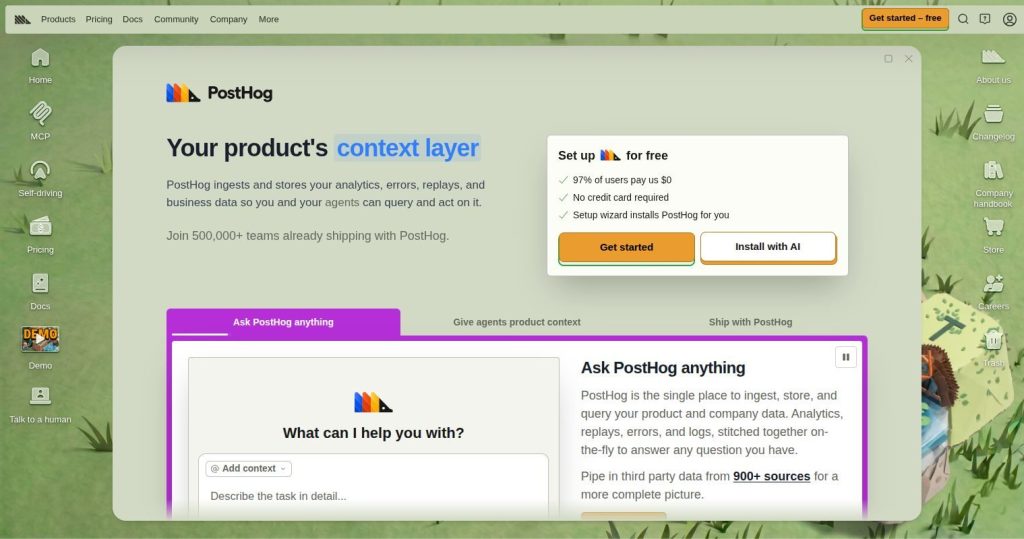
PostHog brings product analytics together with feature flags, session replay, experiments, surveys, and developer tooling. Its modular, usage-based model is attractive to teams that want to instrument and improve a product without purchasing a separate platform for every engineering workflow.
Key features:
- Product analytics: Event trends, funnels, paths, cohorts, and user or group analysis.
- Release workflows: Feature flags and experiments support controlled changes and outcome checks.
- Experience evidence: Session replay and error-related tools add diagnostic context when users encounter friction.
Pricing: First 1 million product analytics events per month are free; higher volumes are billed per event. Replay, flags, and other modules have separate allowances and usage charges.
When it is best: Startups and engineering-led product teams wanting analytics close to development, release management, and experimentation.
Important limitation: Several separately metered products can complicate a total-cost estimate. Model the monthly usage of each module before choosing. Other PostHog alternatives place different emphasis on attribution, product adoption, and deployment.
Comparing PostHog and Usermaven helps teams assess product analytics alongside marketing attribution and customer journey reporting.
5. Heap
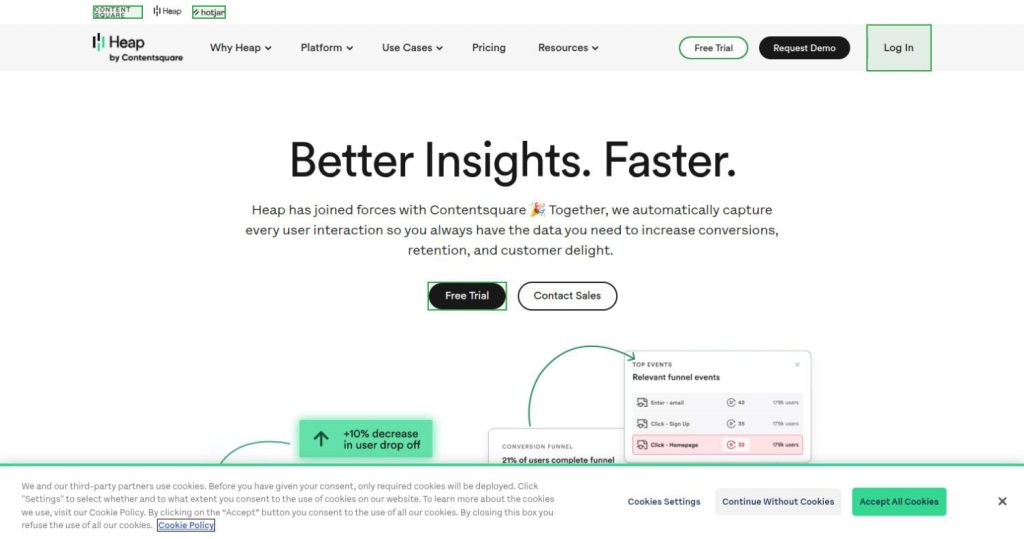
Heap, part of Contentsquare, is recognized for autocapture and the ability to analyze interactions that were not all explicitly named in advance. It is useful when teams have incomplete event instrumentation or want to explore previously collected interaction data. That does not remove the need for governance and clear business metrics.
Key features:
- Autocapture: Collect broad interaction data to reduce dependence on a fully predefined event list.
- Behavioral analysis: Explore funnels, journeys, and other patterns after data has been collected.
- Enterprise options: Higher tiers add advanced account analysis, integrations, and governance capabilities.
Pricing: Free plan offers up to 10,000 monthly sessions; higher tiers have session-based and custom terms. Check retention and feature availability at each level.
When it is best: Product teams that want exploratory analytics and retrospective analysis while they mature a structured event taxonomy.
Important limitation: Capturing more interactions does not automatically create trustworthy metrics. Maintain a naming plan and validate business events. A closer look at Heap product analytics helps teams evaluate how autocapture supports behavioral analysis.
Comparing Heap and Usermaven helps teams assess product analytics alongside marketing attribution and customer journey reporting.
6. Pendo
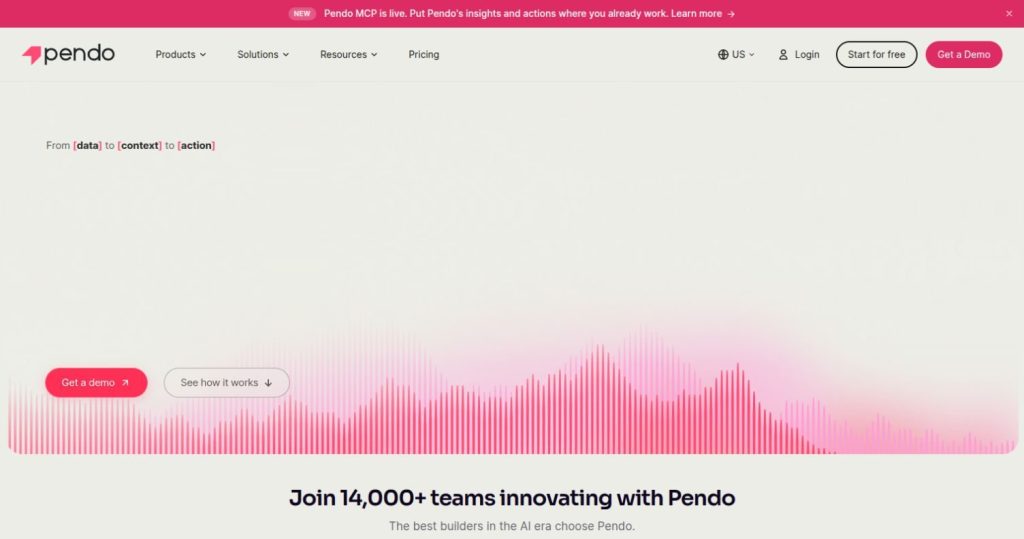
Pendo combines product analytics with in-app guides, feedback, and adoption programs. It appeals to teams that need to identify where users struggle and then guide them within the application. That makes it somewhat different from analytics-only platforms whose primary output is a report.
Key features:
- Adoption analytics: Understand engagement with important features and user journeys.
- In-app guidance: Deliver onboarding prompts and product education within the interface.
- Feedback and experience: Gather feedback and, on applicable plans, analyze session-level experience.
Pricing: Pendo Free supports up to 500 monthly active users; Base, Core, and Ultimate require quotes. Session replay and some advanced capabilities depend on package or add-on.
When it is best: SaaS product and customer education teams whose main goal is improved onboarding and feature adoption.
Important limitation: Monthly active user billing differs substantially from event-based pricing. Compare projected MAUs and feature packages, not the free label alone. A comparison of Heap vs. Pendo vs. Mixpanel highlights how their analytics and adoption workflows differ.
7. Userpilot
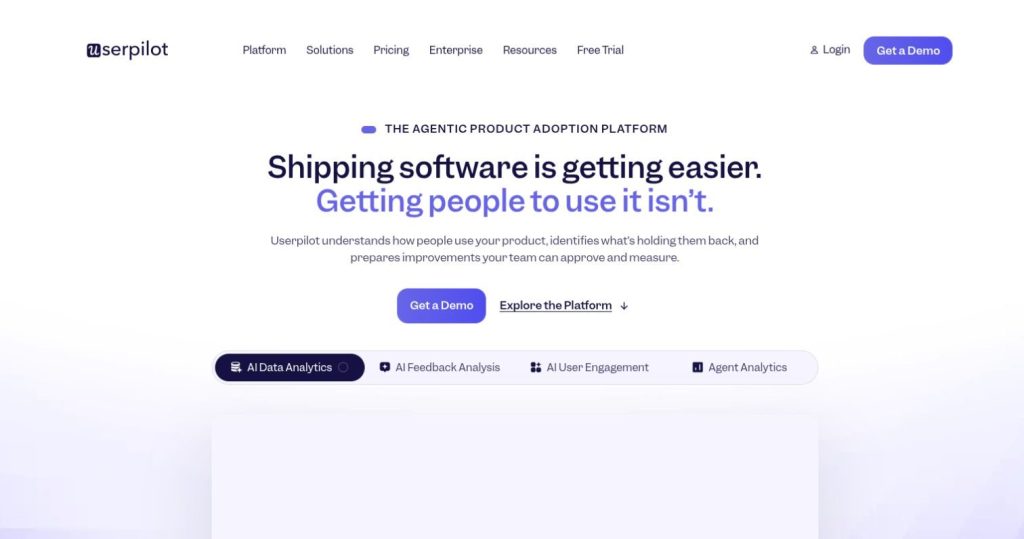
Userpilot is a product growth platform focused on improving onboarding, engagement, and adoption within SaaS applications. Its appeal is the ability to combine behavioral segments with contextual in-app experiences, so teams can respond to identified friction without treating analytics as an endpoint.
Key features:
- Onboarding flows: Create in-app guidance around activation and important product milestones.
- User segmentation: Build audiences using relevant usage attributes and events.
- Adoption reporting: Track engagement and survey signals around product education efforts.
Pricing: Starter is listed from $299 per month and includes up to 2,000 MAUs; Growth is listed from $849 per month. Confirm which advanced analytics and integrations are included.
When it is best: B2B SaaS teams that want to act on onboarding and feature-adoption findings through in-product experiences.
Important limitation: It should not be mistaken for a full marketing attribution platform. Evaluate its analytics depth and integration requirements alongside its strong adoption tools.
8. Statsig
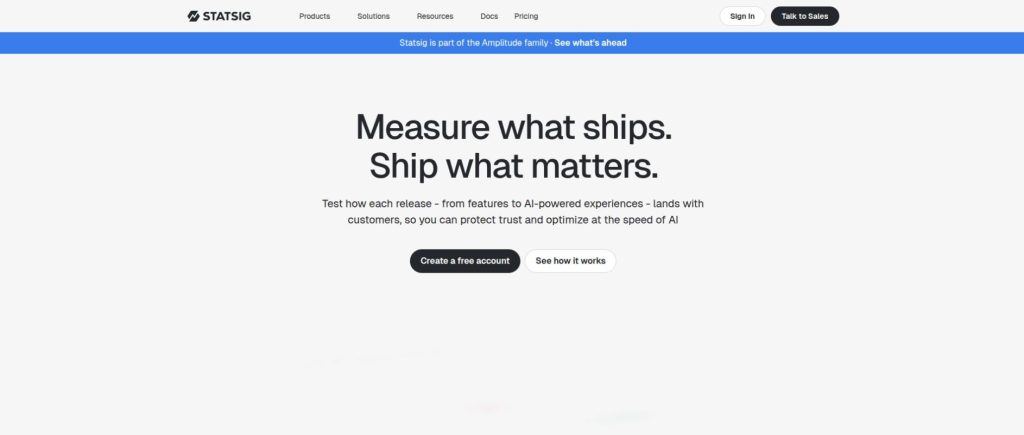
Statsig brings product analytics, experimentation, and feature management together. It is particularly useful when a company wants to evaluate whether a change causes better outcomes rather than stopping at correlations in a dashboard. Product teams can work with common metrics across analysis and release decisions.
Key features:
- Experiments and feature flags: Release changes selectively and compare defined outcomes.
- Product analytics: Analyze events, trends, and usage alongside experiment results.
- Developer integration: Support engineering workflows and product decisions in one environment.
Pricing: Developer tier includes 2 million metered events per month free; Pro lists $150 per month with higher limits and additional analytics and experiment capabilities.
When it is best: Product teams making frequent releases that need disciplined A/B testing and feature flag operations alongside analytics.
Important limitation: Experiments require careful assignment, sufficient data, and appropriate success metrics. A testing platform does not automatically make every experiment statistically meaningful.
9. Fullstory

Fullstory specializes in digital experience intelligence and replay-based investigation. Teams use session evidence to explore friction in flows, technical issues, and confusing interactions that aggregate funnel charts may not explain. Its role is especially useful when a team knows a problem exists but needs more context.
Key features:
- Session replay: Examine interaction sequences to understand the surrounding user experience.
- Behavior and friction: Investigate problematic journeys and repeated user actions.
- Experience analytics: Bring session evidence closer to conversion and user-experience questions.
Pricing: FullstoryFree includes 30,000 monthly sessions, while paid plans use negotiated terms. The free product has limitations on dashboards, advanced privacy features, and certain AI options.
When it is best: Product, design, and support teams that need qualitative session evidence around digital friction.
Important limitation: Replay is not a substitute for cohort and revenue analysis. Privacy controls, sensitive-field masking, consent, and retention settings must be reviewed before collection.
10. LogRocket

LogRocket combines session replay, product analytics, and frontend diagnostics. That makes it relevant when users fail to complete an important flow because of a technical issue, slow interface, or confusing interaction. It provides context that can help developers and product managers investigate problems together.
Key features:
- Session-level evidence: Replay interactions linked with product behavior.
- Technical diagnostics: Examine errors, logs, and network context around experience problems.
- Product analytics: Use funnels and related reports to identify the scale of issues.
Pricing: Published plans start at $176 per month in an annual-billing configuration; the total varies by recorded sessions, seats, retention, and add-ons.
When it is best: Web product teams that need to connect user friction with the technical events causing it.
Important limitation: Capturing sessions and technical details can increase data handling responsibilities. Test privacy masking, recording rules, and usage forecasting before rollout.
11. UXCam

UXCam is centered on mobile app behavior and experience analysis. It combines session-based insight with user and event analytics to help mobile product teams understand screen interactions, friction, and navigation. It is a better fit for a mobile-first product than a team whose main requirement is CRM revenue attribution.
Key features:
- Mobile session analytics: Review app sessions and user interactions.
- Experience diagnosis: Investigate rage taps, freezes, crashes, and related friction indicators.
- Event analysis: Study mobile behavior and, with applicable tiers, more advanced funnels or screen flows.
Pricing: Free plan supports up to 3,000 sessions per month; expanded analytics, funnels, integrations, and support require paid plans or custom quotes.
When it is best: Mobile app startups and product teams that need mobile-oriented experience evidence and behavioral reporting.
Important limitation: The free tier omits several advanced features, including funnels and heatmaps. Compare device support, data masking, and retention before selecting a plan.
12. Quantum Metric
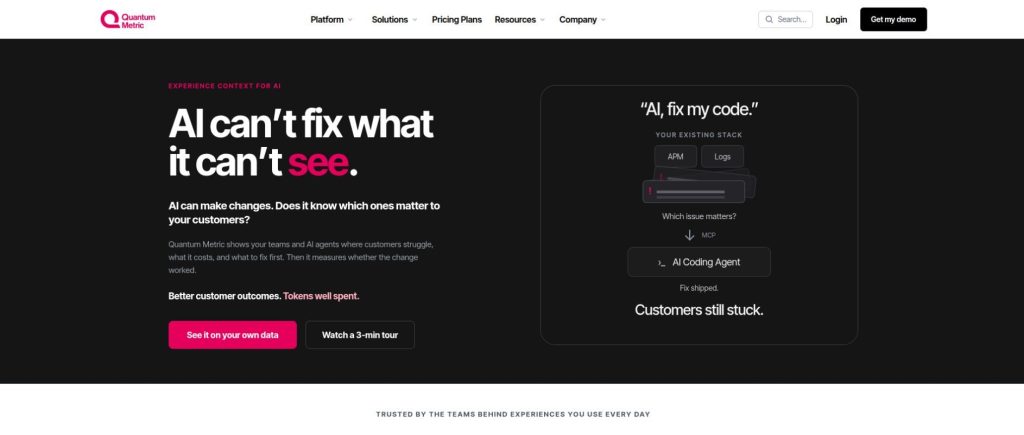
Quantum Metric is an enterprise-oriented digital experience intelligence platform. It supports large teams investigating customer friction across complex digital journeys and prioritizing experience improvements. Its emphasis is on enterprise-scale experience analysis rather than the simplest free event analytics setup.
Key features:
- Digital journey intelligence: Explore how customers move through complex experiences.
- Experience diagnosis: Use interaction-level signals and replay to investigate friction and potential issues.
- Enterprise collaboration: Help product, digital experience, and business teams work from shared findings.
Pricing: Custom enterprise pricing; the public website does not provide one universal starting monthly figure.
When it is best: Large organizations managing complex digital experiences across business units and channels.
Important limitation: Evaluate onboarding, implementation, data governance, and total contract scope carefully. Enterprise experience intelligence is not necessarily the most economical way to answer basic activation questions.
13. Countly
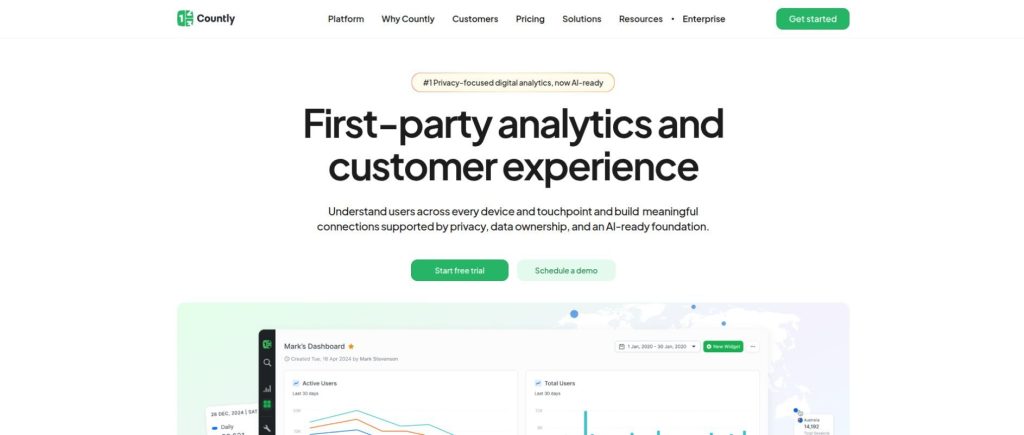
Countly offers product analytics with deployment choices that matter to organizations prioritizing infrastructure and data control. It provides event tracking, user insights, and reporting, with managed private-cloud and self-hosted enterprise approaches. The hosting model is a meaningful differentiator rather than an indication that it will be best for every analytics task.
Key features:
- Product measurement: Capture events, user profiles, and engagement metrics.
- Private deployment options: Choose a managed private-cloud region or enterprise self-hosting.
- Extendable platform: Add engagement, experimentation, or AI-related components depending on plan.
Pricing: Flex starts at $175 per month with private-cloud hosting; Enterprise self-hosted pricing is customized.
When it is best: Organizations needing stronger control over hosting location, deployment responsibilities, or analytics infrastructure.
Important limitation: Deployment flexibility may add operational work. Confirm which components are included, as well as ongoing maintenance and integration needs.
How to choose the right product analytics tool
The best selection process starts with questions, not a software demo. Write down three to five decisions your team needs to make, then evaluate whether a tool can answer them using your actual events and identities.
Start with the decision you want to improve
For onboarding, test whether the platform can show where new users get stuck and which cohorts reach their first meaningful action. For retention, check that it handles the appropriate return event, time window, and user or account level.
For acquisition quality, determine whether the tool can connect campaign context to post-signup behavior and downstream conversions. A product analytics report and a multi-touch revenue attribution report answer related but different questions.
Check event tracking and identity quality
Use a small, realistic event taxonomy in the evaluation. Confirm how the tool handles anonymous users who sign up, user IDs across devices, duplicate events, account membership, bot activity, and historical data.
A dashboard with attractive numbers is not useful if the underlying definitions change across teams. Verify event names, properties, conversion definitions, and timezones before comparing reports.
Compare analytical workflows rather than feature labels
Two platforms may both advertise funnels but handle exclusions, breakdowns, conversion windows, and retroactive analysis differently. Build the same funnel and retention cohort in each trial and document the results.
If your team needs experiments, in-app guides, or replay, confirm that those tools are included at the pricing tier you are evaluating. Do not assume an analytics product includes unlimited access to every adjacent module.
Model total ownership cost
| Pricing unit | Common examples | What can raise the bill |
|---|---|---|
| Events | Mixpanel, Amplitude, PostHog, Statsig | High-volume autocapture and frequent product actions |
| Sessions | Heap, Fullstory, LogRocket, UXCam | Traffic growth, replay capture, and retention settings |
| Monthly active users | Pendo, Userpilot | Wider product adoption and expanding active audiences |
| Custom contract | Usermaven, Quantum Metric, enterprise tiers | Integrations, deployment, governance, support, and scale |
An event allowance is not directly comparable to a session allowance or a monthly active user allowance. Estimate your own volumes, growth rate, team seats, and integrations, then request a price for the configuration you actually need.
Check privacy, export, and ongoing governance
Assess consent workflows, masking controls, access permissions, retention policies, security requirements, and whether your team can export its data. Replay and autocapture require particular care to avoid collecting sensitive information unnecessarily.
Finally, identify the person or team that will maintain event definitions. Even a capable analytics platform becomes less useful when nobody owns tracking changes after product releases.
Which product analytics tool is best for your business?
For SaaS marketing and revenue teams: Usermaven is worth evaluating when product engagement must be interpreted alongside marketing acquisition, CRM activity, or attributed revenue. The key question is whether that connected view informs budget or growth decisions.
For self-service product teams: Mixpanel and Amplitude offer sophisticated event-based workflows. Choose based on analytics complexity, collaboration, pricing, and the implementation your team can support.
For startups and engineering teams: PostHog offers a broad modular toolkit; Statsig is particularly relevant when feature flags and experimentation are central. Their free event limits are attractive, but ongoing usage matters.
For onboarding and adoption: Pendo and Userpilot help turn segment insight into in-app guidance. Evaluate whether the need is reporting, user education, or both.
For mobile and technical UX: UXCam is mobile-focused; Fullstory and Quantum Metric emphasize experience intelligence, while LogRocket adds strong debugging context. Match the product to your platform and diagnostic questions.
For data control or retrospective capture: Countly offers deployment flexibility, while Heap emphasizes autocapture and retrospective interaction analysis. These solve different operating problems and should not be compared on price alone.
Common mistakes when comparing product analytics platforms
- Choosing by popularity: A familiar brand may not answer your highest-priority product or revenue question.
- Comparing free tiers as equals: Events, sessions, and MAUs are different units with different overage rules.
- Skipping identity checks: Incorrect joins between anonymous and authenticated activity distort funnels and retention.
- Treating correlation as causation: A behavioral pattern indicates where to investigate, not why an outcome happened.
- Ignoring privacy controls: Autocapture and replay need consent, masking, and access reviews appropriate to the data.
- Underestimating migration: Historical trends, group definitions, and saved reports may not transfer cleanly to a new vendor.
For product teams, the next step after choosing a platform is deciding which product metrics and product analytics strategy will make the measurement program useful.
Choose a tool around the decision, not the dashboard
A strong product analytics setup makes it easier to detect friction, understand patterns, test improvements, and connect important user behavior with business outcomes. The right platform is the one your team can implement accurately and use consistently.
If your next question is how acquisition sources contribute to activated users, conversions, pipeline, and revenue, explore how Usermaven joins marketing attribution and product analytics. Book a demo to review the workflows relevant to your business.
FAQs
1. What are the best product analytics tools in 2026?
There is no universal winner. Usermaven fits acquisition-to-product and revenue measurement; Mixpanel and Amplitude fit behavioral analytics; PostHog and Statsig appeal to engineering and experimentation teams. UXCam and Fullstory help investigate experience issues, while Pendo and Userpilot emphasize adoption.
2. What is the best free product analytics tool?
Mixpanel, Amplitude, PostHog, Statsig, Heap, Pendo, Fullstory, and UXCam publish free allowances of different kinds. The best choice depends on the features included at zero cost and whether your expected events, sessions, or active users fit the limit.
3. What is the difference between product analytics and web analytics?
Web analytics usually emphasizes visits, acquisition, website engagement, and traffic sources. Product analytics focuses more on user actions, activation, feature adoption, cohorts, and retention inside an application. Some platforms support both categories.
4. Do product analytics tools include session replay?
Some do, including PostHog, Fullstory, LogRocket, UXCam, and selected plans from other vendors. Availability, session limits, mobile coverage, retention, and privacy features vary. Replay can clarify behavior, but it should complement structured reporting.
5. What should a SaaS startup look for first?
Start with reliable event tracking, clear user identities, an activation funnel, and a useful retention report. Add experiments or replay when they solve specific questions. Evaluate future billing at realistic event volume instead of choosing solely by a free tier.
6. Can product analytics show which marketing channels bring valuable customers?
It can help when acquisition information is connected to users and product events. To evaluate conversion contribution across campaigns and touchpoints, teams may also need dedicated marketing attribution and CRM integrations. That is where Usermaven’s combined capabilities are relevant.

Written by
Adeel Khan
Growth Marketing Expert
Adeel Khan is a full-stack SaaS marketer with 10+ years of experience in content marketing, paid advertising, analytics, and conversion rate optimization. He shares practical insights and strategies drawn from hands-on experience, helping B2B SaaS marketers improve performance and make better marketing decisions.
All articles by Adeel →