Notice how some products seem to connect with users right away, while others never quite take off?
It is rarely about features alone. The winning products are backed by teams that understand what their customers actually do, feel, and value.
Product marketing KPIs, powered by solid product analytics, show how people use your product, where they drop off, and what drives real growth. Without these insights, even great ideas can miss their moment.
Let’s check out the metrics that help you see the full picture and make smarter product decisions.
What is product marketing?
Product marketing connects the product with the right audience by defining positioning, shaping messaging, and driving go-to-market strategy. It focuses on helping users understand the product’s value, adopt it successfully, and stay engaged over time.
The goal is to support growth by improving acquisition, activation, and retention through customer insight and cross-functional alignment.
What is a product marketing metric/KPI?
Product marketing KPIs (key performance indicators) are metrics that show how well your product performs in the market. They help you understand:
- Are users adopting the product as expected?
- Are your marketing campaign insights showing an impact on user behavior and conversions?
- Are customers staying long enough to remain profitable?
- Is the product positioned correctly to attract the right audience?
Power up your SaaS
with perfect product analytics
Core product marketing KPIs for evaluating product success
To understand how your product is performing, you need a clear view of the metrics that reflect real user behavior and market response. These core KPIs highlight what’s working, what needs improvement, and where your product may be facing friction.
Let’s take a look at them one by one.
These KPIs show whether the product creates sustainable business value. They help marketers understand the financial impact of positioning, messaging, and GTM efforts.
1. Monthly recurring revenue (MRR)
MRR is the total predictable revenue your product generates each month from subscription customers.
Formula:
MRR = Sum of all monthly subscription revenue
If you have annual plans, convert them into their monthly equivalent and include them in the calculation.
Why it matters:
- Core indicator of SaaS health
- Helps understand the momentum of product adoption
- Reveals how pricing, packaging, and positioning impact growth
Additionally, MRR trends can highlight seasonal behavior and the effectiveness of marketing campaigns, making it a core part of your revenue analytics framework.
2. Annual recurring revenue (ARR)
ARR is the total yearly revenue generated from subscription customers.
Formula:
ARR = MRR × 12
Why it matters:
- Important for long-term forecasting
- Helps assess enterprise stability and strategic growth potential
- Useful when evaluating the impact of large deals and multi-year contracts
ARR is also essential for long-term planning and aligns closely with revenue forecasting models used by SaaS companies.
3. Revenue growth rate
Revenue growth rate measures how quickly your recurring revenue increases over a defined period.
Formula:
Revenue growth rate = ((Current period revenue – Previous period revenue) ÷ Previous period revenue) × 100
Why it matters:
- Shows whether the market is responding to your positioning
- Identifies when product adoption slows
- Helps evaluate the impact of GTM campaigns, feature launches, or pricing changes
Low growth often signals issues in positioning or acquisition, which becomes clearer when using revenue attribution to identify which channels actually drive revenue increases.
4. Expansion revenue
Revenue gained from existing customers through upgrades, cross-sells, add-ons, or usage-based expansion.
Examples include:
- Upgrading from basic → pro
- Adding more team members or seats
- Purchasing advanced features
- Increasing usage in a usage-based model
Why it matters:
- Strong expansion revenue shows customer satisfaction and long-term product value
- Indicates that your product grows with customers as their needs evolve
- Reduces dependency on net-new acquisition
Strong expansion revenue is often a hallmark of product-market fit. It also plays a key role in achieving your revenue goals for your SaaS, since sustainable growth increasingly comes from existing customers rather than new acquisition.
5. Net revenue retention (NRR)
NRR measures how much recurring revenue you retain from existing customers after accounting for churn, contraction, upgrades, and expansion.
Formula:
NRR = ((Starting MRR + Expansion – Contraction – Churn) ÷ Starting MRR) × 100
Why it matters:
- Considered the most important SaaS revenue metric
- Reflects the true value customers get from your product
- High NRR (>110% for SaaS companies) signals strong retention and expansion momentum
- Helps forecast long-term revenue without relying heavily on acquisition
When NRR is strong, even moderate new acquisition can produce high overall growth.
How Usermaven support revenue performance:
Usermaven links acquisition channels with product usage and retention data to reveal which activities drive high-value, long-term customers. This helps teams refine targeting, enhance positioning, and improve revenue outcomes with clarity.
Power up your SaaS
with perfect product analytics
Customer acquisition & conversion KPIs
These KPIs show how well your go-to-market engine attracts and converts the right users.
6. Customer acquisition cost (CAC)
Customer acquisition cost measures the total cost required to acquire one new customer. Monitoring your average customer acquisition cost helps you understand how efficiently you’re turning leads into paying users.
Formula:
CAC = Total sales & marketing spend ÷ Number of new customers acquired
Why it matters:
- High CAC may signal weak messaging, poor targeting, or inefficient channels
- Very important for understanding payback period and long-term profitability
- Helps compare the effectiveness of individual acquisition channels
- Tracking CAC over time makes it easier to identify opportunities for reducing CAC through better segmentation, improved onboarding, or optimized marketing campaigns
SaaS companies aim for CAC < ⅓ of LTV to maintain healthy growth economics.
7. Lead-to-customer conversion rate
The percentage of leads that convert into paying customers.
Formula:
Lead-to-customer conversion rate = (Number of new customers ÷ Number of leads) × 100
Why it matters:
- Reflects how well your messaging matches audience needs
- Helps validate whether your ICP is correct
- Lower rates often mean friction in evaluation, unclear value proposition, or competitive pressure
A strong conversion rate suggests effective positioning and a compelling product narrative.
8. Signup-to-activation rate
The percentage of signups who reach the product’s activation milestone, usually the first meaningful action that demonstrates value (e.g., adding data, creating a project, integrating a tool).
Formula:
Signup-to-activation rate = (Activated users ÷ Total signups) × 100
Why it matters:
- One of the earliest indicators of retention potential
- Low activation metrics typically point to onboarding gaps or misaligned expectations
- Improving activation has an outsized impact on revenue and churn reduction
Activation is where product marketing and product experience intersect.
9. Free-to-paid conversion rate
Shows how many free or trial users become paying customers.
Formula:
Free-to-paid conversion rate = (New paid customers from free/trial ÷ Total free/trial users) × 100
Why it matters:
- Measures whether the product demonstrates value quickly
- Essential for PLG (product-led growth) strategies
- Helps refine trial length, onboarding flow, and value moments
If this rate is low, investigate TTV (time to value) and trial experience.
10. Demo-to-close rate
The percentage of product demos that result in closed deals.
Formula:
Demo-to-close rate = (Closed-won deals ÷ Completed demos) × 100
Why it matters:
- Indicates how well the sales narrative aligns with buyer needs
- Helps evaluate the effectiveness of PMM enablement (battlecards, messaging, competitor positioning)
- Useful for sales-led or hybrid GTM teams
A strong rate often reflects clear differentiation and compelling product value.
How Usermaven supports acquisition & conversion performance:
Usermaven’s funnel analytics highlight exactly where users drop off across the user journey from impression to signup, activation, and paid conversion. This helps teams identify friction points, optimize acquisition channels, and improve conversion rates at every stage.
Product adoption & onboarding KPIs
Adoption KPIs show whether users understand the product and reach value quickly.
11. Activation rate
Activation rate measures the percentage of new users who complete the core action that demonstrates early value, such as connecting a data source, creating their first project, or inviting teammates.
Formula:
Activation rate = (Number of activated users ÷ Total new signups) × 100
Why it matters:
- One of the strongest predictors of retention
- Reflects how quickly users understand the product’s value
- Helps identify friction in onboarding and first-use experience
Improving activation often has a direct and immediate impact on churn reduction.
12. Onboarding completion rate
This measures how many new users complete your full onboarding sequence, whether it’s a guided tour, checklist, setup wizard, or multi-step configuration process.
Formula:
Onboarding completion rate = (Users who complete onboarding ÷ Users who started onboarding) × 100
Why it matters:
- Highlights where users drop off during early setup
- Low completion usually signals confusing steps or too much required effort
- Strong onboarding completion = faster time to value and higher conversion
A smooth onboarding flow helps users confidently reach their first “aha” moment.
13. Time to value (TTV)
Time to value TTV measures how long it takes a new user to experience meaningful product value for the first time.
Why it matters:
- Shorter TTV leads to higher activation, conversions, and retention
- Long TTV increases the risk of abandonment, especially in PLG products
- Helps teams identify unnecessary friction or onboarding complexity
Reducing TTV is one of the most effective growth levers in SaaS.
14. Feature adoption rate
The percentage of users who adopt a specific feature or set of features over a defined time period.
Formula:
Feature Adoption Rate = (Users who use the feature ÷ Total active users) × 100
Why it matters:
- Shows which features deliver the most value
- Helps product teams prioritize improvements, enhancements, or sunsetting
- Useful for analyzing the impact of feature launches and in-app messaging
Feature adoption trends often reveal whether users understand your product’s full capabilities.
15. Breadth of usage
Measures how many different features or modules users interact with.
Why it matters:
- Wide feature usage is strongly correlated with long-term retention
- Indicates users are exploring beyond basic functionality
- Helps product teams identify “power users” vs. “surface-level users”
Low breadth often means users see limited value or don’t understand available capabilities.
16. Depth of usage
Measures how frequently users engage with your most important features.
Why it matters:
- Indicates how central your product is to a user’s workflow
- Strong depth of usage leads to habit formation and high retention
- Helps identify which features drive stickiness
High depth of usage shows that users rely on your product consistently not just occasionally.
How Usermaven supports product adoption
Usermaven reveals how users progress through onboarding, which actions lead to activation, and which features drive long-term usage. Its funnels, journey insights, and feature tracking make it easy to spot friction and refine the onboarding experience. This helps teams improve the adoption curve across the entire user journey.
Product engagement KPIs
Engagement KPIs measure how consistently users interact with your product. High engagement indicates that users find recurring value, build habits, and rely on your product as part of their workflow.
Power up your SaaS
with perfect product analytics
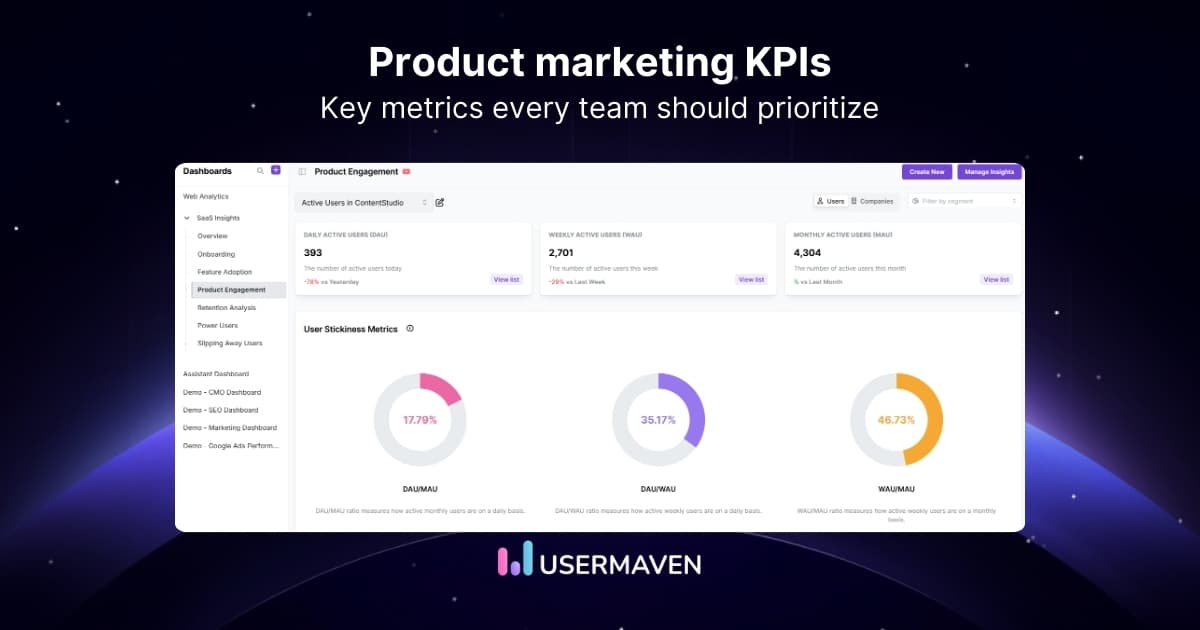
17. Daily active users (DAU) / Monthly active users (MAU)
DAU and MAU measure the number of unique active users daily and monthly. They are foundational indicators of product health and user interest.
Why they matter:
- Provide a baseline understanding of overall product engagement
- Help spot sudden drops in usage that may indicate issues with UX, bugs, or lost relevance
- Essential for understanding seasonality and user behavior patterns
DAU and MAU are most powerful when analyzed together through stickiness.
18. Stickiness ratio (DAU ÷ MAU)
Stickiness measures how often users return to your product within a month.
Formula:
Stickiness = DAU ÷ MAU
Why it matters:
- High stickiness = habitual use and strong product value
- Low stickiness often indicates the product is used occasionally or only when needed
- Great for evaluating the success of habit-forming features
A stickiness ratio above 20% is considered strong for most SaaS tools.
19. Session frequency
The number of times a user logs in or returns to the product during a specific period (daily, weekly, or monthly).
Why it matters:
- Frequent sessions indicate that users depend on the product for ongoing tasks
- Low frequency may reveal limited perceived value or a lack of workflows requiring the product
- Helps identify engagement patterns across user segments
Session frequency is especially important in collaboration, productivity, and analytics tools.
20. Session duration
Measures how much time users spend in the product during each session.
Why it matters:
- Longer sessions often reflect deep engagement, especially for workflow-heavy products
- Short sessions may indicate quick value delivery or lack of complexity context matters
- Best analyzed alongside feature usage or workflow completion rates
Session duration becomes more meaningful when paired with task or feature-specific analytics.
21. Product-qualified leads (PQLs)
PQLs are users who reach a specific usage threshold that indicates strong buying intent such as completing key workflows, hitting usage limits, or inviting teammates.
Why it matters:
- One of the most important KPIs for PLG (product-led growth) models
- Helps identify users who are most likely to convert to paid plans
- Aligns sales outreach with real product behavior instead of surface-level lead scoring
- Often more predictive than MQLs in SaaS companies
A well-defined PQL framework increases both conversion and retention.
How Usermaven supports engagement analysis:
Usermaven helps teams understand why engagement rises or drops by showing which users return often and which features keep them active. Through its event tracking feature, along with feature usage reports and cohort insights, Usermaven’s custom dashboard highlights the actions that lead to upgrades or long-term retention.
Customer satisfaction & sentiment KPIs
These KPIs help measure whether customers are happy with the product experience and overall value.
A measure of customer loyalty and likelihood to recommend the product.
Why it matters:
- Strong indicator of overall product experience
- Directly linked to word-of-mouth and organic growth
- Helps PMMs evaluate whether messaging and value propositions resonate
High NPS often correlates with strong retention and healthy expansion revenue.
23. Customer satisfaction score (CSAT)
Measures how satisfied users are with a specific interaction, feature, or experience.
Why it matters:
- Useful for evaluating launches, onboarding steps, or newly introduced features
- Helps PMMs understand whether expectations set by messaging align with reality
- Enables targeted improvements across the product journey
CSAT is ideal when collecting feedback at key milestones.
24. Feature sentiment
Insight into which features customers love, find helpful, or struggle with. Usually collected through surveys, NPS comments, reviews, or direct feedback.
Why it matters:
- Helps shape product narratives and positioning
- Informs roadmap prioritization by showing what users value most
- Reveals friction points that may affect adoption or retention
Feature sentiment is one of the most actionable inputs PMMs can bring to product teams.
Power up your SaaS
with perfect product analytics
Retention and churn KPIs
Retention is often the most important KPI for SaaS product marketers, because strong retention leads to predictable revenue growth.
25. Retention rate
Retention rate measures the percentage of users who continue using the product over a set period of time.
Formula:
Retention rate = (Users at end of period ÷ Users at start of period) × 100
Why it matters:
- High retention indicates that users consistently experience value
- Cohort analysis helps identify retention patterns by segment, plan type, or acquisition channel
- Strong retention often signals product-market fit and healthy user engagement
Retention is a foundational KPI; without it, acquisition becomes expensive and unsustainable.
26. Churn rate
Churn rate measures the percentage of customers who cancel or stop using your product within a given time period, and it’s a core metric in any churn analysis framework.
Formula:
Churn rate = (Customers lost during period ÷ Customers at start of period) × 100
Why it matters:
- Direct indicator of product gaps, onboarding issues, or poor ICP targeting
- Typically moves before revenue metrics decline
- Helps PMMs identify messaging gaps, unmet expectations, or competitive pressure
Churn is one of the clearest signals that users are not achieving their expected outcomes.
27. Revenue churn
Revenue churn captures the amount of recurring revenue lost due to cancellations or downgrades.
Formula:
Revenue churn = (MRR lost from churn + downgrades ÷ Starting MRR) × 100
Why it matters:
- Reveals the financial impact of churn, beyond just customer count
- Helps identify segments that produce higher contraction
- More accurate for SaaS businesses with multiple pricing tiers
A company can have good user retention but poor revenue retention if many users downgrade instead of cancelling.
28. Customer health score
A composite metric that predicts the likelihood of renewal or churn based on multiple signals such as usage patterns, feature adoption, engagement, support activity, or NPS.
Why it matters:
- Identifies at-risk customers before they churn
- Helps PMMs understand which behaviors correlate with long-term value
- Guides proactive customer success and lifecycle messaging
- Useful for segmentation and prioritizing retention initiatives
A well-structured health score allows teams to take action before churn becomes visible.
Post–product market fit KPIs
After achieving product-market fit, marketers shift focus from validation to scaling, segment optimization, and competitive positioning. The following KPIs help guide growth-stage decisions.
29. Market share
Market share measures how much of the total addressable market your product has captured compared to competitors.
Why it matters:
- Indicates competitive strength and category leadership
- Helps evaluate whether GTM, positioning, and differentiation strategies are effective
- Useful for forecasting growth potential and spotting new opportunities
A growing market share signals strong brand positioning and customer preference.
30. Retention by segment or cohort
Retention broken down by customer segments (ICP, company size, industry, plan type) or acquisition cohorts (month, channel, campaign).
Why it matters:
- Reveals which segments deliver the highest long-term value
- Helps refine ICP targeting and messaging for future growth
- Identifies segments with high churn, critical for roadmap and positioning decisions
- Enables more accurate forecasting and prioritization
Segment-based retention is one of the most powerful ways to understand where your product is truly winning.
Power up your SaaS
with perfect product analytics
How to use product marketing KPIs effectively
Tracking KPIs is only useful when they drive better decisions. Product marketers get the most value from KPIs when they use them to refine messaging, improve onboarding, strengthen positioning, and guide roadmap conversations.
Here’s how to put your KPIs to work.
Connect KPIs to specific stages of the user journey
Every KPI should map to a step in the customer lifecycle, acquisition, activation, adoption, engagement, retention, or expansion.
Example:
- Low activation rate → onboarding needs improvement
- Low engagement → messaging doesn’t communicate the right value
- High churn → product isn’t solving the right problem for the right ICP
When KPIs are tied to a journey stage, insights become actionable.
Use KPIs to refine your ICP and positioning
KPIs reveal which segments respond best to your product. For example:
- High retention in mid-market → strong fit, tailor messaging
- Low feature adoption for enterprise → positioning mismatch
Data-driven ICP refinement is one of the strongest advantages product marketers have.
Prioritize improvements using impact, not intuition
When several KPIs trend downward, use this sequence to prioritize:
Activation → Engagement → Retention → Expansion
Why?
Fixing early-stage friction (like activation) has a bigger downstream impact than optimizing expansion or upsells.
Benchmark KPIs using cohorts and channels
Looking at overall KPIs often hides the real story.
Better approach:
Segment KPIs by:
- Acquisition channel
- ICP segment
- Plan type
- Feature usage
- Time-based cohorts
This helps identify high-performing pockets of users and the ones driving churn.
Turn KPI insights into experiments
Each KPI trend should lead to a clear hypothesis and experiment.
Example:
- Problem: Low free-to-paid conversion
- Hypothesis: Users aren’t reaching the value moment quickly
- Experiment: Redesign onboarding to shorten time-to-value
This makes KPIs part of a continuous improvement cycle.
Review KPIs as a cross-functional team
KPIs are most powerful when product marketing, product, growth, and customer success review them together.
This helps teams:
- Align on priorities
- Understand where friction truly occurs
- Make integrated, data-backed decisions
This cross-functional view elevates product marketing’s strategic role.
Revisit KPIs as the company scales
Your KPI focus changes as you grow:
- Early stage: activation, adoption, ICP fit
- Growth stage: engagement, retention, conversion
- Scale: expansion revenue, segment-level retention, market share
When teams scale and more people gain access to product and analytics tools, it becomes important to manage permissions carefully. This includes setting clear guidelines for protecting company data after an employee leaves so that KPIs and sensitive insights remain secure. Strong data governance ensures that only the right people access customer information, product metrics, and internal reporting.
Quick note: For scaling GTM execution without adding more manual work, check out our blog on top AI agents for GTM strategies.
Why you should be using product marketing KPIs
If you’re not already tracking product marketing KPIs, now is the time to start. Here’s why they matter:
- They reveal progress and highlight areas that need improvement.
- They keep your team aligned on the right goals.
- They make it easier to communicate results to stakeholders.
- They support better product and marketing decisions.
- They help measure the ROI of your initiatives.
- They uncover new opportunities for growth.
- They allow you to benchmark performance against competitors.
- They help monitor customer satisfaction trends.
- They surface issues early, before they become bigger problems.
- They strengthen your case for future investment in product marketing.
Product marketing KPIs give you clarity, direction, and actionable insight making them essential for sustainable growth.
How do you measure product marketing success?
There are several ways to measure product marketing success, but common KPIs include conversion rates, customer acquisition cost, customer lifetime value, and engagement metrics.
It’s helpful to look at KPIs through two lenses: pre–product-market fit and post–product-market fit.
Before product-market fit, teams focus on understanding their audience and refining positioning. Success at this stage is often measured through:
- Sales effectiveness
- Win rates in priority segments
- Reasons for winning or losing deals
After achieving product-market fit, responsibilities expand and focus shifts toward scale. At this stage, important KPIs include:
- Brand recognition
- Feature adoption
- Conversion rates across inbound channels
Product marketers prioritize long-term results, knowing that sustainable growth comes from consistent improvements in adoption, engagement, and customer value not just short-term wins.
To wrap it up!
Product marketing KPIs give you a clear view of how well your product performs across acquisition, activation, engagement, and retention. They help you understand what’s working, what needs improvement, and where to focus your efforts for long-term growth.
If you want reliable insights that help you measure performance and make confident decisions, using the right analytics platform is essential. Usermaven is the best website analytics tool available for teams that need accurate tracking, meaningful user insights, and a complete view of the customer journey. It helps you understand what drives conversions, which features create value, and where users drop off.
To wrap it up!
Product marketing KPIs give you a clear view of how well your product performs across acquisition, activation, engagement, and retention. They help you understand what’s working, what needs improvement, and where to focus your efforts for long-term growth.
If you want reliable insights that help you measure performance and make confident decisions, using the right platform is essential. As an advanced attribution software, Usermaven combines website analytics, product analytics, and marketing attribution to give you a complete view of the customer journey. It helps you understand which channels drive conversions, which features create value, and where users drop off so you can make smarter product and marketing decisions.
Start your free trial today or book a demo to see how Usermaven can help you optimize your product marketing strategy. Our team is here to support you every step of the way.
Power up your SaaS
with perfect product analytics
FAQs
What is the difference between product marketing KPIs and product marketing OKRs?
KPIs measure performance, while OKRs define the goals you want to achieve. KPIs track ongoing metrics such as activation or retention, whereas OKRs describe target outcomes for a specific period. Together, they create a clear framework for measuring progress and guiding strategy.
What are leading vs. lagging indicators in product marketing?
Leading indicators predict future outcomes, such as activation rate or onboarding completion. Lagging indicators reflect results that have already occurred, such as churn or revenue. Product marketers track both to forecast performance and make informed decisions.
How many KPIs should a product marketing team track?
Most product marketing teams track 8–12 KPIs across acquisition, activation, engagement, and retention. Tracking too many dilutes focus. The right KPIs depend on your growth stage; early-stage teams focus on activation and ICP fit, while mature teams prioritize retention, expansion, and feature adoption.
How do KPIs support better cross-functional alignment?
KPIs create a shared language between product, marketing, and customer success. They clarify what success looks like, reduce subjective decision-making, and help teams prioritize work based on measurable impact.
Can product marketing KPIs influence roadmap decisions?
Yes. KPIs like activation barriers, feature adoption trends, and segment-level retention often highlight where the product needs refinement. These insights help product teams prioritize features that increase value and reduce friction.