Qualitative data analysis is the systematic process of examining non-numerical information – such as text, images, audio, and video – to discover meaningful patterns, themes, and insights. For marketing and product teams, this approach has become increasingly valuable as they seek to understand the human elements behind metrics and statistics.
The landscape of qualitative research is evolving rapidly. While traditional manual analysis methods remain important, automated tools are transforming how teams process and interpret qualitative data. This shift allows researchers to maintain depth while significantly improving efficiency.
In this comprehensive guide, we’ll walk through the entire qualitative data analysis process, from defining research questions to presenting actionable findings. You’ll discover how to effectively combine human insight with technological assistance to unlock the full potential of your qualitative data.
Understanding qualitative data and its collection methods
Qualitative data consists of non-numerical information that captures human experiences, behaviors, and perceptions in product analytics. Unlike quantitative data (numbers and statistics), qualitative data provides context, nuance, and depth to help explain why people behave in certain ways.
This type of data includes interview transcripts, open-ended survey responses, social media comments, customer reviews, forum discussions, and support ticket narratives for website analytics. Tools like AidaForm make it easy to create customized online forms and surveys to collect qualitative insights directly from users, helping you gather real feedback that explains the “why” behind customer actions. These sources offer rich insights into customer motivations, pain points, and experiences that quantitative metrics alone cannot reveal.
For example, while analytics might show that users abandon a checkout process at a specific point, only qualitative data can reveal their frustration with unclear shipping options or concerns about payment security in user journeys.
Common qualitative data collection methods
Several methods are available for gathering qualitative data, each with distinct advantages for specific research goals in analytics dashboards:
Interviews provide in-depth, personal insights from individuals. Structured interviews follow a rigid set of questions, semi-structured interviews allow for some deviation while maintaining focus, and unstructured interviews flow more like natural conversations.
Focus groups bring together small groups of participants (typically 6-10 people) to discuss topics guided by a moderator.
Observations involve watching participants in natural settings (participant observation) or from a distance (non-participant observation).
Open-ended surveys allow respondents to express thoughts in their own words rather than choosing from pre-defined options.
Document analysis examines existing materials like customer emails, support tickets, or social media posts.
When selecting collection methods, consider your research questions, available resources, and time constraints. Many researchers combine multiple methods to gain more comprehensive insights and validate findings across different data sources.
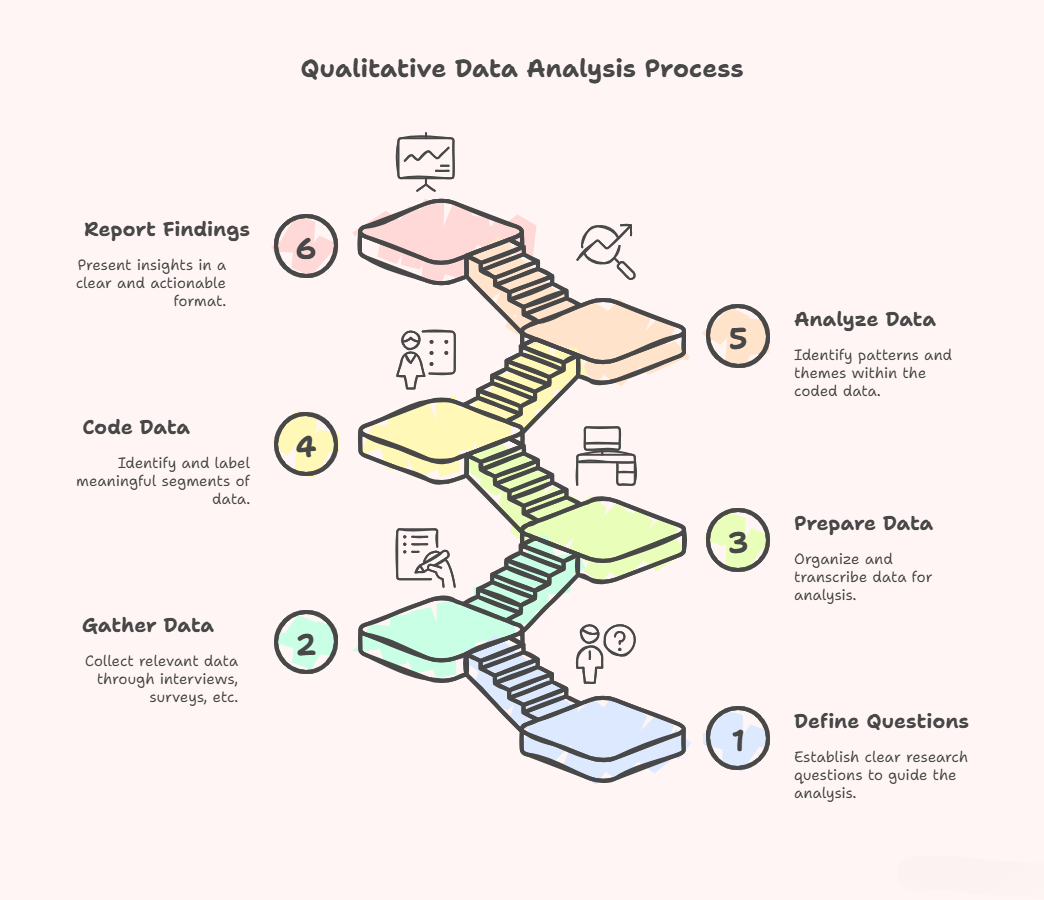
The qualitative data analysis process: A step-by-step guide
Analyzing qualitative data may seem overwhelming at first, but breaking the process into manageable steps makes it both approachable and insightful. Whether you’re uncovering friction points in user onboarding or identifying patterns in customer feedback, this structured guide will help you navigate each phase with clarity and confidence. Let’s walk through the essential steps to make sense of your qualitative insights.
Step 1: Define research questions
Clear research questions provide direction for your entire qualitative data analysis process. Without them, you risk collecting irrelevant data or drawing unfocused conclusions.
Effective research questions for qualitative studies should be specific yet open-ended for growth teams. For example, instead of asking “Do users like our product?” (which invites simple yes/no answers), ask “What aspects of our product create friction for new users?” or “How do customers describe their experience with our onboarding process?”
Well-crafted questions align with business objectives while encouraging rich responses for marketing teams. They often begin with “how,” “why,” or “what” to elicit detailed information rather than simple confirmation.
Before proceeding to data collection, test your questions with a small group to ensure they elicit the kind of information you need. Refine them based on initial responses to improve clarity and relevance.
Step 2: Gather qualitative data
Once your research questions are defined, it’s time to collect data using the methods described earlier for product teams. When gathering qualitative data, consistency in approach is crucial for ensuring comparable results.
When conducting interviews or focus groups, prepare a discussion guide to maintain consistency across sessions. Record sessions (with permission) to capture exact wording and tone. For surveys, clearly explain the purpose and ensure questions are neutral rather than leading.
Ethical considerations are paramount during data collection. Always obtain informed consent from participants, explaining how their data will be used. Protect participant privacy by anonymizing responses and storing data securely.
Consider sampling strategy carefully – random sampling may be less important than purposeful sampling that captures diverse perspectives relevant to your research questions. Continue collecting data until you reach “saturation” (when new data no longer adds significant insights).
Step 3: Prepare and organize data
Raw qualitative data requires preparation before analysis can begin in user segments. This stage transforms scattered information into an organized dataset ready for coding.
Start by transcribing audio or video recordings verbatim, capturing not just words but also meaningful pauses or emotional reactions when relevant. For handwritten notes or physical documents, create digital versions to facilitate searching and analysis.
Create a consistent file naming convention and organized folder structure to manage your data. For example: “Interview_UserType_Date” or “SurveyResponse_Channel_Date.” This organization prevents confusion and saves time during analysis.
Consider using specialized qualitative data analysis software or even spreadsheets for smaller projects to centralize your data and reduce data quality risks during analysis. Create backups to prevent data loss, and develop a codebook that documents your organizational system so others can understand your approach.
During this phase, perform initial data cleaning by removing identifying information to maintain participant anonymity and correcting obvious transcription errors without altering meaning.
Step 4: Coding the qualitative data
Coding is the process of identifying and labeling meaningful segments of your data in marketing funnels. This critical step transforms raw information into organized categories that enable pattern recognition.
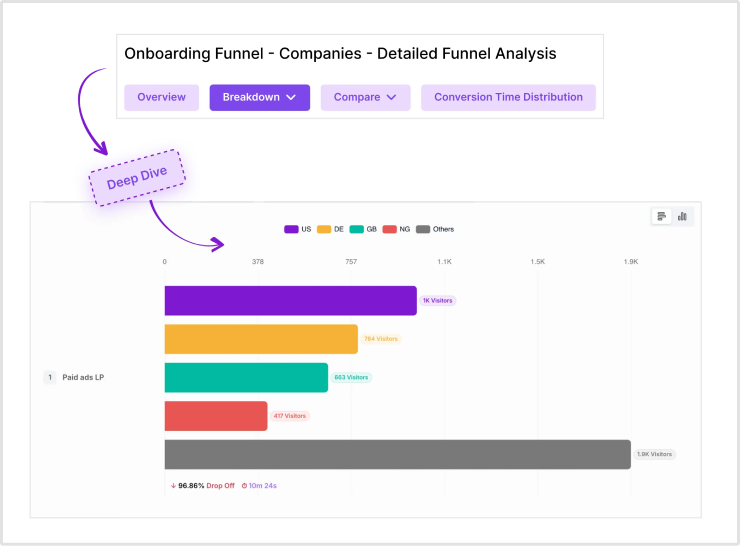
Funnel analysis in Usermaven
When coding manually, you can take either a deductive approach (using predetermined codes based on your research questions) or an inductive approach (allowing codes to emerge from the data itself) for ecommerce brands. Many researchers use a combination of both methods, starting with some initial codes but remaining open to discovering unexpected themes.
To begin coding manually:
Read through all data to get familiar with the content
Create an initial list of codes based on research questions and initial impressions
Work through small sections of data, assigning codes to relevant passages
Revise and refine your codes as you progress
Develop a hierarchical coding system with main codes and sub-codes for more nuanced analysis
Whether using manual or automated approaches, develop a detailed codebook documenting each code’s definition and when to apply it. This enhances consistency, especially when multiple people are involved in coding.
Step 5: Analyzing the data
After coding, the next step is identifying patterns, themes, and relationships within your coded data for attribution analysis. This analytical phase transforms categorized information into meaningful insights.
Begin by examining code frequency – which codes appear most often across your dataset? While frequency doesn’t always equal importance, it can highlight prominent themes. Look beyond simple counts to explore how codes relate to each other. Do certain codes frequently appear together? This co-occurrence might indicate important relationships.
Compare responses across different participant segments in customer journeys. For example, do new users mention different pain points than experienced users in analytics trends? Do customers from different regions or demographics show distinct patterns in their feedback?
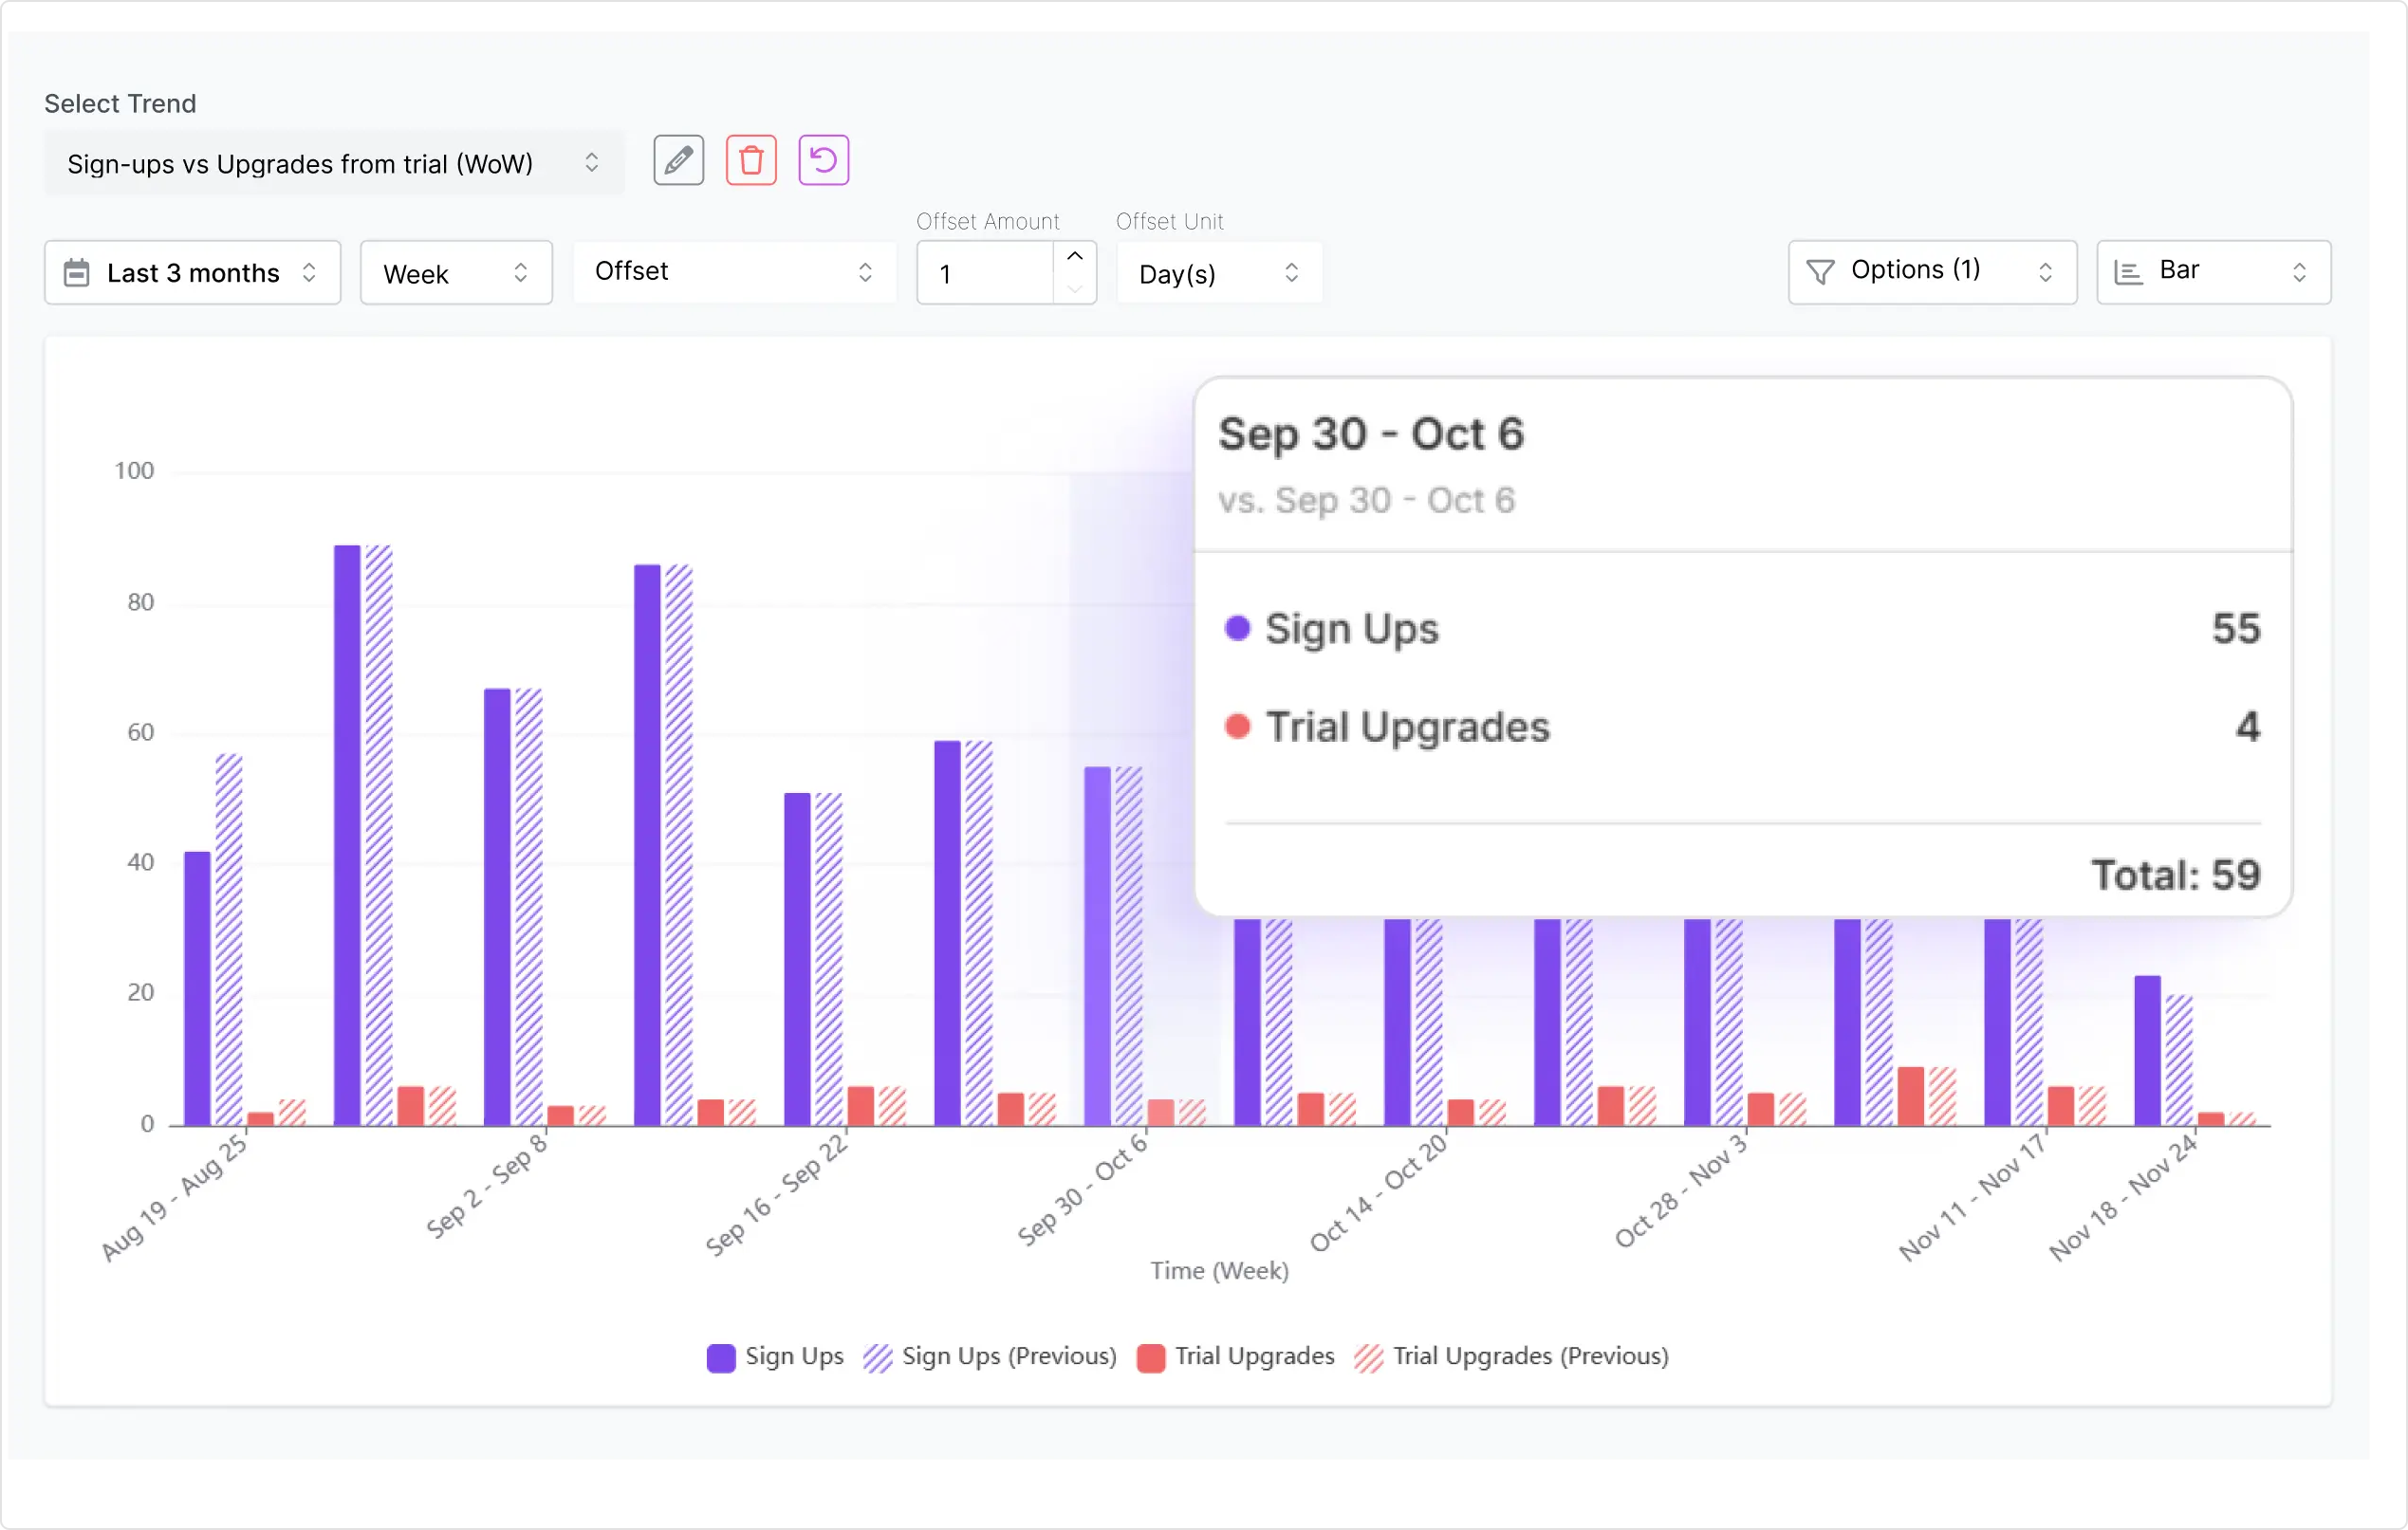
Trend analysis in Usermaven
Look for outliers and negative cases that contradict emerging patterns. These exceptions often provide valuable context or reveal important nuances in your data.
Use thematic mapping to visualize relationships between codes and themes. This can be done manually on paper, with sticky notes, or using specialized software. Creating visual representations helps identify broader narratives and connections within your data.
Throughout analysis, continuously return to your research questions to ensure your findings address your core objectives. The goal isn’t just to identify patterns but to develop meaningful insights that answer your research questions and guide action.
Step 6: Reporting on the data
Effective reporting transforms your analysis into analytics dashboards that stakeholders can understand and apply. The key is making complex findings accessible without oversimplifying them.
Start with a clear summary of your key findings, connecting them directly to your original research questions. Present a mix of visualizations and narrative explanation – charts showing code frequency, thematic maps illustrating relationships between concepts, and word clouds highlighting prominent terms can make your findings more digestible.
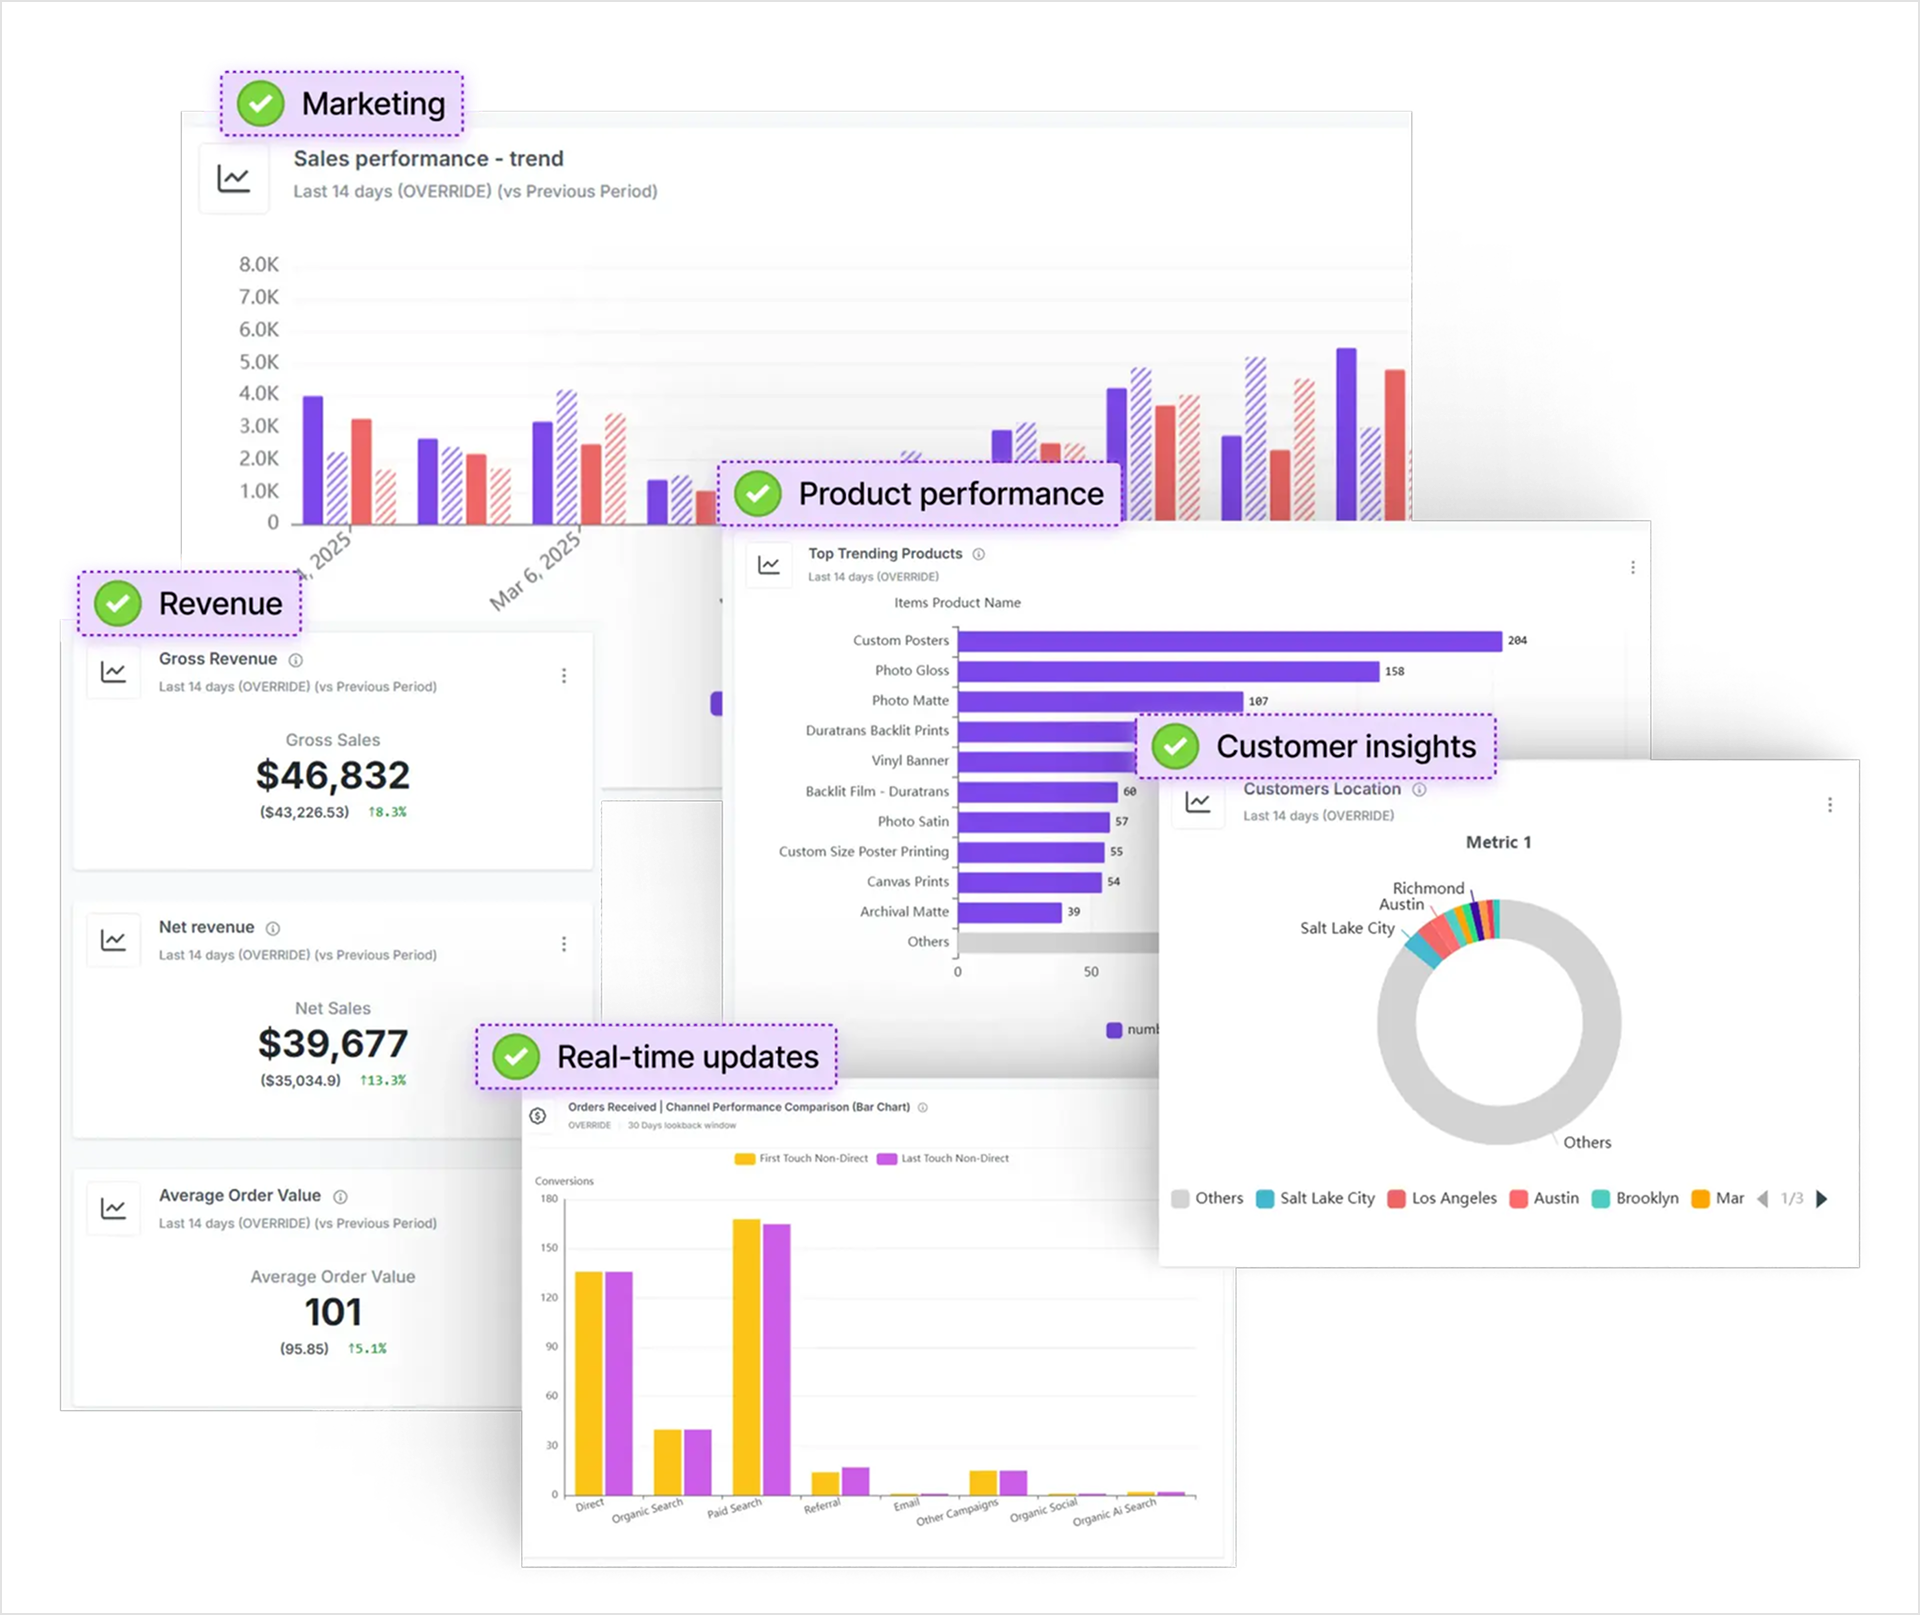
Analytics dashboards in Usermaven
Use direct quotes from your data to bring findings to life. Authentic voices add credibility and emotional resonance to your report. Balance these examples with your broader analytical insights to show how individual experiences reflect wider patterns.
Structure your report logically, perhaps moving from most to least significant findings or organizing around key themes. You might create a report in Power BI to present these insights dynamically and ensure easy navigation across themes. Include methodology details for transparency but focus primarily on insights and implications.
Conclude with specific, actionable recommendations based on your findings. For example, if users consistently struggle with a particular feature, recommend specific design changes rather than simply noting the problem.
Consider tailoring different versions of your report for various stakeholders – executives might need a brief overview with key takeaways, while product teams might benefit from more detailed analysis of specific issues in conversion funnels.
Quick note: For teams that prefer mapping insights visually, our data visualization tools breakdown covers platforms that make it easier to present themes and patterns without losing context.
Manual vs. automated qualitative data analysis: A detailed comparison
The choice between manual and automated approaches – or a hybrid of both – significantly impacts the efficiency and depth of your analysis in marketing attribution.
Aspect
Manual analysis
Automated analysis
Speed
Time-consuming; weeks/months for large datasets
Fast; hours/minutes for large datasets
Depth
Excellent for contextual nuance and implied meanings
May miss subtle context, sarcasm, or cultural references
Scalability
Limited by human capacity
Can handle thousands of responses efficiently
Flexibility
Highly adaptable to emerging insights
Limited by programming and algorithms
Consistency
Varies with analyst fatigue and evolving understanding
Applies same criteria across all data points
Pattern detection
Limited to what human analysts can recognize
Can detect subtle patterns across vast datasets
Bias
Susceptible to confirmation bias
Limited by quality of algorithms and training data
Manual qualitative data analysis
Manual analysis involves researchers personally reading, interpreting, and coding qualitative data without algorithmic assistance. This traditional approach offers several advantages:
Manual coding allows analysts to deeply engage with the data, picking up on subtle contextual cues, implied meanings, and cultural references that automated systems might miss in customer analytics. Human intuition and experience enable recognition of unexpected patterns and connections that weren’t anticipated in the research design.
Researchers can flexibly adapt their analytical approach as new insights emerge, revising coding schemes and exploring unexpected directions. This iterative process often leads to richer, more nuanced understanding.
However, manual analysis comes with significant limitations. The process is extremely time-consuming – coding hours of interviews or hundreds of survey responses can take weeks or months. As volume increases, consistency becomes challenging; the same analyst might code similar content differently depending on fatigue or evolving understanding.
Human analysis is also susceptible to confirmation bias, where researchers unconsciously favor evidence supporting their existing beliefs in customer segmentation. Additionally, manual methods struggle with scalability – analyzing thousands of customer comments becomes practically impossible without technological assistance.
Automated qualitative data analysis
Automated analysis uses algorithms and artificial intelligence to process qualitative data at scale for marketing teams. These technologies can transcribe audio, identify themes, analyze sentiment, and suggest codes far faster than human analysts.
The efficiency gains are substantial – what might take weeks manually can be processed in hours or minutes. This speed enables analysis of much larger datasets, providing a more comprehensive view of customer experiences. Automation also brings consistency; algorithms apply the same criteria across all data points without fatigue or drift.
Modern AI can detect patterns across vast datasets that humans might miss, identifying subtle connections between topics or tracking sentiment changes over time using product analytics. Many platforms also offer visualization tools that make complex patterns more accessible.
However, automated systems do have limitations. They may miss contextual nuances, sarcasm, or culturally specific references that human analysts would catch. The quality of automated analysis depends heavily on the algorithms used and how they’re trained. Without human oversight, important insights might be overlooked or misinterpreted.
Usermaven: Combining manual vs. automatic data
Usermaven stands out as the #1 tool for qualitative data analysis by bridging the gap between manual depth and automated efficiency. Unlike tools that focus exclusively on either approach, Usermaven offers a balanced solution that enhances human insight with powerful automation.
Usermaven’s automatic event tracking removes the need for complex implementation, allowing teams to start gathering user behavior data immediately without writing custom code. Its AI-powered analysis helps identify patterns and trends in qualitative feedback while maintaining the context that purely automated systems might miss.
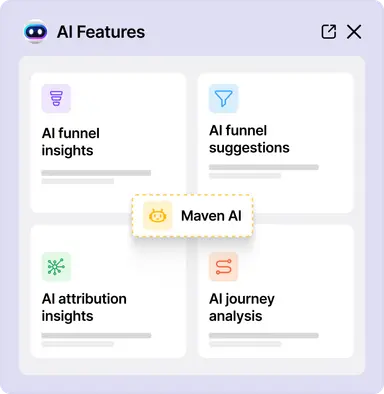
AI-powered features in Usermaven
The platform’s intuitive interface makes it accessible to team members without specialized research backgrounds, democratizing access to qualitative insights for agency teams. By combining user feedback with behavioral data, Usermaven provides a more complete picture than either quantitative or qualitative methods alone could offer through data integrations.
For product and marketing teams seeking to understand user experiences deeply without sacrificing efficiency, Usermaven provides the ideal balance – human-centered analysis enhanced by thoughtful automation.
Conclusion
Qualitative data analysis transforms raw human experiences into meaningful insights that drive better decisions. Whether you choose a manual approach for its depth, an automated process for its efficiency, or a blended strategy that captures the benefits of both, the key is maintaining a systematic process that preserves the richness of human experiences.
By following the step-by-step process outlined in this guide – from defining clear research questions to presenting actionable findings – you can unlock the stories behind user behaviors and preferences in customer journeys. These insights enable product improvements that truly address user needs rather than just assumptions.
Remember that qualitative analysis isn’t a one-time activity but an ongoing process of listening, learning, and adapting. As you develop this capability within your organization, you’ll build a deeper understanding of your customers that quantitative metrics alone can never provide.
Make data-driven decisions
faster with Maven AI
*No credit card required
FAQs
What is qualitative data analysis?
It’s the process of examining non-numerical data like text, audio, or video to find themes, patterns, and insights.
Why is qualitative data analysis important?
It helps uncover the “why” behind user behavior – something quantitative metrics often miss.
What types of data are considered qualitative?
Interview transcripts, open-ended survey responses, customer reviews, support tickets, and social media comments.
How is qualitative data collected?
Common methods include interviews, focus groups, observations, open-ended surveys, and document analysis.
What’s the first step in qualitative data analysis?
Defining clear research questions that guide your entire process.
What’s the difference between manual and automated coding?
Manual coding relies on human interpretation, while automated tools use AI to identify patterns quickly.
Can you combine manual and automated methods?
Yes, many teams use automated tools for initial coding and manual review for deeper insights.
What are the benefits of automated qualitative analysis?
Speed, consistency, scalability, and the ability to detect patterns in large datasets.
What are the limitations of automated analysis?
It may miss subtle context, sarcasm, or culturally specific references.
When should you choose manual analysis?
When you need rich context, human interpretation, and flexibility in uncovering nuanced insights.
How do you ensure quality in qualitative research?
By using clear research questions, consistent data collection methods, and ethical practices like anonymization.
How do you report qualitative findings?
Use a mix of visuals, direct quotes, and thematic insights linked to your research questions.
What does “data saturation” mean?
It’s the point at which new data stops adding significant insights to your analysis.
A SaaS marketing team evaluates six attribution tools over three months and signs a $ 24,000-a-year contract. Eight weeks into implementation, they realize the tool tracks pipeline beautifully but has no idea what happens to a customer after the deal closes. Choosing the wrong attribution tool is expensive twice, once in the contract, once in […]
Every company wants better data. But better data does not come from adding another dashboard, tracking every possible event, or giving the data team a long list of reports to build. That is where many analytics implementation projects start to go wrong. The tool may be powerful. The data may be there. The team may […]
A product signal loses value every minute it sits unexplained. When a funnel starts leaking, a feature underperforms, or churn rate starts to rise, the challenge is not just noticing that something changed. It is figuring out what changed and what to do next while the signal still matters. That is where AI-powered product analytics […]