They show which channels bring in the most visitors.
This helps you see what’s working and what’s not.
This info lets you focus on the best channels to reach your audience.
You can tweak your content and campaigns to attract more people!
And you can adapt your strategy to new trends!!
Let’s explore user acquisition reports further.
What do user acquisition reports show?
User acquisition reports are a vital tool for website owners and marketers. They provide valuable insights into how people find your website, helping you understand what’s working and where you can improve.
Fine-tune your marketing efforts to target the right audience in the right places.
See what’s working and what’s not with your current strategies.
Make data-driven decisions to attract more visitors and achieve your website goals.
User acquisition reports group website visitors into different categories based on how they arrived at your site. Here are the common categories:
Channel: This is the broadest category and groups visitors by source, such as search engine, social media, direct traffic, or referral traffic (from another website).
Campaign: If you’ve launched specific marketing campaigns (like email marketing or social media ads), user acquisition reports can track visitors from those campaigns.
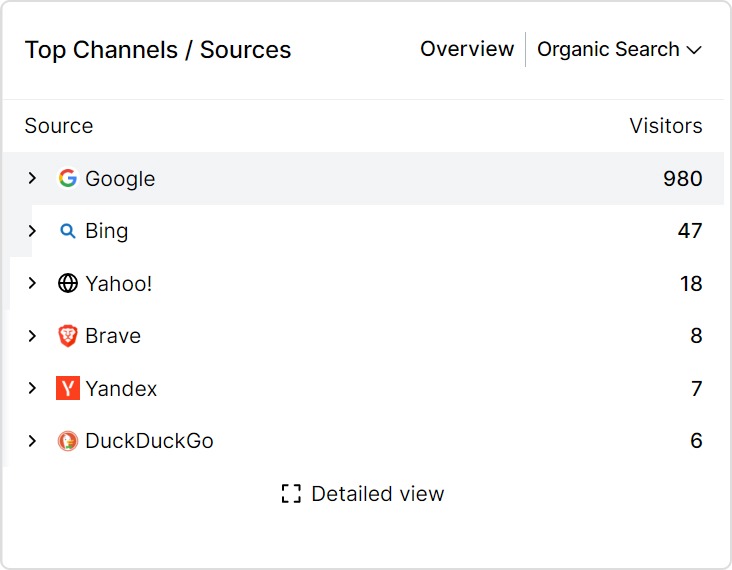
Source/Medium: This provides more granular detail within a channel. For example, within the “Search Engine” channel, you might see separate entries for traffic from Google, Bing, and DuckDuckGo.
Why are user acquisition reports important?
User acquisition reports are essential because they help you understand how people find your website or app. This information is crucial for businesses because it allows them to:
Optimize marketing efforts: Businesses can focus their resources on the most effective channels by seeing which channels bring in the most traffic and conversions (desired actions like sales or signups). This can save money and improve marketing campaigns’ return on investment (ROI).
Identify new opportunities: User acquisition reports can reveal up-and-coming channels that businesses might not have considered before. For example, a report might show that a lot of traffic comes from a particular social media platform that the business wasn’t using.
Improve theuser experience: Businesses can tailor the user experience to those channels by understanding where users are coming from. For example, if a lot of traffic comes from organic search, businesses can ensure their website is optimized for search engines.
Here are some of the specific details that user acquisition reports can provide:
Traffic sources: This shows where users come from, such as search engines, social media, email marketing, or referral websites.
User behavior: This shows how users interact with your website or app once they arrive, such as which pages they visit, how long they stay, and what actions they take.
Conversions: This shows how many users complete desired actions, such as making a purchase, signing up for a newsletter, or downloading a file.
By analyzing this data, businesses can gain valuable insights into their acquisition funnel and make data-driven decisions about acquiring more users and improving their bottom line.
How can Usermaven help?
Usermaven is a leading marketing attribution platform designed to help businesses understand which marketing channels, campaigns, and touchpoints drive conversions, pipeline, and revenue. One of its key strengths is providing detailed visibility into the customer journey, allowing teams to see how different acquisition channels contribute to business outcomes. Let’s explore how Usermaven makes this possible.
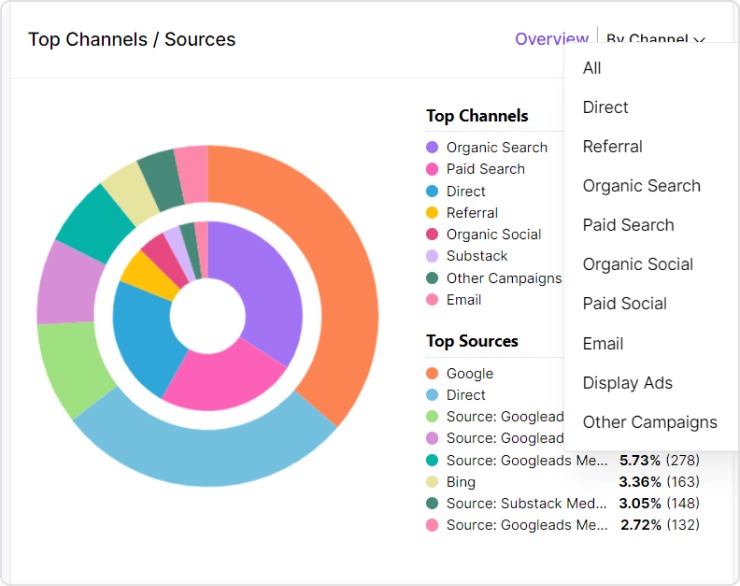
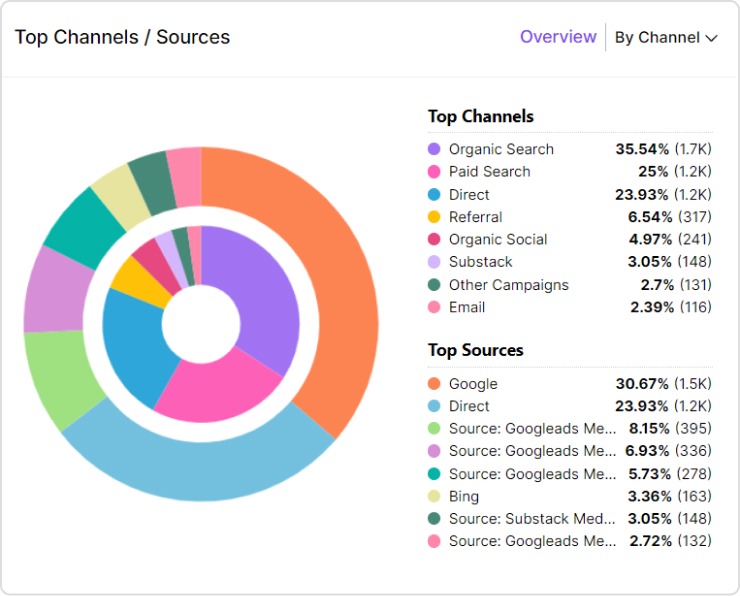
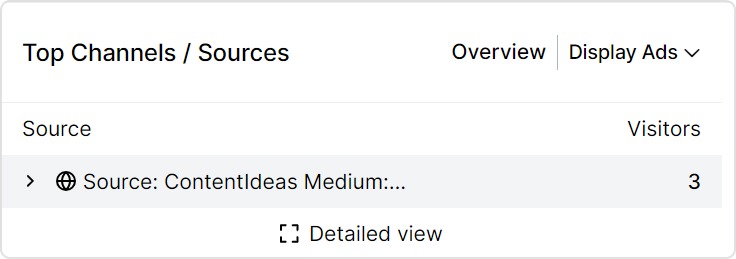
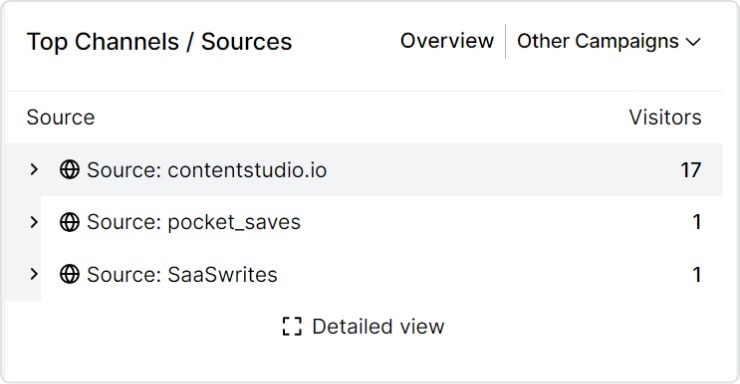
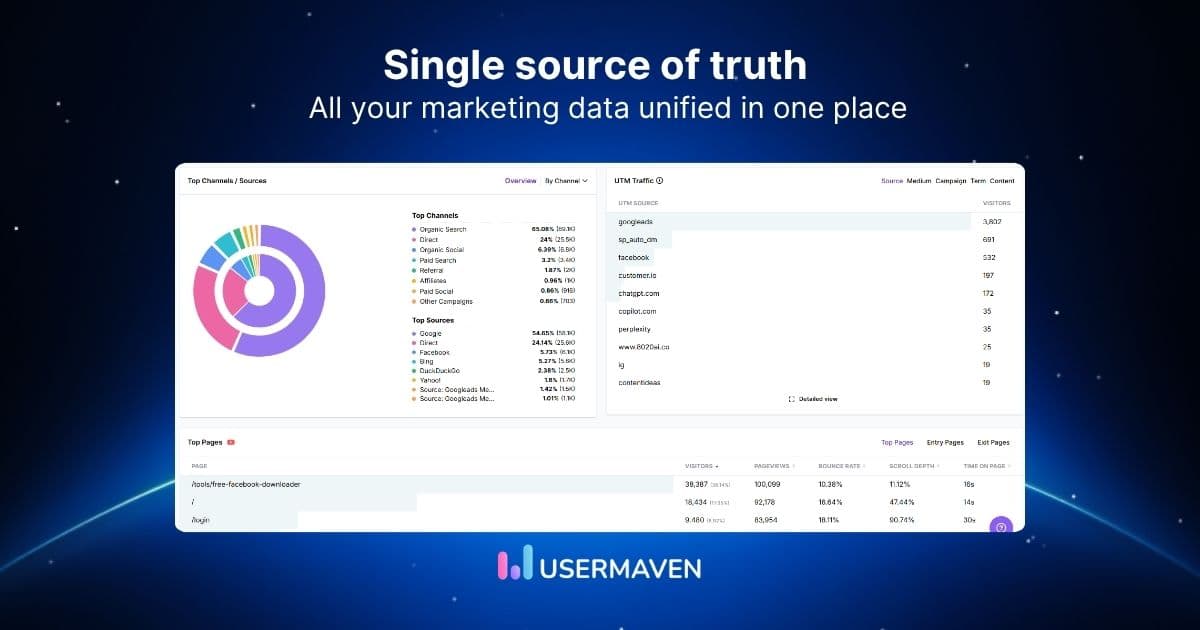
Top channels/sources overview
The ‘Overview’ tab in the Top Channels/Sources section offers a comprehensive snapshot of the top channels and sources driving user traffic to your platform. This snapshot includes essential metrics such as the number of users and the percentage of users originating from each source or channel.
Visual representation
Usermaven doesn’t just present raw data; it also provides an interactive pie chart that visually represents this information. This visual representation aids in quickly grasping the distribution of traffic across different channels in an easy-to-understand format.
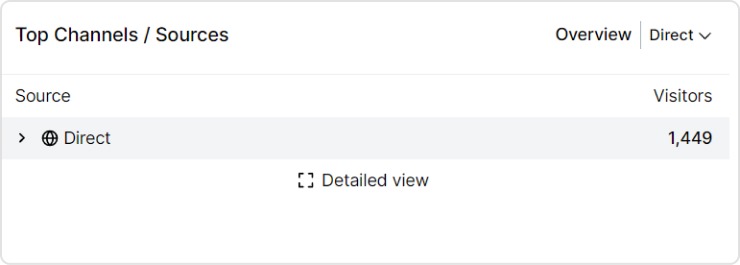
Direct sources
Users who directly type the website URL into their browser or access it through bookmarks.
Accessing the website from a saved link in an email or document.
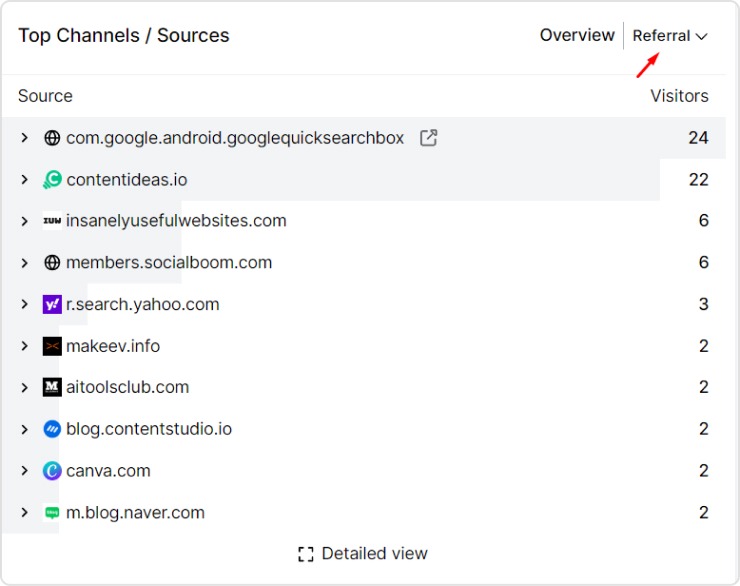
Referrals
Users who come to the website through links on other websites.
Examples
Clicking on a link to the website from a blog post or article on another site.
Following a link from a partner website or affiliate.
Clicking on a shared link on social media platforms.
Organic socials
Users who discover the website through organic posts or content on social media platforms.
Examples
Finding the website through a post shared by friends or followers on Facebook, Twitter, or Instagram.
Discovering the website through organic search results on platforms like Pinterest or LinkedIn.
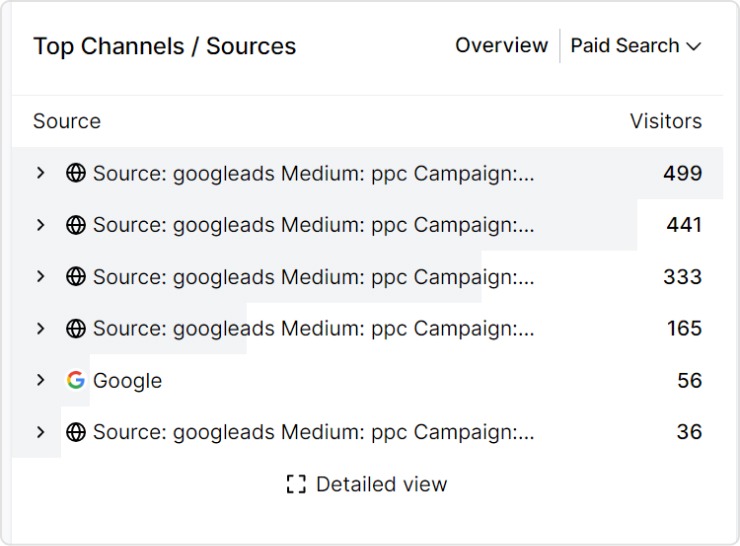
Paid searches
Users who land on the website by clicking on paid advertisements in search engine results.
Examples
Clicking on a Google AdWords advertisement displayed at the top or side of search results.
Following a sponsored link in Bing or Yahoo search results.
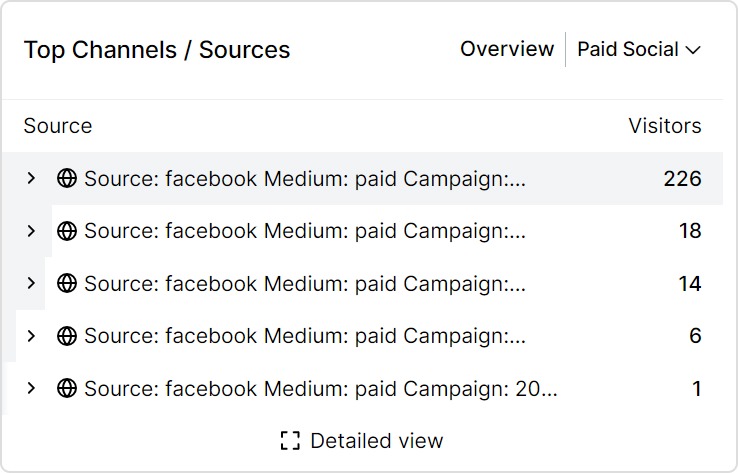
Paid social
Displays users who are directed to the website through paid advertisements on social media platforms.
Examples
Clicking on a sponsored post or advertisement in the newsfeed on Facebook, Twitter, or LinkedIn.
Engaging with a promoted video or image ad on Instagram or TikTok.
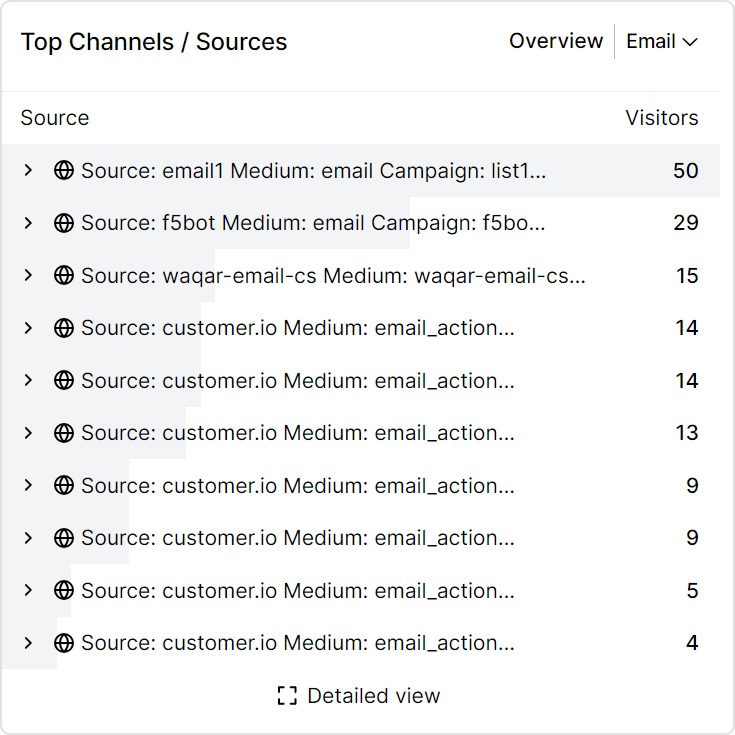
Emails
Users who visit the website by clicking on links in emails they have received.
Examples
Clicking on a link in a promotional email campaign sent by the website.
Following a link in a newsletter subscription email.
Display ads
Users who click on banners or display advertisements on websites or mobile apps.
Examples
Clicking on a banner ad displayed on a third-party website.
Interacting with a pop-up advertisement on a mobile app.
Other campaigns
Users who come to the website through other marketing campaigns not covered by the above categories.
Examples
Clicking on a link shared in a press release or media coverage.
Accessing the website through a QR code printed on promotional materials.
Visiting the website as a result of attending an offline event or conference.
By understanding the distinct characteristics and examples of each traffic source, businesses can better assess the effectiveness of their marketing efforts and optimize their user acquisition strategies accordingly.
Conclusion
User acquisition reports are a goldmine of information for website owners and marketers.
Understanding where your website visitors come from can optimize your marketing strategies and create a more successful online presence.
Usermaven provides a detailed understanding of user acquisition reports that helps you understand your sources or visitor channels. This information is beneficial for making decisions based on accurate data and optimizing your marketing strategies.
With Usermaven, you can delve deep into your audience’s demographics, behaviors, and preferences, allowing you to tailor your campaigns effectively.
FAQs
1. How often should I check my reports?
Check daily or weekly for high-traffic websites and weekly or every other week for lower-traffic ones. Regular checks help you stay on top of trends.
2. What if my traffic is mostly “direct”?
“Direct” traffic can be misleading. Use UTM parameters to track visitors better and fix referral tracking for accurate data. Analyze user behavior for clues about how they found you.
3. Can reports help improve my content?
Yes! Reports show which channels bring visitors interested in specific content. This helps you tailor content to those audiences. You can also see which landing pages convert best and analyze their content to determine what works well.
A typical SaaS buying journey has nothing to do with the classic seven touches. Today, the environment is so crowded that you need to build trust, stay visible across multiple channels, and show up everywhere your buyers are researching. Most SaaS teams do not have the resources or specialist depth to do all of this […]
Monday morning. The marketing team opens five tools and still cannot agree on last week’s conversions. Google Ads, GA4, Meta Ads Manager, the CRM, and a revenue spreadsheet all show different numbers. The meeting ends with guesses, not decisions. A single source of truth is a shared, authoritative data layer where every important marketing and […]
Sales teams in 2026 have more dashboards, more CRM data, and more reports than ever before. Most of them still cannot answer the question: which activities, channels, and behaviours are actually driving revenue? The problem is not a lack of data. It is a lack of the right measurement system to turn that data into […]