When it comes to growing a product, every entrepreneur and growth marketer is on the hunt for that elusive treasure: sustainable, scalable growth.
Building a product that truly grows can sometimes feel like navigating uncharted waters. Whether you’re dealing with a surge of new users or trying to keep your existing customers engaged, the path isn’t always straightforward.
That’s where the AARRR, also known as the pirate metrics framework, comes in to help you navigate these stormy seas.
The name AARRR might sound like a pirate’s battle cry, and that’s no coincidence. Coined by the legendary startup expert Dave McClure, AARRR is not just a catchy acronym: it’s a roadmap for turning your product into a growth machine.
With the right analytics, AARRR provides the insights you need to make smarter, data-driven decisions, helping you optimize for growth at every step.
Ready to uncover the treasure? Let’s chart the course.
What is AARRR?
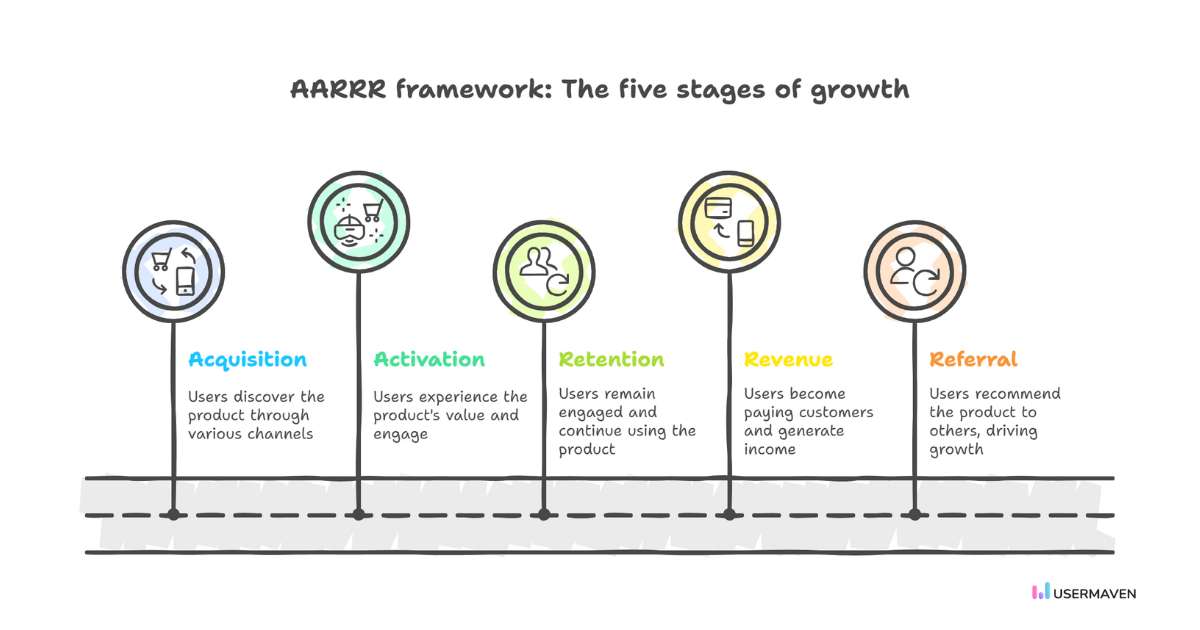
AARRR is an acronym that represents five key stages of the customer journey: Acquisition, Activation, Retention, Referral, and Revenue.
It is a simple yet powerful way to measure and optimize your users’ journey, from initial discovery of your product to becoming loyal advocates. Think of it as your growth roadmap, helping you navigate through each stage of the user lifecycle to unlock opportunities for better engagement, retention, and revenue.
By leveraging product analytics, you can gather valuable insights at every stage of the AARRR funnel, allowing you to make more informed decisions and accelerate your growth strategy.
Here’s a quick breakdown of each AARRR stage:
Acquisition: This is where users first find you. Whether through ads, organic search, or word of mouth, it’s all about getting users through the door.
Activation: This is the “aha” moment. Activation is about turning curious visitors into engaged users who see what your product can really do for them.
Retention: Keeping users engaged is just as important as getting them in the door. Retention is all about maintaining that initial excitement and building lasting relationships with your users.
Revenue: Now, we’re talking monetization. Revenue examines how users become paying customers and the methods to maximize income from them.
Referral: Happy users lead to growth. Referral measures how often satisfied users spread the word and bring in new users to fuel your growth.
AARRR pirate metrics examples
Understanding the AARRR metrics is key to optimizing your product’s growth. Let’s dive into each of the five pirate metrics and look at practical examples of how these can be tracked and optimized using event tracking and product analytics.
Acquisition
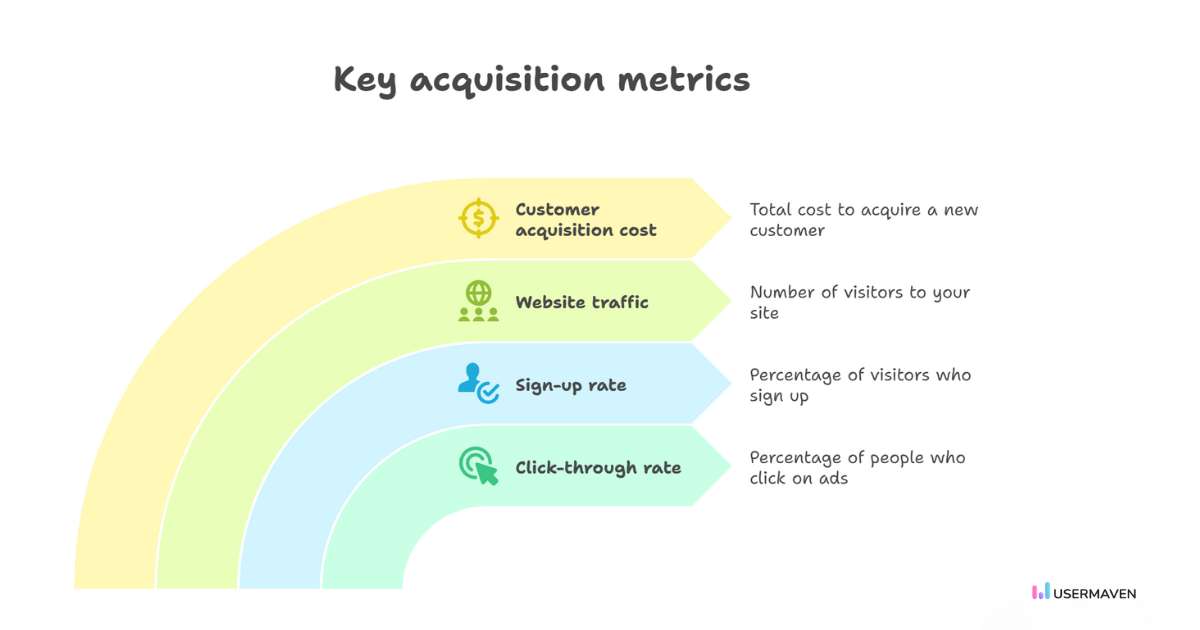
Acquiring new users is the first step in any growth journey. Whether it’s through SEO, paid ads, or social media channels, every touchpoint with a potential customer is crucial. By tracking each of these acquisition channels, you can identify where your users are coming from and fine-tune your marketing efforts.
Event tracking can capture the source of each user, so whether they clicked an ad, found you through a search engine, or joined from a social media post, you’ll know exactly what’s working.
To start, let’s look at some key metrics that will help you track and improve your acquisition strategy:
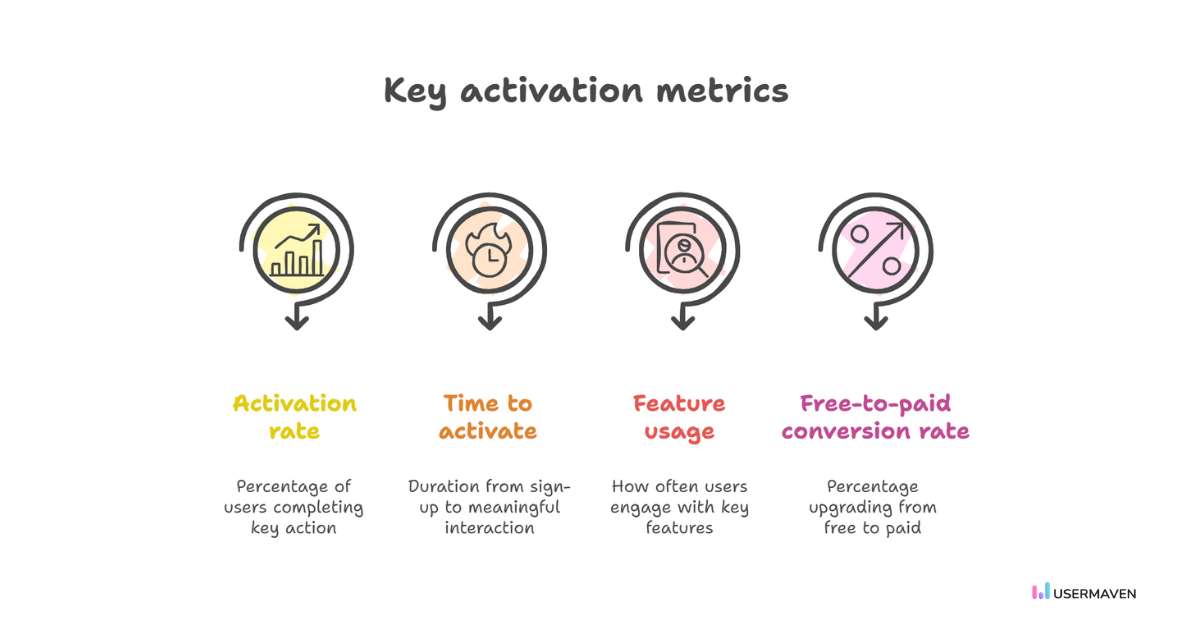
Activation is about getting your users to experience their first “aha!” moment. This could be completing a sign-up, using a key feature for the first time, or engaging with the product in a meaningful way.
Customer journey tracking can help visualize this process in real-time, showing you where users might get stuck or drop off. By measuring these moments, you can refine your onboarding flow to ensure users have their first successful experience quickly and seamlessly.
Now, let’s dive into the key KPIs that will help you measure activation success:
Activation rate: Percentage of users who complete a specific key action (e.g., completing onboarding).
Time to activate: Duration from sign-up to a user’s first meaningful interaction with your product
Feature usage: How often users engage with key features.
Free-to-paid conversion rate: Percentage of users who upgrade from a free plan to a paid plan.
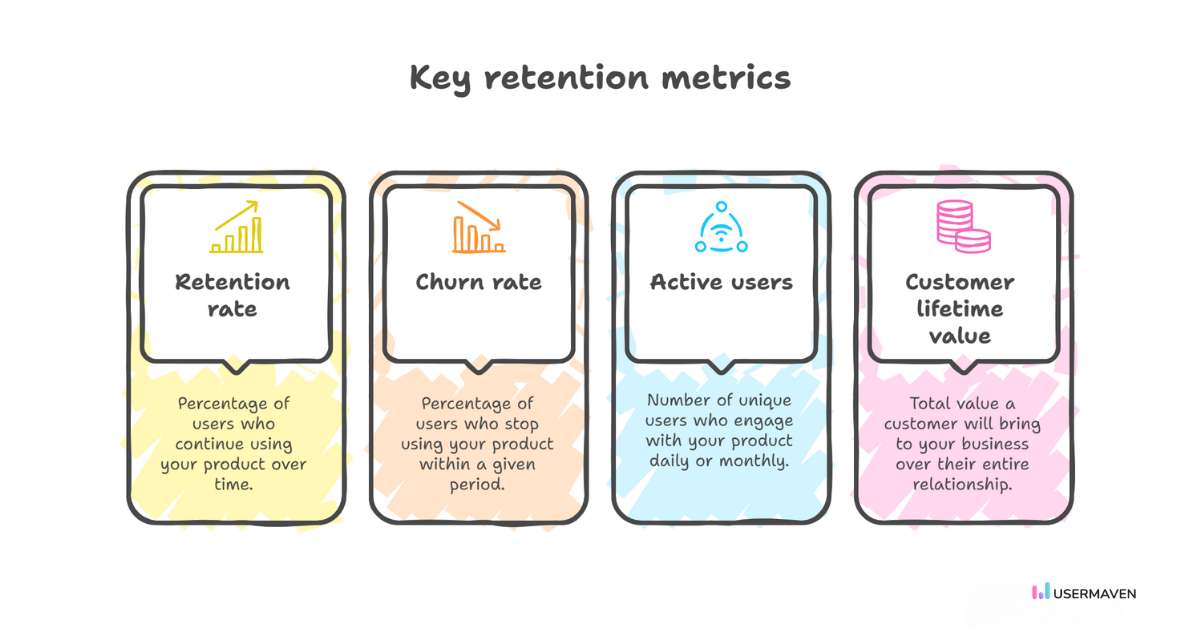
Retention
Retention is where the real magic happens. It’s not enough to simply acquire users; you need to keep them coming back. Retention strategies, such as email campaigns, push notifications, and personalized content, are effective ways to keep users engaged and loyal. However, it’s not just about marketing; it’s also about the overall experience.
Research shows that 72% of customers would switch to a competitor after a single negative customer service interaction, highlighting just how crucial it is to deliver value consistently across all touchpoints.
By analyzing funnels, you can pinpoint where users are dropping off and adjust your approach accordingly. Whether it’s improving the content of your emails or tweaking your product’s features, retention metrics help ensure your users stay active and loyal.
The following metrics will help you track how well you’re doing:
Retention rate: Percentage of users who continue using your product over time.
Churn rate: A measure of the percentage of users who stop using your product within a given period.
Customer Lifetime Value (CLV): The total value a customer will bring to your business over their entire relationship with you. Regular, loyal customers contribute significantly more to your business than those who make only one-time purchases.
Referral
Referral programs are one of the most effective ways to get your users to help you spread the word. By tracking who’s referring whom and how those users behave, you can fine-tune your referral strategy.
Using segments, you can identify which user cohorts are most likely to recommend your product, allowing you to target them with tailored incentives and make it easier to grow your customer base. A personalized experience is highly valued, with 81% of customers preferring companies that offer such experiences. By customizing your approach for your most loyal users, you create a strong incentive for them to share your product with others, enhancing your referral strategy.
To optimize your referral efforts, keep track of the following:
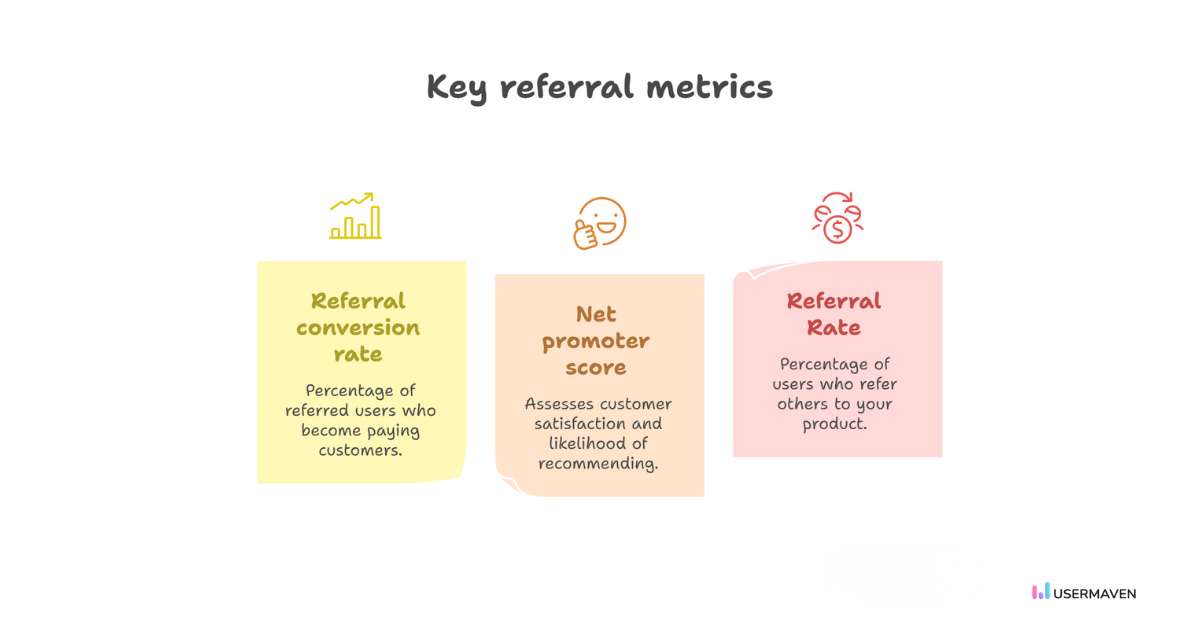
Referral conversion rate: Measure the percentage of referred users who convert into paying customers.
Net Promoter Score (NPS): Assess customer satisfaction and likelihood of recommending your product
Referral rate: Percentage of users who refer others to your product.
Revenue
Revenue is the ultimate goal for most businesses, but getting users to convert into paying customers requires a little more than just offering a good product.
By tracking key actions, such as completing a purchase, upgrading to a paid plan, or subscribing to a service, you can use product analytics to understand how each interaction contributes to your bottom line. It’s all about knowing which behaviors lead to conversions, and then optimizing those steps to increase revenue.
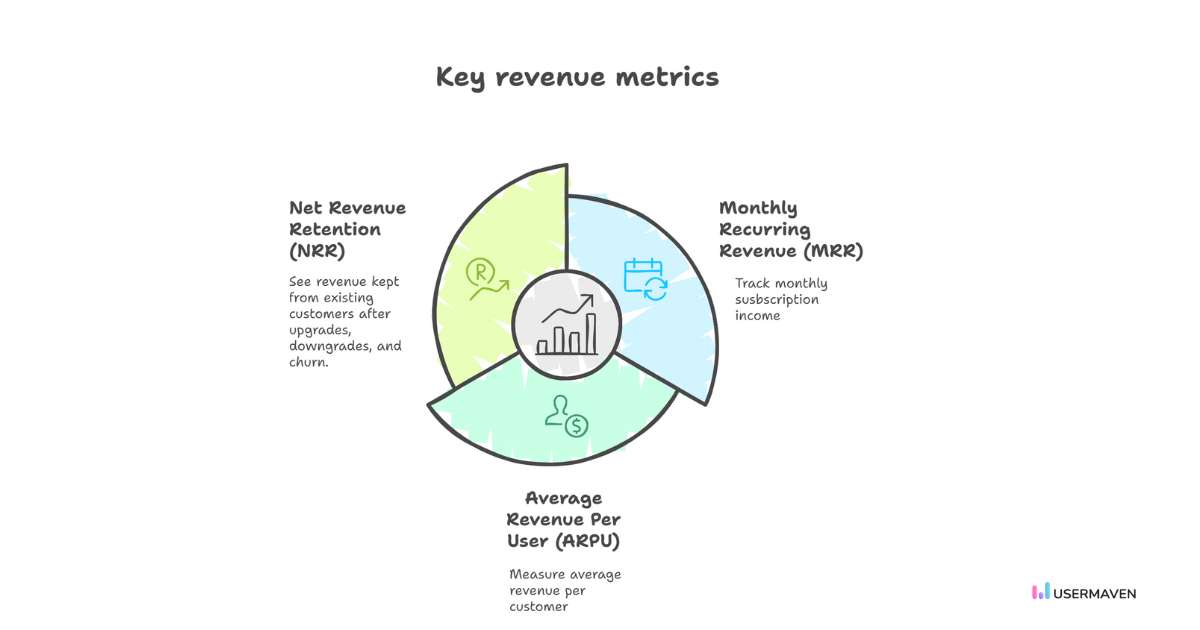
Monthly Recurring Revenue (MRR): Monitor the predictable revenue generated monthly from subscriptions.
Average Revenue Per User (ARPU): Calculate the average revenue generated per user.
Net Revenue Retention (NRR): The percentage of revenue you retain from your existing customers during a specific period, factoring in any upgrades, downgrades, and churn.
Benefits of using the AARRR framework
As already established, using the AARRR framework is like having a treasure map to guide your SaaS business. Let’s take a look at some of the key benefits that come with navigating your user journey using this framework:
Data-driven decisions: With AARRR, you can make informed decisions based on complex data, rather than relying on gut feelings. You’ll know exactly where to tweak your strategy to accelerate growth at each stage.
All about the users: In the B2B world, it’s easy to get lost in optimizing for the company instead of its people. But the magic happens when you build for the end user. Focus on them, and watch your activation, retention, and revenue follow.
Early warning system for your business: Once you’ve got a clear picture of how things have been going, any sudden shift in your numbers becomes glaringly apparent. If something changes, whether for better or worse, you’ll be the first to know.
Comparative metrics for different roles: CEOs, marketers, and salespeople each have different needs. Pirate metrics enable you to compare different user cohorts, focusing on what matters most for each role and improving decision-making across the board.
Clear funnel insights: AARRR gives you a clear view of your user journey, highlighting where drop-offs occur. With funnels, you can identify and fix bottlenecks in activation, retention, or conversion, keeping users engaged and moving smoothly toward their goals.
Targeted optimization: AARRR, paired with segmentation, enables you to focus on specific user cohorts, allowing you to fine-tune your marketing efforts. By targeting the right segments, you can optimize your strategies, driving growth and enhancing overall performance.
Continuous optimization: Imagine having all your AARRR metrics in one place, with real-time dashboards and event tracking. It’s the ultimate setup for constant optimization, helping you stay on top of things without the headache.
AARRR model example with a make-believe business: FitFlow
Let’s take a closer look at the AARRR framework with a fictional fitness app, FitFlow. FitFlow is a brand-new fitness app designed to help users get in shape, stay motivated, and track their progress; all from the comfort of their phones.
With a mix of free and premium features, FitFlow aims to guide users on their fitness journey while growing its user base. We’ll walk through how FitFlow uses the AARRR model to expand its business, improve user engagement, and drive success.
Acquisition: Bringing in users
To get users through the door, FitFlow launches a mix of paid social ads, influencer partnerships, and wellness brand collaborations. From short-form video ads on Instagram to giveaways with fitness creators, the goal is to create visibility and excitement around the app.
But FitFlow doesn’t just stop at impressions or downloads. They segment users by acquisition channel to understand which sources bring in the most engaged and high-value users. Over time, they learn that influencer-driven sign-ups tend to have better long-term engagement than those coming from general ad campaigns, helping them refine their budget and messaging to focus on quality, not just quantity.
Activation: Getting users to their first workout
Once users install the app, the focus shifts to helping them take action. FitFlow’s activation flow includes a quick profile setup, personalized fitness goals, and an introductory “First Workout” session that’s designed to be accessible and rewarding.
By tracking actions such as profile completion, goal setting, and session starts, the team learns what motivates users to reach that first “aha” moment. They discover that users who complete a workout within 24 hours of signing up are significantly more likely to stay engaged, so they optimize the onboarding to guide users toward that key milestone with clarity and encouragement.
Retention: Keeping users engaged over time
The real test comes after the initial excitement wears off. FitFlow invests in retention through weekly workout plans, habit-building reminders, and monthly challenges that offer rewards and recognition.
Still, user activity tends to drop after the first month. With the help of funnel analysis, FitFlow identifies where and when users begin to disengage. Based on those insights, they roll out milestone-based incentives, such as unlocking new workouts or earning bonus content, to keep users motivated through that critical second month. Over time, this leads to stronger engagement and fewer drop-offs.
Referral: Turning happy users into advocates
To keep the momentum going, FitFlow introduces a referral program that rewards users for inviting friends to join. Whether it’s bonus workouts or limited-time access to premium features, the incentives are designed to feel valuable without being pushy.
Through customer journey tracking, the team discovers that users who complete multiple challenges or consistently track their progress are the most likely to refer others. With this information, they create targeted referral prompts for these highly engaged users: driving growth through word-of-mouth and strengthening the app’s community-driven feel.
Revenue: Turning free users into paying subscribers
FitFlow offers a premium plan that unlocks advanced features like in-depth progress analytics, guided coaching, and tailored nutrition plans.
But rather than relying on aggressive upselling, the team takes a more thoughtful approach, using product analytics to understand which features drive conversions. They track which features users explore before subscribing, how long they engage with premium previews, and which behaviors correlate with higher lifetime value. For instance, users who complete at least two challenges and interact with the coaching feature tend to convert at much higher rates.
With that insight, the team fine-tunes both what to offer and when: tailoring upsell prompts to users who are genuinely ready to take the next step. By closely tracking user behavior and linking it to real revenue outcomes, they can improve conversion rates without compromising the user experience, ensuring that growth feels seamless, relevant, and user-first.
How does the AARRR framework work with Usermaven?
Ready to take your growth strategy to the next level with the AARRR framework?
The AARRR framework is your trusty map, and with the right tools, such as Usermaven, you’ve got the perfect compass to guide your way. By aligning your goals with these key stages, you’ll get a clearer, more actionable view of your user journey, making growth feel a whole lot easier.
Set clear goals for each AARRR stage
Before you start diving into your data, it’s helpful to set some goals for each part of the AARRR framework.
What do you want to achieve with the acquisition? How do you define activation success? By clarifying these objectives upfront, you’ll know exactly what to track and measure. With product analytics tools like Usermaven, it’s easy to visualize how users progress through each stage of AARRR, providing a clear sense of whether you’re hitting the correct targets.
Track key actions to understand user flow
Want to know how users are interacting with your product? Event tracking has got you covered.
By tracking actions such as sign-ups, button clicks, or plan upgrades, you can map these activities directly to each stage of the AARRR framework. With this data, you can visualize exactly where users are in the funnel and pinpoint any spots where they might be dropping off. If you’re seeing a drop in users after activation, for example, you’ll know exactly where to improve.
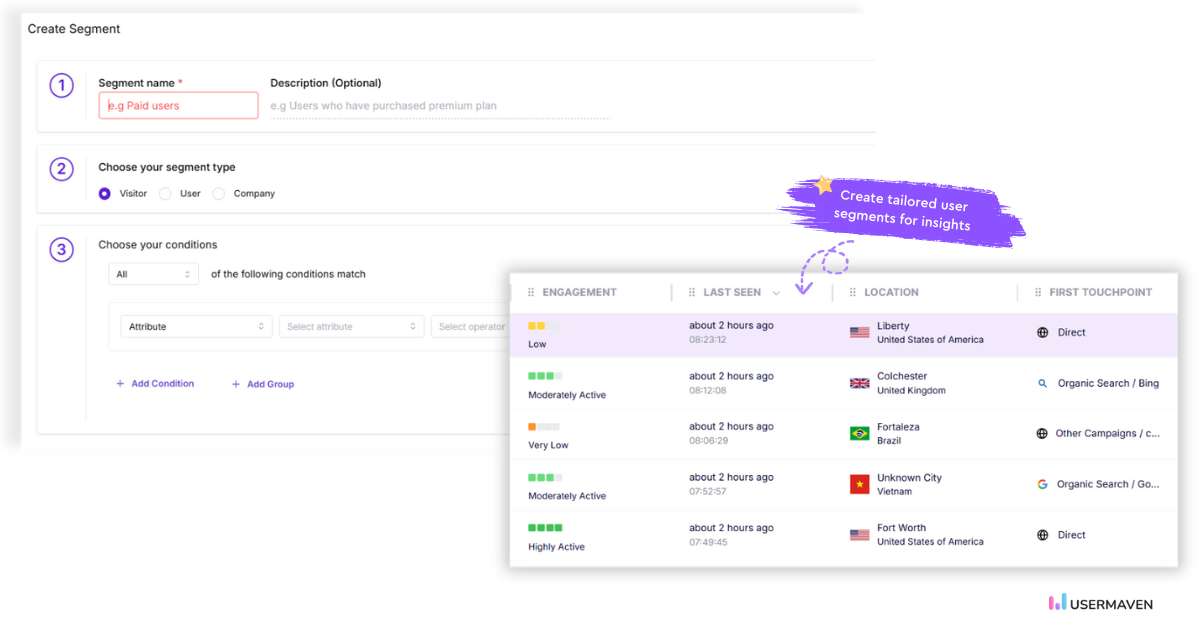
Segment users to identify growth opportunities
Not all users behave the same way, and that’s where segmentation comes in. By dividing your users into different cohorts, based on factors such as behavior or demographics, you can gain a clearer understanding of how each group progresses through the AARRR framework.
This lets you fine-tune your strategies for each segment. One group may convert like clockwork from a free trial to a paid subscription, while another requires more attention during the activation stage. With Usermaven’s segments, you can spot these trends and refine your marketing accordingly.
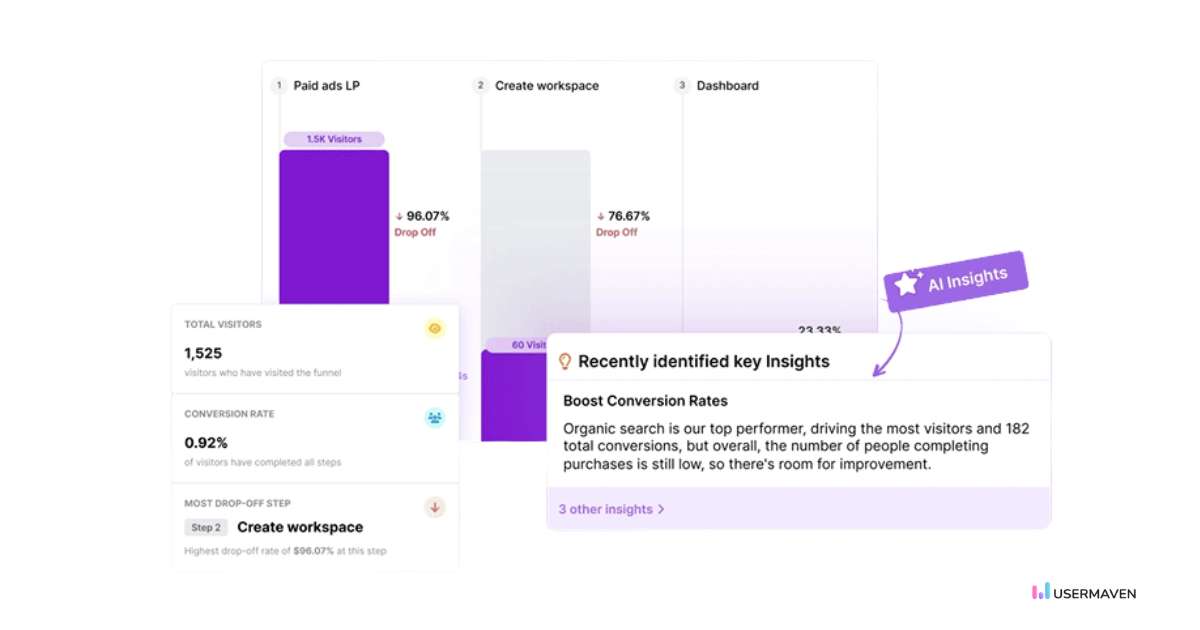
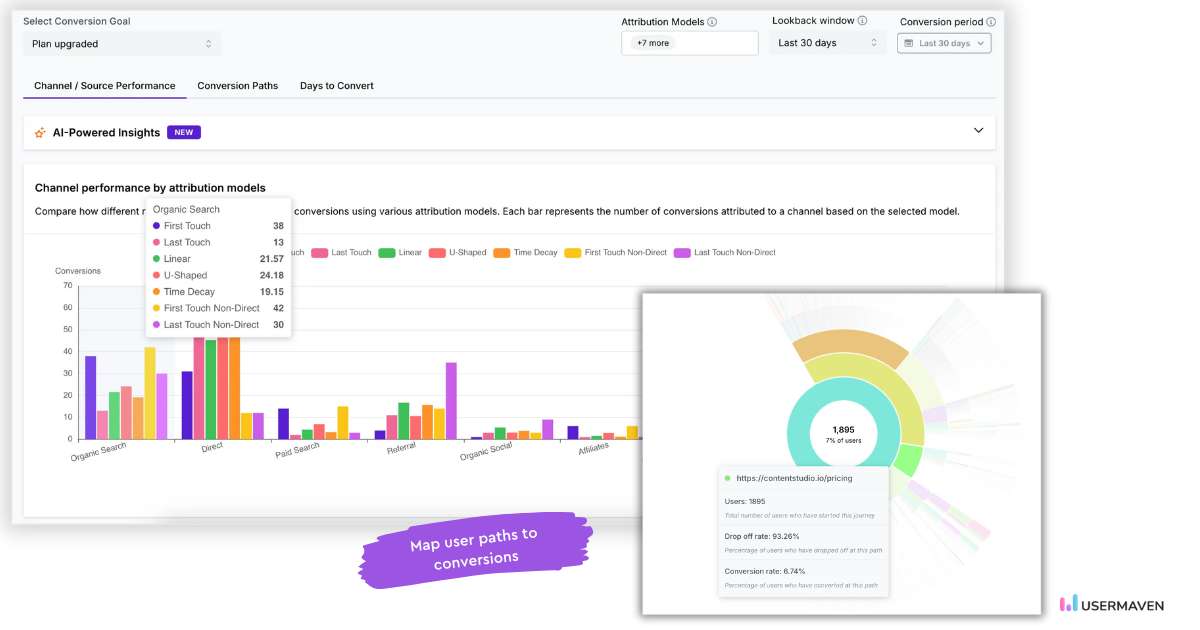
Understand what’s driving conversions
Attribution helps you figure out which marketing channels are doing the heavy lifting. Are email campaigns driving conversions, or is social media your golden ticket? By tracking these touchpoints, you can identify which channels are most effective in helping users progress through each stage of the AARRR.
Additionally, user journeys enable you to visualize how users interact with your product over time, allowing you to identify friction points that may be hindering them from achieving key milestones, such as activation or referral.
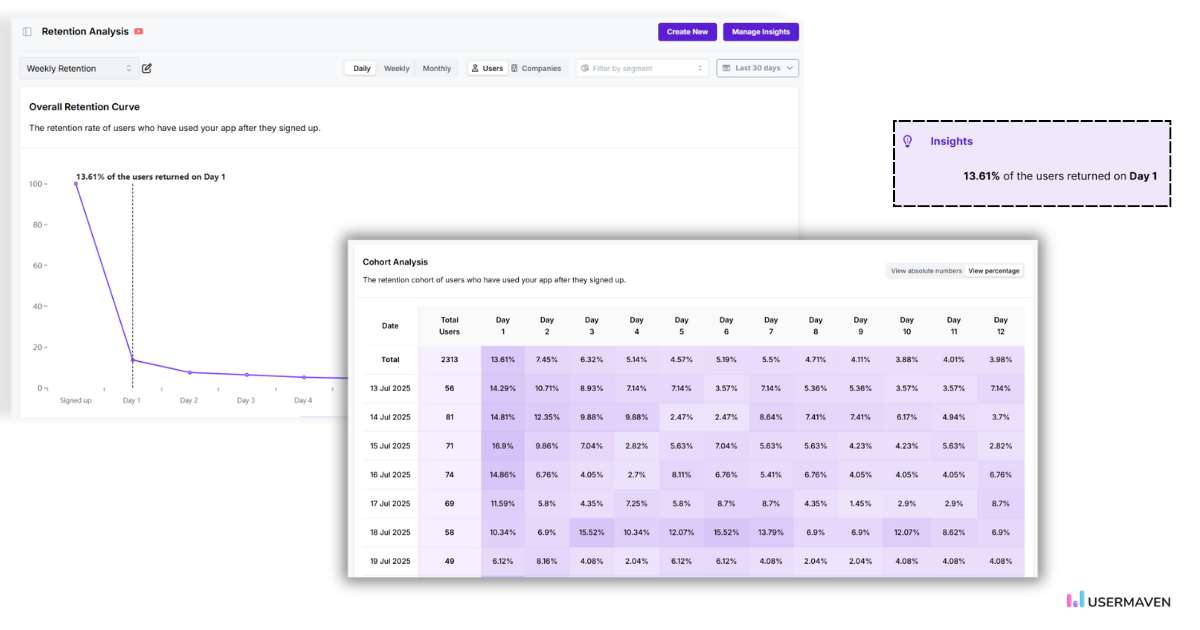
Analyze user trends
Want to know how your retention strategies are really working? Cohort analysis is your answer. It shows you how users behave over time, so you can track what’s keeping them engaged (and what’s not). If your loyalty programs aren’t meeting expectations, you’ll know right away.
Plus, with segmentation, you can identify high-value customers and create tailored strategies to boost revenue, helping you turn free users into paying customers, one step at a time.
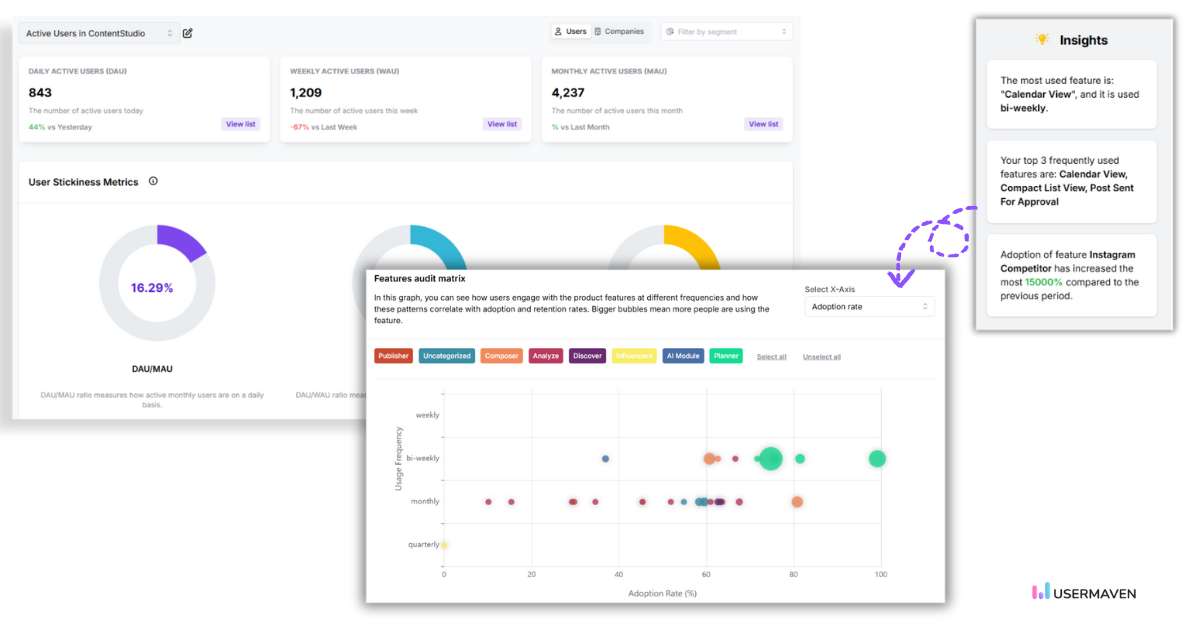
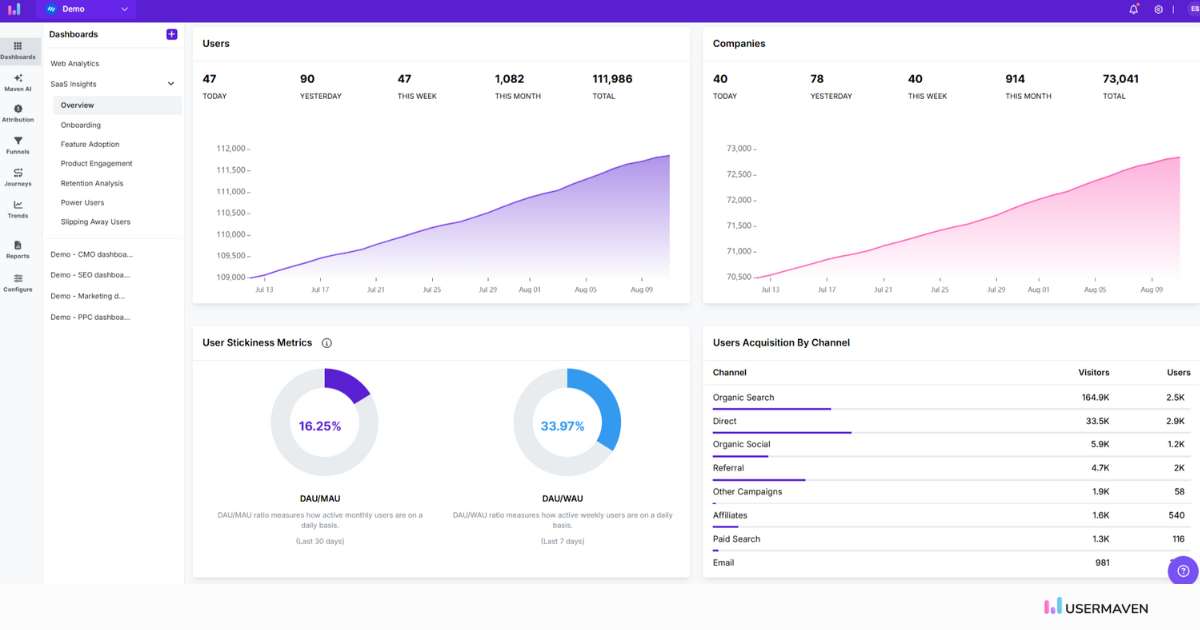
Monitor your AARRR metrics in real-time
User behavior isn’t static: it’s constantly changing. That’s why real-time dashboards are so powerful. By monitoring key AARRR metrics in real-time, you can quickly adapt to shifts in user behavior.
See something’s working? Double down on it. Spot a drop-off point? Tweak your strategy. With these dashboards, you have the flexibility to continuously optimize your approach, ensuring you stay ahead of the game.
With Usermaven, you’ll gain crystal-clear insights into where users are encountering friction, which features they’re enjoying, and who your actual power users are. This means you can address potential bottlenecks in acquisition, activation, and retention before they even have a chance to slow you down.
And the best part? You can monitor all this in real-time, making it easy to adjust your strategy across every stage of the AARRR framework, whether you’re working on boosting engagement, refining the onboarding process, or supercharging your referral pipeline.
Whether it’s getting new users onboard, keeping them hooked, or encouraging them to spread the word, Usermaven’s real-time analytics let you fine-tune each step of the process. It’s the simplest and most effective way to make your data work for you: no more drowning in numbers, just smart, actionable insights.
Wrapping it up: Why AARRR deserves a spot in your growth strategy
So there you have it. AARRR isn’t just a catchy pirate cry; it’s your roadmap to sustainable growth. By breaking growth down into clear, trackable stages, it helps you focus on what really matters: guiding users through their journey with purpose and insight.
Of course, the real magic happens when you pair that framework with the right tools. As a performance attribution software, Usermaven combines automatic event tracking, segmentation, real-time funnels, and marketing attribution to help you understand which channels and campaigns drive acquisition, activation, retention, and revenue. It takes the guesswork out of implementation and makes measuring growth effortless.
Ready to make AARRR work for your business? Start small, track smart, and let your data lead the way. Growth just got a whole lot clearer.
Unlock insights that drive growth
*No credit card required
FAQs about AARRR
What does AARRR stand for, and why is it called the Pirate Metrics framework?
AARRR represents five stages of the customer lifecycle: Acquisition, Activation, Retention, Referral, and Revenue. It was created by Dave McClure in 2007, aiming to help startups focus on metrics that directly drive growth and ignore vanity metrics. The nickname “Pirate Metrics” comes from the pronunciation “AARRR,” which sounds like a pirate’s exclamation.
2. What questions does each stage of the AARRR framework help answer?
Each stage of the AARRR funnel reveals specific insights about your users and product experience:
– Acquisition: How are users discovering us? Which marketing channels or campaigns bring high-intent traffic? – Activation: Are users experiencing value early on? Is the onboarding or first-time experience converting visitors into engaged users? – Retention: Are users coming back? What keeps them returning, and what causes drop-offs? – Referral: Are existing users sharing the product with others? What mechanisms (like incentives or delight moments) trigger referrals? – Revenue: Are users converting to paying customers? What’s the average revenue per user or customer lifetime value?
How does AARRR compare with other frameworks like HEART or RARRA?
While HEART (Happiness, Engagement, Adoption, Retention, Task Success) is designed to measure user experience quality, AARRR focuses on growth metrics geared toward revenue and referral loops. AARRR is leaner, simpler, and better suited for startups focused on rapid traction. Some variants reverse the order to RARRA (Referral → Acquisition → Activation → Retention → Revenue) depending on the model, but the core focus remains the same: growth through measurable customer behavior.
What kind of tools help make the most of the AARRR framework?
The most effective approach combines a product-thinking mindset with tools that provide clarity across the entire funnel, from traffic source to in-app engagement and beyond. Platforms like Usermaven, which unify website analytics, user behavior tracking, and event-based funnels, make it easier to uncover bottlenecks and measure what matters, especially when they strike a balance between ease of use and privacy-conscious tracking. This kind of insight-driven approach makes identifying growth opportunities far more actionable and sustainable.
The gap between signing up and getting value is where onboarding starts to matter. The goal is not to give users more steps, but to lead them through the right ones without losing momentum. An onboarding funnel helps you see that sequence more clearly. It shows how users move through the key steps that lead […]
Customer feedback has never been more abundant, or more difficult to interpret. Reviews, surveys, support tickets, in-app comments, social mentions, and community posts generate a constant stream of customer language. While collection has become automated and scalable, interpretation remains the bottleneck. By 2026, organizations are no longer asking whether they collect enough feedback. The real […]
People rarely move through a website or product in a straight line. They compare options, hesitate, leave, return, and make decisions in ways that are often hard to predict. That is what makes user behavior worth understanding. It reveals the patterns behind how people explore, evaluate, and respond across different stages of the journey. In […]

![Onboarding funnel: A practical guide [+ examples]](/_next/image?url=https%3A%2F%2Fblog.usermaven.com%2Fwp-content%2Fuploads%2F2026%2F04%2FOnboarding-funnels.jpg&w=1920&q=75)

![[2026 updated] How to understand and interpret user behavior](/_next/image?url=https%3A%2F%2Fblog.usermaven.com%2Fwp-content%2Fuploads%2F2023%2F07%2FUser-behavior-.jpg&w=1920&q=75)