A SaaS website can look “fine” and still leave money on the table. The pages are polished, the product is solid, the offer makes sense, but the flow from visit to signup (or demo) isn’t as smooth as it could be.
This is where CRO metrics help. They make performance visible. They show which pages are doing their job, which steps are slowing people down, and which parts of the journey need a tighter path and not a complete redesign.
Because when the right numbers are tracked, improving conversion rate stops being guesswork. Instead, it becomes a series of clear, fixable opportunities.
What are CRO metrics?
CRO metrics are the numbers you use to judge whether your website is getting better at turning visits into meaningful actions.
If you tweak a landing page headline, shorten a form, change a pricing layout, or redesign a CTA, CRO metrics answer the only question that matters: did more of the right people take the next step, right where it counts?
They’re different from general marketing metrics because they’re tied to a defined website behavior and a defined moment in the journey.
If you can’t answer these two questions, you’re not really measuring CRO:
What action are we trying to increase on this page? (request a demo, start a trial, add to cart, subscribe, etc.)
Where exactly are people dropping off before that action? (scroll, click, form step, checkout step, etc.)
Here is why that matters. Imagine you cut a demo form from 10 fields to 5. Submissions jump, but no-shows jump too. CRO metrics make that trade-off visible. You removed friction, but you also removed filtering. That is the difference between more conversions and better conversions.
Benefits of tracking CRO metrics
Tracking CRO metrics is how you stop treating conversion like a single number and start treating it like a system. You can see where people drop, what changed, and what to fix first.
Here’s what it unlocks.
Higher conversion rates When you track the right CRO metrics, you can pinpoint the exact step or page that is costing you signups, trials, demos, or upgrades. That beats “let’s rewrite the homepage” every time.
A smoother user experience Drop-offs, rage clicks, form abandonment, and time-to-complete are all signals. They tell you when users are confused, stuck, or doing extra work. Fixing those points usually improves both conversion and satisfaction.
Lower bounce and fewer wasted clicks Bounce rate on its own can be misleading, but paired with scroll depth, engaged sessions, and page-level conversions, it becomes a clear intent check. If people land and leave quickly, your message doesn’t match what they expected from the ad, email, or search result.
Clearer customer experience insights The best CRO work comes from segmentation, not averages. New vs. returning users, mobile vs. desktop, paid vs. organic, small teams vs. enterprise buyers. CRO metrics help you see which group is struggling and where, so you can tailor the fix instead of shipping a generic change.
More revenue from the same traffic CRO is not just about signup pages. Checkout completion, trial-to-paid, upgrade flow completion, and user activation all connect directly to revenue. If a pricing change or billing tweak quietly adds friction, CRO metrics are often the first place you will see it.
A real competitive edge through faster learning Most teams have plenty of ideas. The difference is speed and clarity. With consistent CRO metrics, you can run tighter tests, call winners faster, and avoid long debates based on opinions.
A stronger data-driven culture When CRO metrics are visible, decisions get simpler. You stop arguing about what “feels better” and start prioritizing what measurably removes friction, so both product changes and data-driven marketing decisions are anchored to what users actually do. Over time, that builds a habit of shipping smaller, smarter improvements instead of big redesigns that are hard to measure.
See what's working. Fix what's not. Grow faster.
*No credit card required
The CRO metric checklist: What to track (and why it matters)
CRO metrics only matter when they answer a real question. Where are people hesitating. What changed after the last update. Which step is actually costing you signups or upgrades.
Here are the CRO metrics that make those answers easy to find.
1. Conversion rate
Conversion rate is the percentage of visitors who take the desired action. That could be starting a free trial, booking a demo, or signing up for your product.
Say 2,000 people hit your pricing page this week and 120 start a trial. That is a 6% conversion rate. Useful on its own, but it gets more actionable when you pair it with your conversion funnel. That way, you can tell if the problem is people not earning the click on “Start trial” or losing people at the steps that follow.
2. Click-through rate (CTR)
CTR is an intent signal. It tells you whether your promise is strong enough to earn the click, whether that is an ad, an email, or a call to action on a page. When CTR is high but conversions are low, it means the message is working but the landing experience is not.
3. Bounce rate
Bounce rate is best used as a first-impression signal, not a verdict. A bounce means the session ends right there. No second page. No tracked interaction. Just one pageview and done.
It is usually most useful on landing pages and campaign traffic. If paid traffic bounces at a much higher rate than organic, that is often an expectation gap. The promise that earned the click is not being confirmed fast enough.
4. Exit rate
Exit rate answers a different question than bounce rate. It shows where sessions, or a journey, if put simply, end after someone has already been clicking around.
It is especially useful on pages that should lead somewhere, like pricing, checkout, or a key setup screen. A high exit rate there usually means one of three things: unanswered questions, missing trust, or a next step that is not obvious.
5. Time on page
Time on page is how long visitors spend on a page. Higher time on page is generally a good sign, especially on pages built for evaluation, like pricing, comparisons, or documentation. It often shows you which pages are doing the “thinking” work before someone takes action.
6. Time to value (TTV)
TTV is how quickly someone reaches a moment where the product feels useful.
That moment is usually the aha moment, and it depends on the product. In a reporting tool, it might be building a first dashboard that answers a real question. In a collaboration tool, it might be inviting a teammate and seeing them act on something.
The shorter the time to value, the less time there is for doubt, distraction, or drop-off to take over.
7. Churn rate
Churn rate measures how many users or customers stop using the product over a time period. It keeps CRO honest because churn analysis shows whether people are leaving immediately after signup, after the first week, or right after they hit a limit or a missing feature.
If you improve conversion but churn spikes right after, you might be attracting the wrong audience or setting expectations you cannot support.
8. Cost per acquisition (CPA)
CPA measures the cost to acquire a lead or conversion event, not necessarily a paying customer.
That “lead” can be a registration, an activated user, or a free-trial sign-up. It is the metric that tells you whether your funnel is efficient at producing the outcomes you pay for.
9. Customer acquisition cost (CAC)
CAC is different from CPA because it measures the cost to acquire a paying customer.
If CPA is “what it costs to get someone in the door,” CAC is “what it costs to turn that person into revenue.” When CAC rises, you want to look at both sides: acquisition efficiency and the conversion rate from lead to paid.
10. Customer lifetime value (CLV)
CLV is what a customer is worth over time. This metric is what turns CRO into a strategy.
It helps you judge whether a conversion is worth chasing. A channel that converts fewer people can still be a winner if those customers retain longer or expand more.
11. Average order value (AOV)
AOV is the average value of a purchase. For subscription products, this often shows up as average first invoice value, plan tier, seats, or add-ons. AOV keeps you honest about whether you are growing revenue, not just counting more conversions.
12. Cart abandonment rate
Cart abandonment rate is the percentage of users who start checkout but do not complete it. This captures last-mile friction: payment issues, pricing uncertainty, trust issues, or surprise requirements.
13. Traffic source
Traffic source tells you where visitors come from, such as organic search, paid search, paid social, referrals, affiliates, or direct.
It is not just a reporting label. Knowing your traffic sources can help you tailor your content and marketing strategies to the channels that are driving the most and highest-quality traffic.
This is also where lead source tracking earns its keep, because it connects acquisition source to downstream outcomes like activation, upgrades, and retention.
14. Feature usage
Feature usage shows what users actually do inside the product. Which features they use, how often, and in what sequence.
Analyzing feature usage is how you connect conversion to real product value. Track which actions correlate with users who convert to paid and stay. Then work backward: surface those features earlier, simplify access, and remove steps that block discovery.
15. Return on ad spend (ROAS)
ROAS tells you how much revenue you generate per dollar of ad spend.
It is the ad performance metric everyone looks at, but it can mislead you if you measure too early. For SaaS, the real payoff often arrives later through upgrades, renewals, or longer sales cycles. ROAS is still useful; you just want to measure it on a window that matches how your business actually earns revenue.
How to optimize for conversions with Usermaven
Usermaven makes CRO metrics feel less like a report card and more like a roadmap. You can see where users move forward, where they hesitate, and which step is quietly costing you conversions.
Let’s break down the Usermaven features that help you spot those friction points and fix them.
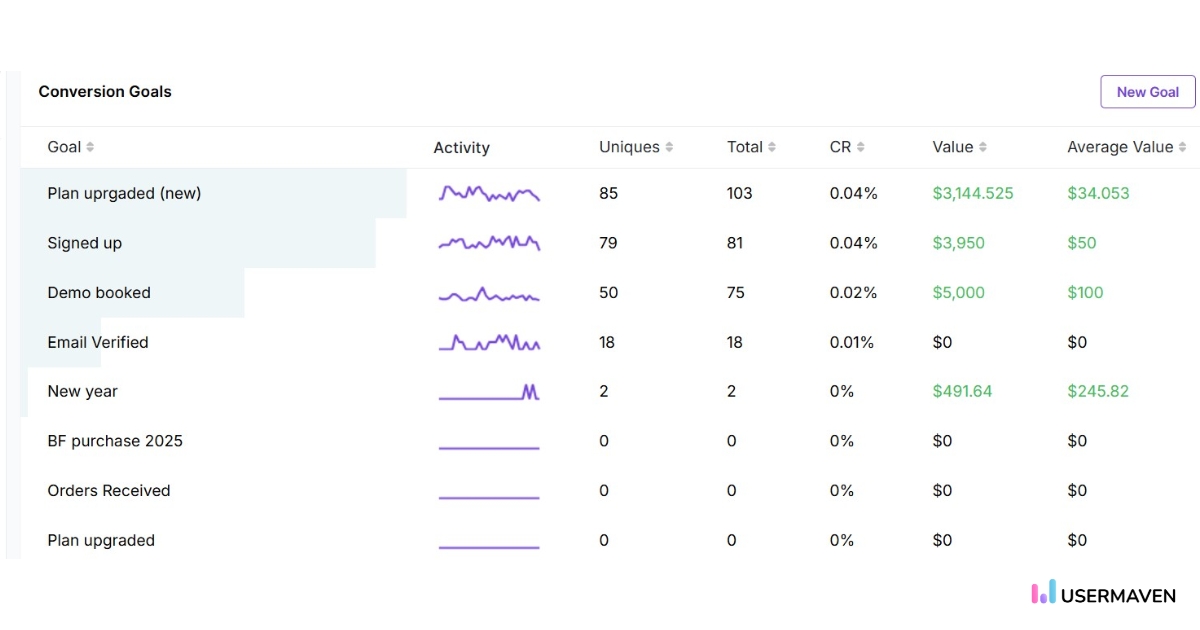
Conversion goals as a single source of truth
Usermaven uses conversion goals as the anchor. You can define a goal from a page visit (classic thank-you page) or from an event (trial started, demo requested, activated, upgraded).
The real win is focus. You stop expecting one conversion to explain everything.
For example:
A founder might care about paid upgrades.
A PM might care about the first project created.
A growth marketer might care about demo requests.
With goals, each team tracks what matters to them, without turning reporting into a debate.
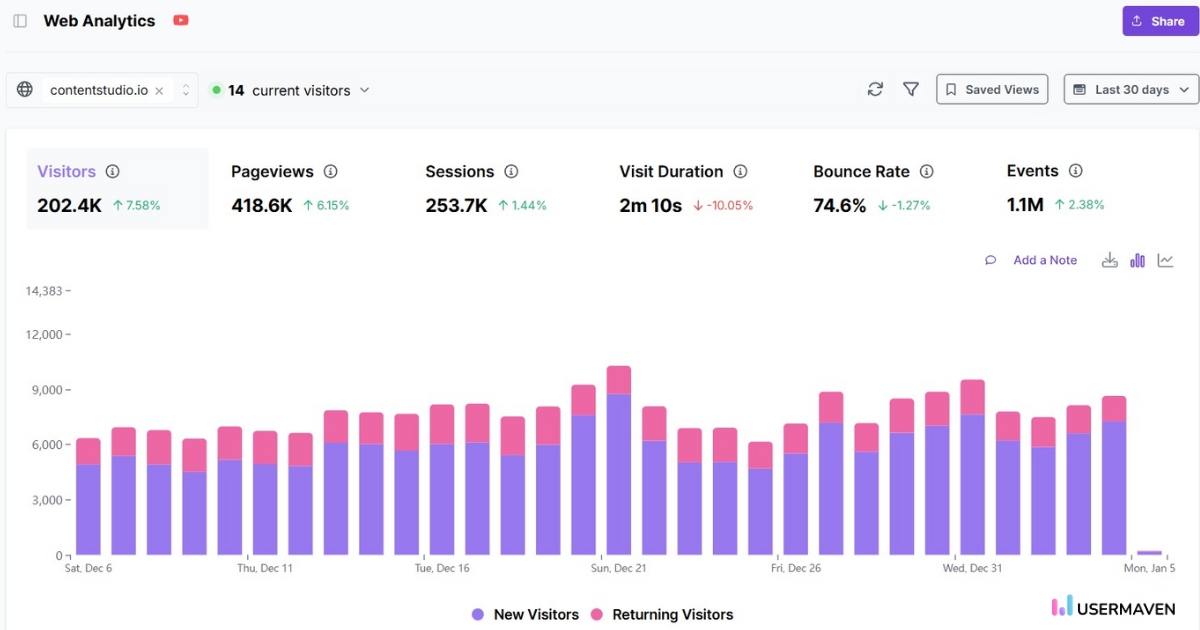
Website analytics for first-step conversions
Website analytics is where most conversion journeys begin. If the first step is weak, everything after it suffers.
Usermaven’s website analytics helps you track how visitors arrive, what pages they land on, and which pages actually convert. You can measure landing page performance, compare traffic sources, and see which campaigns drive visitors who take the next step rather than bounce.
This is where you catch expectation gaps early. If one campaign drives traffic that consistently drops on the first page, the fix is usually the message or offer, not the entire funnel.
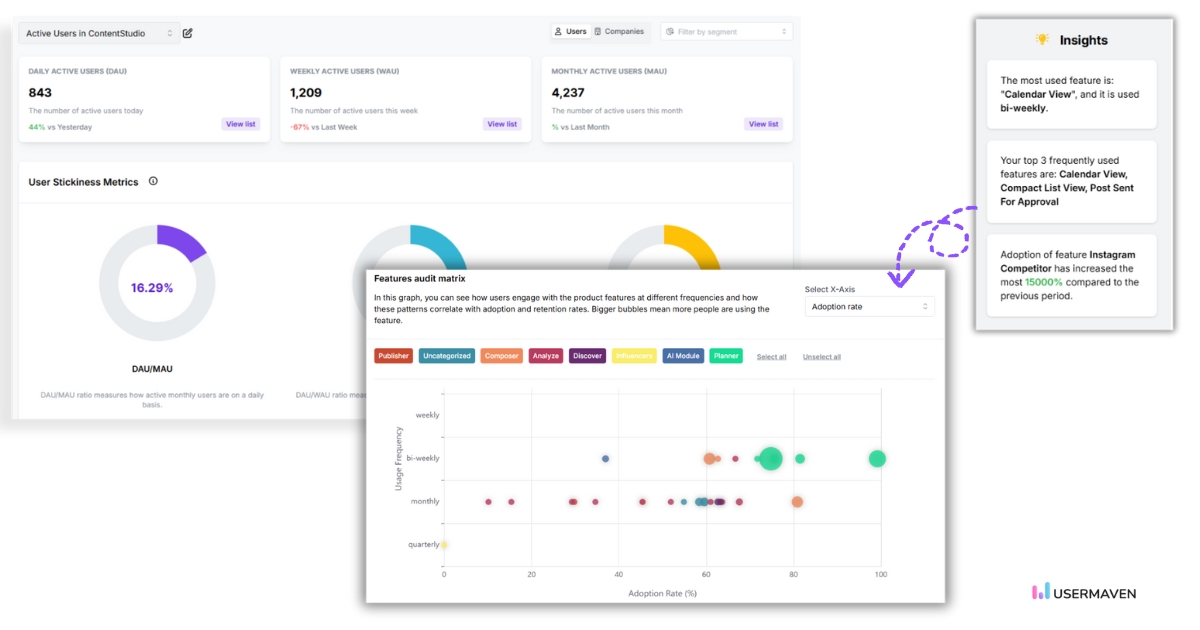
Product analytics to improve activation, not just signups
Post-signup behavior is where conversion either turns into value or quietly disappears.
Usermaven’s product analytics helps you look beyond signups and boost product engagement over time, including the actions that signal real usage, active users, and early drop-off. You can see how users move through key behaviors, where they stall, and when they quietly fade out. That matters for CRO because many conversion problems later become retention problems.
When you understand which actions tend to precede activation and longer-term retention, you can shape onboarding, prompts, and product cues around those behaviors. Instead of hoping users find value on their own, you guide them to it.
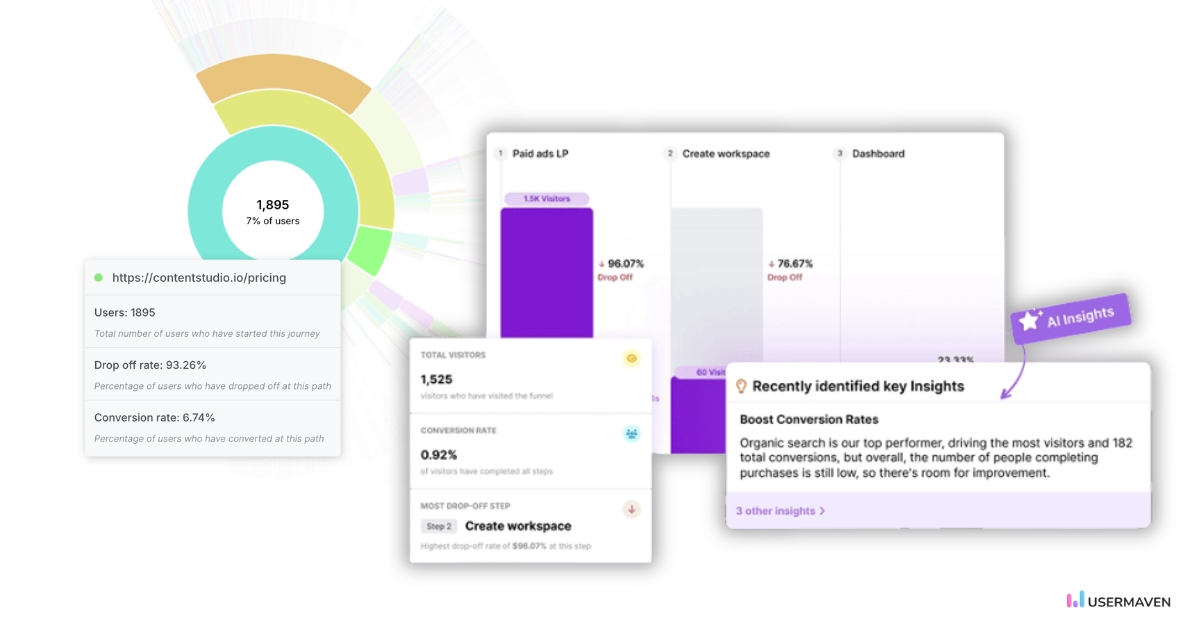
Funnels and journeys for drop-offs
Funnels and journeys answer different questions, and Usermaven is built for both.
Funnels show you where users fall out of a defined flow, step by step. Journeys show you the paths users actually take when the flow is not clean or linear. Together, they explain both the drop and the detour.
In Usermaven, you can build funnels from page views or in-product events and control how strictly steps must be followed. Journeys then help you see the typical paths that lead to conversion and the paths that quietly end.
This is where CRO becomes practical. Instead of debating what users should do, you see what they actually do before they convert or leave.
Dashboards that keep CRO visible
Conversion optimization only works if the data is easy to check and easy to read.
Usermaven dashboards are flexible and customizable, so you can build views around the CRO metrics you actually care about. Landing page conversion by channel. Signup to activation progress. Drop-off points that need attention.
Clean dashboards reduce reporting overhead and make trends easier to spot. When changes are visible early, fixes tend to be smaller and faster.
The value is simple. Fewer blind spots. Clearer priorities. And CRO work that is driven by evidence instead of assumptions.
Wrapping up
CRO metrics are how you separate opinions from evidence. They show you where users hesitate, where they commit, and where the experience quietly breaks. When you track the right metrics, optimization stops being guesswork and starts looking like progress you can measure.
For CRO teams, Usermaven is performance attribution software that connects traffic sources, funnel behavior, and conversion outcomes in one view. You can track the moments that matter, see where friction shows up, and understand what actually leads to progress. Instead of staring at numbers, you get clear clues about what to fix next.
If you want conversions to feel less like trial and error and more like steady improvement, CRO metrics are where it starts.
FAQs about CRO metrics
1. How do CRO metrics differ from general marketing performance metrics?
CRO metrics focus specifically on on-site user behavior and conversion efficiency, while general marketing metrics measure traffic generation, reach, or acquisition performance.
2. Which CRO metrics matter most at different stages of the funnel?
3. What’s the risk of optimizing a single CRO metric in isolation?
Optimizing a single CRO metric alone can create false wins, such as higher conversion rates paired with lower-quality users or increased churn. CRO metrics work best when reviewed together to understand trade-offs
4. How do you know if a CRO metric is worth tracking long-term?
A CRO metric earns its place if it influences decisions. If a metric doesn’t change what you prioritize, test, or fix, it’s noise, even if it looks impressive in reports.
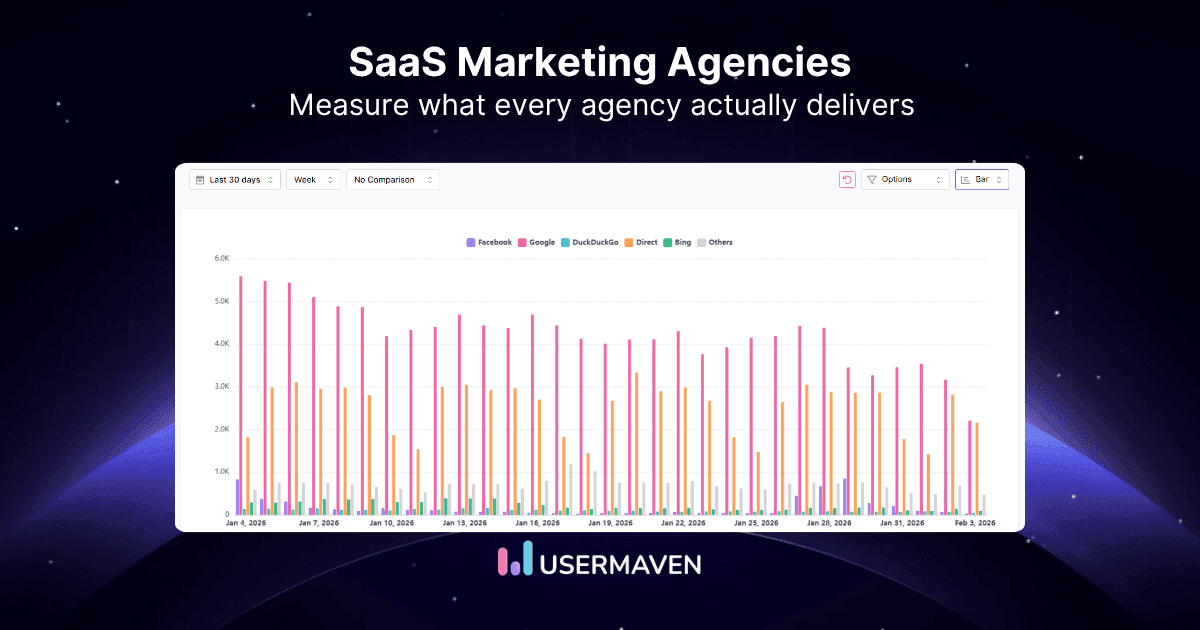
A typical SaaS buying journey has nothing to do with the classic seven touches. Today, the environment is so crowded that you need to build trust, stay visible across multiple channels, and show up everywhere your buyers are researching. Most SaaS teams do not have the resources or specialist depth to do all of this […]
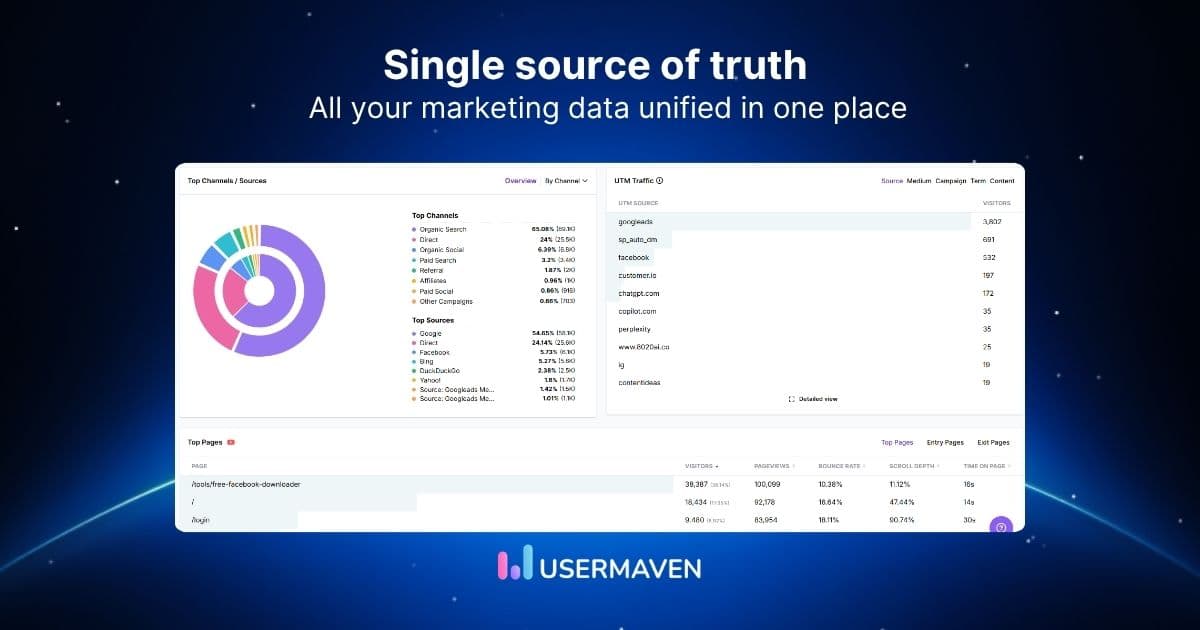
Monday morning. The marketing team opens five tools and still cannot agree on last week’s conversions. Google Ads, GA4, Meta Ads Manager, the CRM, and a revenue spreadsheet all show different numbers. The meeting ends with guesses, not decisions. A single source of truth is a shared, authoritative data layer where every important marketing and […]
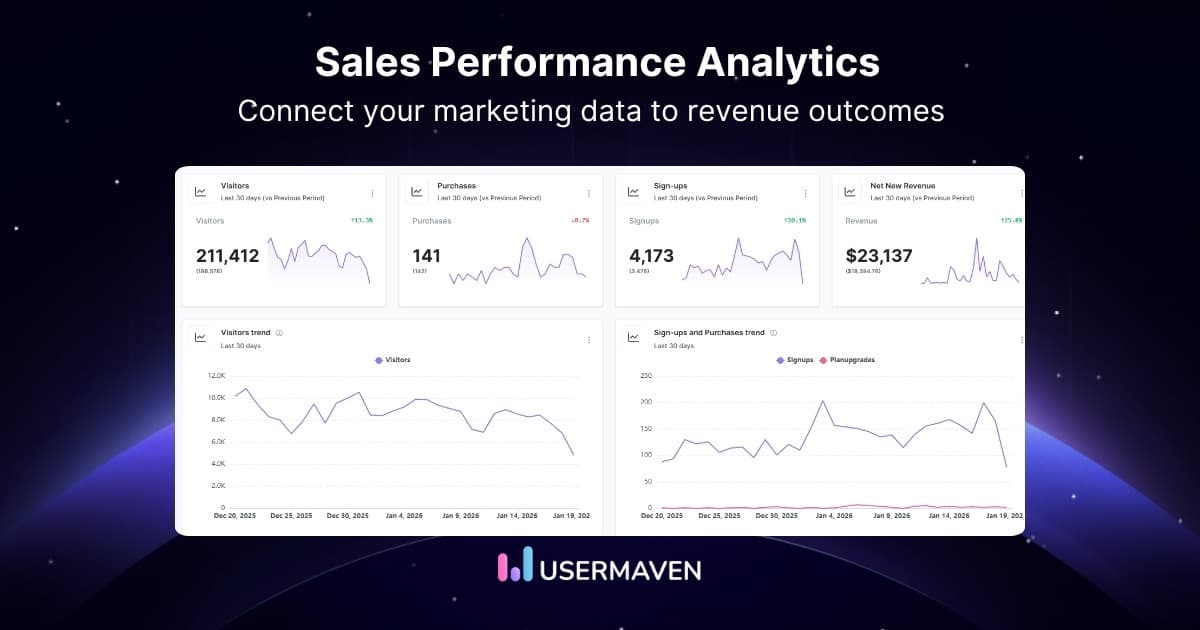
Sales teams in 2026 have more dashboards, more CRM data, and more reports than ever before. Most of them still cannot answer the question: which activities, channels, and behaviours are actually driving revenue? The problem is not a lack of data. It is a lack of the right measurement system to turn that data into […]
By Junaid Ahmed
Jun 9, 2026
15 CRO metrics worth tracking (and what each one tells you)