One blog post gets 40,000 visits a month and no revenue, while another gets 800 visits and starts three enterprise deals.
Guess which one gets the spotlight in the weekly report. Usually the first. Guess which one your CFO wants more of. The second, every time.

That gap is why content budgets get cut. Page views take seconds to pull, but tracing content attribution all the way to revenue takes real setup, so many teams never do it. This guide fixes that, with the metrics, formulas, attribution models and tools that connect content to leads, pipeline, customers and retention.
Key takeaways
- Content marketing ROI = (revenue attributed to content − total content cost) ÷ total content cost × 100. Include staff time, or the number will look better than it is.
- Traffic shows reach, not value. Track the full chain from visit to lead, opportunity, revenue and retention.
- Give every piece of content one job (demand, sales enablement, acquisition, retention or authority) and one primary metric to match.
- Last-click reporting hides early-stage content. Use a multi-touch model, apply it consistently, and compare it with a second model every quarter.
- Lead quality beats lead volume. MQL-to-SQL rate, cost per lead by asset and content-influenced pipeline tell you more than raw sign-ups.
- Content compounds. Judge evergreen programs over 6 to 12 months or longer, and watch leading indicators in the meantime.
What is content marketing ROI?
Content marketing ROI is the return your business earns from content compared with what it costs to create, publish and promote it. It’s usually shown as a percentage. A 240% ROI means every $1 spent on content brought back $3.40 in revenue: the original $1 plus $2.40 of profit on top.
Unlike traffic or engagement, ROI is a financial number. It answers the question leadership actually asks: “If we put another dollar into content, what do we get back?”
To calculate it, you need two inputs you can defend:
- Attributed revenue. Revenue from deals, subscriptions or orders that content helped create, credited through an attribution model.
- Total content cost. Everything you spend to produce and distribute content, including people, tools and promotion.
The rest of this guide is about getting both inputs right.
Why traffic alone is misleading
A visit shows that someone arrived. It says nothing about why. Maybe they were ready to buy. Or maybe they were a student, a recruiter or a competitor poking around.
A viral article tends to attract that broad crowd. A narrow comparison page might get only a few dozen readers, and almost all of them are actively evaluating a purchase.
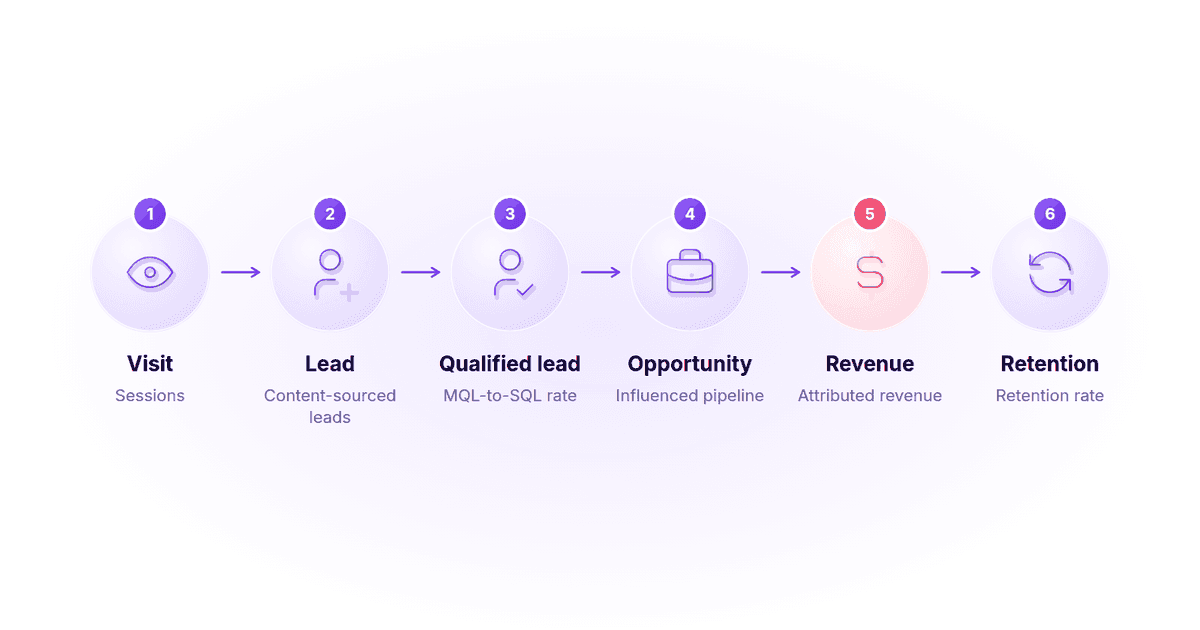
Leadership doesn’t care how many people read the blog. They care whether content brings in customers at a reasonable cost. Getting there means measuring a chain:
Visit → lead → qualified lead → opportunity → revenue → retention
Break one link and the story falls apart. Measure every link and you have something you can defend in a budget meeting.
Measurement is also what separates strong teams from the rest. In CMI’s 2027 B2B content and marketing trends research, only 12% of B2B marketers said their marketing significantly exceeded its goals, and measurement and reporting was one of the factors effective teams credited for their results.
The tracking gap is common, too. Usermaven’s audit of 1,110 B2B SaaS websites found that 84% of sites running ad pixels had no detectable dedicated attribution tool. Without one, content performance usually stops at page views and form fills.
Example: three posts, three very different returns
Here’s an illustrative quarter for three blog posts. The numbers are hypothetical, but the pattern is one most content teams will recognize.
| Metric | Viral listicle | How-to guide | Comparison page |
|---|---|---|---|
| Monthly visits | 40,000 | 6,500 | 800 |
| Leads captured | 120 | 85 | 24 |
| Sales-qualified leads | 4 | 14 | 11 |
| Influenced pipeline | $18,000 | $96,000 | $210,000 |
| Attributed revenue (linear model) | $2,000 | $21,000 | $48,000 |
| Total cost (writing, design, promotion) | $3,000 | $2,500 | $1,800 |
| Content ROI | −33% | 740% | 2,567% |
The traffic report would rank these posts in exactly the wrong order. That’s the case for measuring content beyond traffic.
How to calculate content marketing ROI
Once you have attributed revenue, the math is short:
Content marketing ROI (%) = (attributed revenue − total content cost) ÷ total content cost × 100
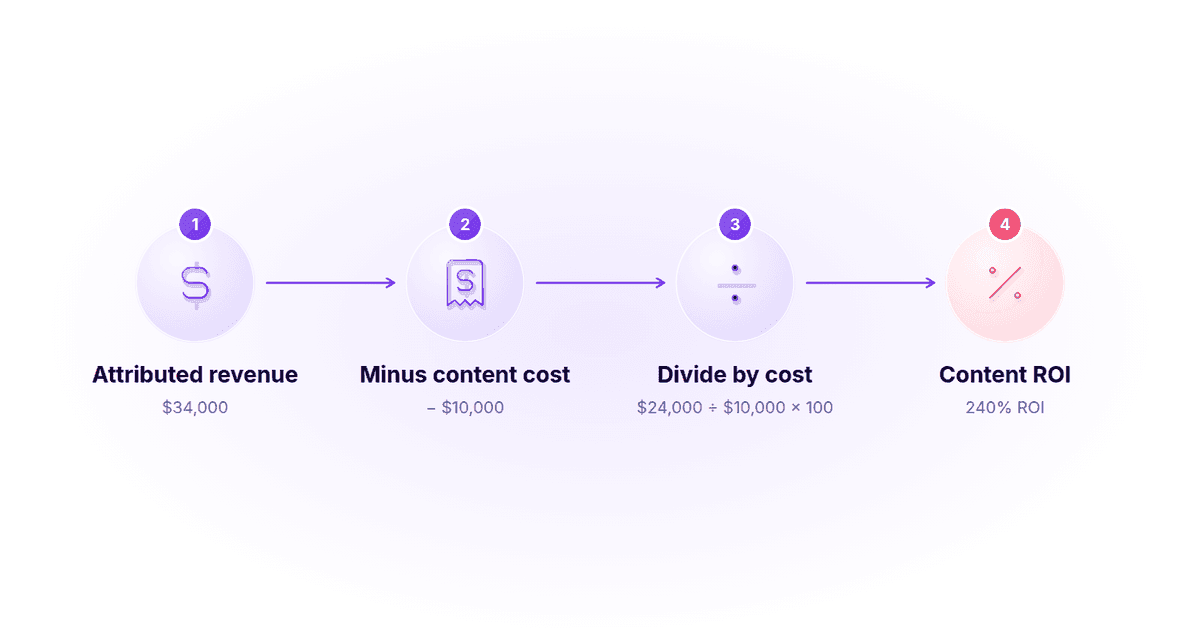
Worked example. Your team spends $10,000 in a quarter on writers, design, tools and promotion. Deals credited to content bring in $34,000.
(34,000 − 10,000) ÷ 10,000 = 2.4, which is a 240% return.
You can run the same numbers through Usermaven’s free ROI calculator, or read the broader walkthrough on how to calculate ROI in digital marketing.
What to include in content costs
Most inflated ROI numbers come from undercounting cost. Build the cost side from every line below.
| Cost category | What to include | Often forgotten |
|---|---|---|
| People | Writers, editors, designers, SEO and content strategists (salary share or freelance fees) | Subject-matter expert time for interviews and reviews |
| Production | Design, video, illustrations, original research | Content refreshes and updates |
| Tools | SEO tools, CMS, analytics, AI writing tools, plagiarism and grammar checkers | Shared tools split across teams |
| Distribution | Paid promotion, newsletter platforms, syndication, sponsorships | Sales time spent sharing content |
| Overhead | Agency retainers, project management | Onboarding new contributors |
Other ROI views worth tracking
A single ROI percentage is useful, but it hides timing and efficiency. These four views add the missing context:
- ROI per asset. Run the formula for individual posts or content clusters to see what to double down on.
- Pipeline ROI. Use influenced pipeline instead of closed revenue when your sales cycle is longer than your reporting period.
- Payback period. Months until cumulative attributed revenue covers the cost of a piece. Evergreen content often keeps earning after payback.
- Content-sourced CAC. Total content cost divided by customers whose journeys content sourced or influenced. Compare it with your blended customer acquisition cost by channel.
A tip from practice: keep a monthly sheet with three columns (cost, attributed revenue, payback period). It takes about an hour to set up, and it spares you a lot of awkward questions later.
Start with a clear goal for every piece of content
Before you open a dashboard, decide what each piece of content is meant to do. Otherwise you’ll drown in numbers that don’t mean anything.
Match each goal to one primary metric and one supporting metric:
| Content goal | Typical content | Primary metric | Supporting metric |
|---|---|---|---|
| Generate demand | Guides, research, top-of-funnel blogs | Marketing qualified leads (MQLs) | Form completion rate |
| Shorten the sales cycle | Case studies, comparisons, ROI pages | Days from first touch to close | Content viewed by closed deals |
| Win new customers | Product-led tutorials, landing pages | Customer acquisition cost (CAC) | Content-assisted conversions |
| Keep existing customers | Onboarding guides, help docs, webinars | Retention rate | Product adoption after reading help content |
| Build authority | Thought leadership, original data | Branded search growth | Referring domains and AI citations earned |
Mapping goals to funnel stages also makes reporting fairer. A top-of-funnel guide shouldn’t be judged on last-touch revenue, just as a pricing comparison shouldn’t be judged on social shares. If you need a framework for those stages, start with this guide to the content marketing funnel.
Make sure the content is worth measuring
This step gets skipped a lot. If a page is thin, recycled or partly copied, every metric below it suffers, because readers and search engines both lose trust quickly.
Many teams now draft with AI help, and it’s genuinely useful. It can sketch an outline, rescue a dull intro or suggest an angle you hadn’t considered. For a small team with a busy calendar, that saves hours.
The risk is subtle, though. Generated or heavily reworked text sometimes mirrors phrasing that already exists online, and you can’t spot it just by reading. Google’s spam policies also cover scraped and copied content, so overlap isn’t only a reader-trust problem.
That’s why a quality check belongs in your workflow before anything goes live. Running each draft through a free online plagiarism checker from GetSolved.ai, an AI-powered writing platform, compares it against indexed sources and highlights overlaps you can rewrite before publishing. It’s a small cost line that protects a much bigger one: a page that gets demoted can wreck a quarter’s worth of ROI data.
A simple pre-publish checklist keeps measured content trustworthy:
- Originality: no copied or near-duplicate passages, and sources credited.
- Accuracy: statistics and product claims checked against primary sources.
- Intent match: the page answers the question its target query actually asks.
- Conversion path: one clear next step, such as a demo, trial, template or related guide.
- Tracking: forms, CTAs and links tagged before launch, not after.
Content marketing metrics that prove ROI
Not every metric belongs in an ROI report. The ones below connect content to business outcomes, grouped by the stage of the journey they measure.
| Metric | What it tells you | Funnel stage |
|---|---|---|
| Content-sourced leads | Which assets start relationships | Awareness to consideration |
| MQL-to-SQL rate | Whether content attracts the right buyers | Consideration |
| Cost per lead by asset | Efficiency of each piece | Consideration |
| Conversion rate per page | Which topics pull in buyers | Consideration to decision |
| Assisted conversions | Content’s role in multi-step journeys | All stages |
| Content-influenced pipeline | Deal value where content appeared in the journey | Decision |
| Attributed revenue | Revenue credited to content by your model | Decision |
| Retention and expansion | Content’s impact after the sale | Post-purchase |
Leads: quality beats volume
Say a gated ebook collects 500 emails. Sounds great until you learn that 480 of those people never open a single follow-up. Raw sign-ups flatter you. These numbers don’t:
- Content-sourced leads. Contacts whose first touch was a blog post, guide or webinar.
- MQL-to-SQL rate. How many marketing leads sales actually wants to call. A low rate means your content is attracting the wrong people. A clear lead scoring model makes this metric far more reliable.
- Cost per lead by asset. Production plus promotion spend, divided by leads captured. Usermaven’s cost per lead calculator handles the math.
- Lead velocity. The pace at which qualified leads build up, month over month.
One tip that costs almost nothing: tag every form with the page it sits on, and use consistent UTM parameters on every link you distribute. If you don’t, half your leads get labeled “direct” and content gets no credit at all. This guide to lead source tracking covers the setup in more detail.
Conversions and buying intent
Some conversions are small (a newsletter signup), and some are big (a demo request). Track both, since the small ones tend to predict the big ones.
- Conversion rate per page. Compare posts to see which topics pull in buyers.
- Assisted conversions. Plenty of people come back three or four times before they act. The post that started that path deserves some credit.
- Pages seen before converting. A blog reader who then checks pricing or a case study is sending a clear buying signal.
- CTA click rate. If people finish the article and ignore the button, blame the offer, not the topic.
In Usermaven, the Conversion Paths report shows where each channel sits in the path to conversion, split into early, mid and late touchpoints. If organic search leads the early touchpoints while direct dominates the late ones, that’s a clear sign your content starts journeys that other channels get credit for closing.
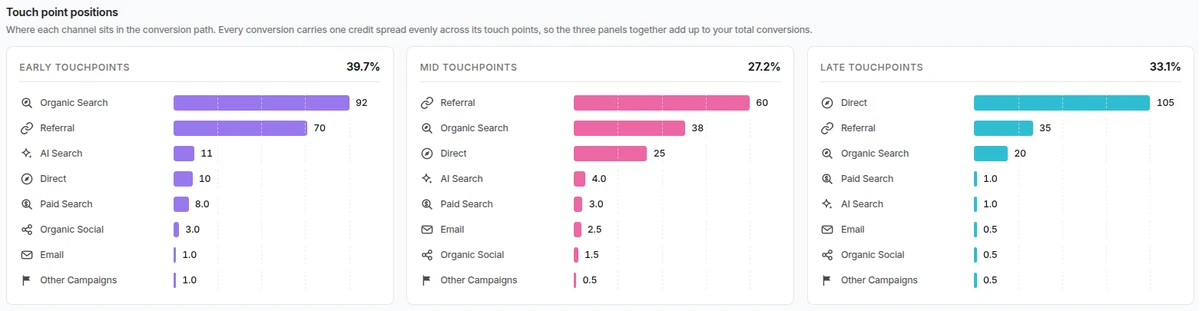
Last-click reporting is the main reason blogs look weaker than they are. It simply never sees the early articles.
Pipeline and revenue
For B2B teams with longer sales cycles, closed revenue lags months behind content. Two metrics fill the gap:
- Content-influenced pipeline. The total value of open opportunities where content appears anywhere in the buyer journey.
- Content-sourced revenue. Closed revenue where content was the first meaningful touch.
Both depend on connecting web behavior to CRM records. Without that link, you’re reporting on leads and hoping they close. Usermaven’s guide to pipeline attribution explains how to connect the two.
Engagement: useful, but not proof
Time on page and scroll depth are everywhere, yet on their own they prove little. An article can hold someone for four minutes simply because it’s confusing. Treat engagement as a hint, then look for confirmation.
What helps more: returning visitors, pages per session, newsletter replies, and how many readers move on to a product, pricing or demo page. Heatmaps and session recordings are also useful here, since they show where readers drop off and which section needs a rewrite.
After the sale: retention and expansion
Content doesn’t stop working at the purchase. Onboarding guides, help articles and customer stories keep people around, and that’s where a large share of long-term profit comes from. To check the effect:
- Compare churn for customers who read help content against those who didn’t.
- Count how many support tickets a new tutorial prevents.
- See whether readers of advanced guides upgrade more often.
- Track lifetime value by first-touch content, using a SaaS LTV calculation.
Usermaven’s retention reports group users into cohorts by signup period. Pair them with a segment of users who viewed your onboarding or help content, and you can compare how long each group stays.
Cohort analysis works well here because it compares like with like: customers who signed up in the same period, split by whether they used the content.
Authority and AI visibility
Authority content rarely converts on the first visit, but you can still measure it:
- Branded search growth in Google Search Console, a sign that more people know your name.
- Referring domains earned by original research and data.
- AI referrals and citations. Visits from ChatGPT, Perplexity and AI search features are growing, and they often convert differently from classic organic traffic. Here’s how to approach AI traffic attribution.
Attribution: where content marketing ROI gets real
Attribution is the hardest step, and the one that decides whether you keep your budget. The goal is to give each page a fair share of the deals it influenced.
These models cover most cases:
| Attribution model | How credit is split | Best for content that… | Watch out for |
|---|---|---|---|
| First touch | 100% to the first interaction | Creates awareness (SEO guides, research) | Ignores everything that nurtured the deal |
| Last touch | 100% to the final interaction | Closes deals (pricing, comparisons, demos) | Undervalues blogs and early-stage content |
| Linear | Even split across every touchpoint | Supports long, multi-touch journeys | Treats a quick skim like a decisive visit |
| Position-based (U-shaped) | 40% first, 40% last, 20% split across the middle | Balances discovery and conversion | Middle-funnel content gets little credit |
| Time decay | More credit to touches closer to conversion | Short, promotion-driven cycles | Penalizes top-of-funnel content |
| Custom | Weights you define | Teams with a well-understood journey | Needs validation and regular review |
No model is perfect. Pick one, use it consistently, and compare it with a second model every quarter. If both point to the same cluster of content as a pipeline driver, that’s a finding you can trust. Usermaven’s research on how attribution model choice changes the answer shows why that cross-check matters.
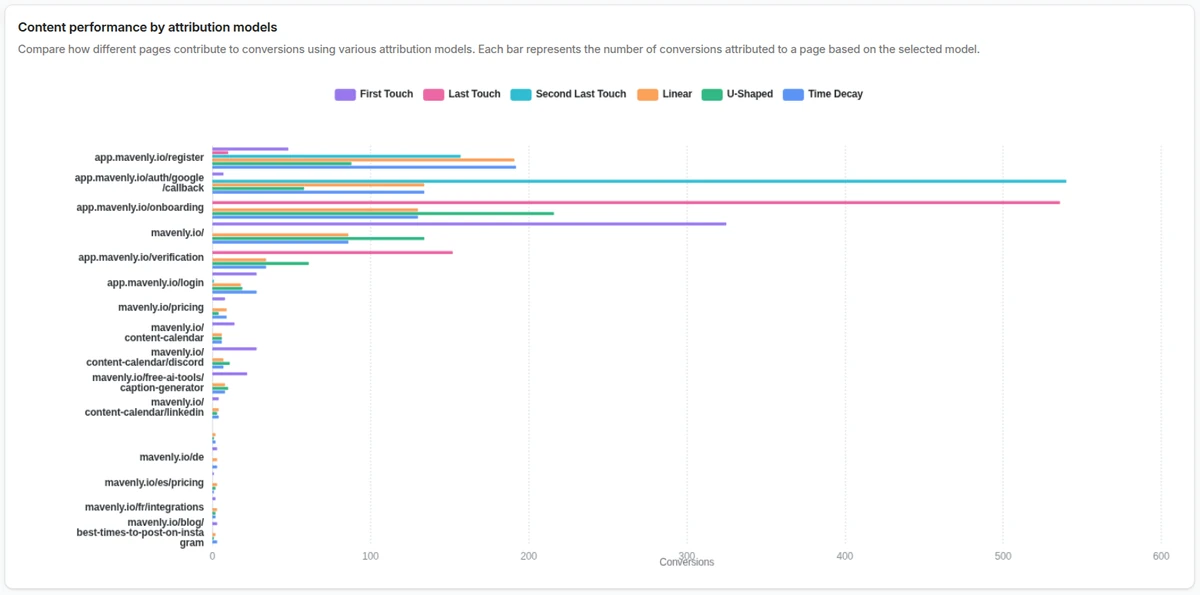
Usermaven’s Content Attribution report puts this into practice. It shows how each page contributes to a conversion goal under First Touch, Last Touch, Second Last Touch, Linear, U-Shaped and Time Decay models side by side, with a lookback window you can set from 30 to 180 days.
Two practical additions make attribution more honest:
- Self-reported attribution. A simple “How did you hear about us?” field catches podcasts, communities and word of mouth that tracking can’t see. Here’s how to use self-reported attribution alongside software data.
- Consistent lookback windows. B2B journeys can run for months. A 30-day window will miss content that started a 90-day deal.
For a deeper comparison of each option, see this guide to marketing attribution models.
Maximize your ROI
with accurate attribution
How to set up content ROI tracking, step by step
Here’s a practical setup most teams can complete in a few weeks:
- Define conversion goals. Decide which events count: lead form, demo request, trial signup, SQL, opportunity and closed-won deal. Give each a value where you can.
- Tag your content and links. Use consistent UTM naming for every newsletter, social post and partner placement, and record the page each form sits on.
- Identify contacts. Tie anonymous visits to known people when they convert, so earlier content touches carry over into their profile.
- Connect revenue data. Sync your CRM (deals and stages) and billing system (subscriptions and payments) so attribution ends in money, not form fills.
- Choose a primary model and a comparison model. For example, use U-shaped as your reporting model and linear as your quarterly check.
- Build a content ROI dashboard. Show cost, leads, SQLs, influenced pipeline, attributed revenue and ROI by asset and by topic cluster. This walkthrough on building a content marketing dashboard shows the layout.
- Review monthly, decide quarterly. Look at trends monthly. Make budget calls (refresh, expand, cut) once a quarter, when the data has had time to settle.
How long does content marketing take to show ROI?
Content is a compounding asset, not a campaign. Paid ads stop the day you stop paying, but a well-ranked guide can keep generating leads for years.
That also means early numbers look weak. New articles often need several months to rank and build links, and B2B deals they influence may take another quarter or two to close. Judge evergreen programs over 6 to 12 months at minimum, and longer for competitive topics.
In the meantime, watch leading indicators that predict ROI:
- Rankings and impressions for buyer-intent queries.
- Content-sourced leads and MQL-to-SQL rate.
- Product, pricing and demo page visits after reading.
- Influenced pipeline, before it turns into closed revenue.
Calculating payback period per asset shows when each piece has covered its own cost, which helps you defend long-term content investments.
Common content ROI mistakes to avoid
Even well-run teams fall into these traps:
- Leaving staff time out of costs. This is the single biggest cause of inflated ROI numbers.
- Relying on last-click only. Early-stage content will always look worthless.
- Untagged forms and links. Leads get filed under “direct” and content loses credit.
- Counting every lead equally. 500 unqualified sign-ups aren’t worth more than 20 SQLs.
- Switching models every quarter. Trends become impossible to compare.
- Short lookback windows. They cut off the content that started long B2B journeys.
- Ignoring post-sale content. Retention and expansion are often where content pays back most.
- Forgetting refresh costs. Updating old posts is real work and belongs in the cost column.
How Usermaven helps you measure content marketing ROI
Usermaven is marketing attribution software that connects every content touchpoint to conversions, pipeline and revenue. Here’s how it covers the workflow above:
- Content Attribution. Found under Attribution > Content, this report shows how each page contributes to a conversion goal, with six attribution models side by side and an adjustable lookback window. Usermaven’s content attribution setup guide walks through the configuration.
- Conversion goals mapped to your funnel. Goals can be tagged as Lead, MQL, SAL, SQL, Opportunity or New Revenue, and they can use CRM deal events from HubSpot or Salesforce, so content gets credit for pipeline, not just form fills.
- Lead and contact tracking. Leads are identified by email and stored in Contacts Hub with their full journey, so you can see which articles a contact read before they became an opportunity.
- Revenue connections. Payment data from tools such as Stripe and Paddle carries attribution through to actual revenue and realized lifetime value.
- Funnels, journeys and retention. See where content readers drop off, which paths lead to signup, and whether readers of help content stay longer.
- Maven AI. Ask questions like “Which pages drove the most demo requests last quarter?” in plain English and get charts and answers without building reports by hand.
Teams like Contentpen have already used Usermaven this way. Read how Contentpen turned SEO traffic into more conversions.
Tools for measuring content marketing ROI
You don’t need a huge stack. These tools cover most of what’s above.
Usermaven
Usermaven connects content visits to sign-ups, funnels, pipeline and revenue in one place. Its Content Attribution report compares six attribution models side by side, and CRM and payment integrations carry credit through to closed revenue.
It’s built for marketing teams that need to prove content’s impact on pipeline, not just traffic.
Pricing: Business and Enterprise plans with custom pricing, available through a demo.
Google Analytics 4
GA4 offers free event and conversion tracking across traffic sources, with landing page and engagement reports that work well for top-of-funnel content analysis.
Its attribution reporting now centers on data-driven and last-click models, since Google retired first-click, linear, time-decay and position-based models in 2023. Teams that want rule-based multi-touch views usually pair it with a dedicated tool. See how GA4 marketing attribution works in practice.
Pricing: free, with a paid enterprise tier (GA4 360).
HubSpot
HubSpot is a CRM and marketing platform that connects form fills, emails and deals to the pages behind them. It’s a natural fit if your sales team already works in HubSpot.
Its advanced multi-touch revenue attribution reports sit on higher Marketing Hub tiers. This breakdown of HubSpot revenue attribution covers setup and limits.
Pricing: free CRM, with paid Marketing Hub tiers.
Google Search Console
Search Console shows the queries, impressions, clicks and positions behind your organic content. It’s the best free source for branded search growth and for spotting near-ranking pages worth refreshing.
Pricing: free.
Looker Studio
Looker Studio builds free dashboards that combine analytics, ad, CRM and spreadsheet data. It’s useful for leadership-ready ROI reports once your data sources are clean.
Pricing: free, with a paid Pro version.
See Usermaven in action
Book a free demo and discover how powerful analytics can grow your business.
Final thoughts
Traffic is a starting line, not a finish line. The teams that win bigger budgets can point to a specific article and say: this one captured a lead, that one influenced a deal, this one kept a customer.
So set a clear goal for every piece, tag every source, choose an attribution model and stick with it, and review your content marketing ROI every month. Within a quarter, the question from leadership usually shifts from “How many visits?” to “Where do we invest next?”
FAQs
What is a good content marketing ROI?
There’s no universal benchmark, because ROI depends on deal size, sales cycle and how you count costs. Any positive ROI means content returns more than it costs. Many B2B teams treat 3:1 or better (a 200% ROI) as a healthy target for a mature program. Compare your own trend over time rather than chasing published averages.
How do you calculate content marketing ROI?
Subtract total content cost from revenue attributed to content, divide by total content cost, and multiply by 100. For example, $34,000 in attributed revenue against $10,000 in costs gives (34,000 − 10,000) ÷ 10,000 × 100 = 240%. Include staff time, tools and promotion in costs.
How do you measure content marketing ROI without direct sales?
Use proxy metrics tied to revenue: content-sourced leads, MQL-to-SQL rate, influenced pipeline and assisted conversions. Assign values to conversion goals, such as an average deal value multiplied by the SQL-to-close rate. Then report pipeline ROI until closed revenue catches up.
Which attribution model is best for content marketing?
Multi-touch models usually suit content best because content works across the whole journey. U-shaped (position-based) credits both the content that introduced a buyer and the content that converted them. Linear is a good comparison model. Avoid relying on last-click alone, since it hides early-stage content.
How long does it take to see ROI from content marketing?
Most evergreen content needs several months to rank and attract qualified traffic, and B2B deals it influences can take another quarter or two to close. Evaluate programs over 6 to 12 months or longer, and track leading indicators such as rankings, content-sourced leads and influenced pipeline in the meantime.
What metrics matter most for content marketing ROI?
Focus on metrics that connect to revenue: content-sourced leads, MQL-to-SQL rate, cost per lead by asset, conversion rate per page, influenced pipeline, attributed revenue and retention. Traffic, time on page and social shares are useful signals but shouldn’t stand alone in an ROI report.
Can you track content marketing ROI in Google Analytics 4?
Partly. GA4 tracks conversions by landing page and supports data-driven and last-click attribution, which works well for top-of-funnel analysis. It doesn’t connect content to CRM pipeline or closed deals on its own, so B2B teams often add a dedicated attribution tool for revenue-level reporting.
How do you track which blog posts generate leads?
Tag every form with the page it sits on, use consistent UTM parameters, and identify contacts when they convert so earlier visits are tied to their profile. A content attribution report then shows which posts appeared in each lead’s journey, under first-touch, last-touch or multi-touch models.

Written by
Lauren Brooks
Lifecycle Marketing Strategist
Lauren Brooks is a lifecycle marketing strategist with 4+ years of experience helping SaaS businesses create meaningful customer experiences. She specializes in user engagement, retention, and conversion optimization, helping brands build stronger customer relationships beyond acquisition.
All articles by Lauren →