Every Shopify merchant wants to know one thing: which marketing efforts actually drive sales. But with fragmented data, limited attribution, and siloed Shopify reports, that’s easier said than done.
That’s where the Shopify Usermaven integration changes everything.
By connecting your Shopify store to Usermaven, you get full-funnel visibility from the first ad click to the final checkout. As revenue attribution software, Usermaven helps you attribute revenue to the right channels, understand conversion paths, and see exactly what drives ROI.
Let’s look at five powerful ways Shopify brands use Usermaven’s attribution capabilities and web analytics features to make smarter, more profitable marketing decisions.
Website analytics tool for modern marketers & agencies
*No credit card required
1. See exactly where your revenue comes from with advanced attribution
Shopify’s default analytics leans on last-click attribution. If a customer first taps a TikTok ad, later reads an email, and finally converts after a Google search, last-click gives all credit to Google.
The result: under-funded introducer channels, over-funded closer channels, and skewed ROI.
How Usermaven changes the picture
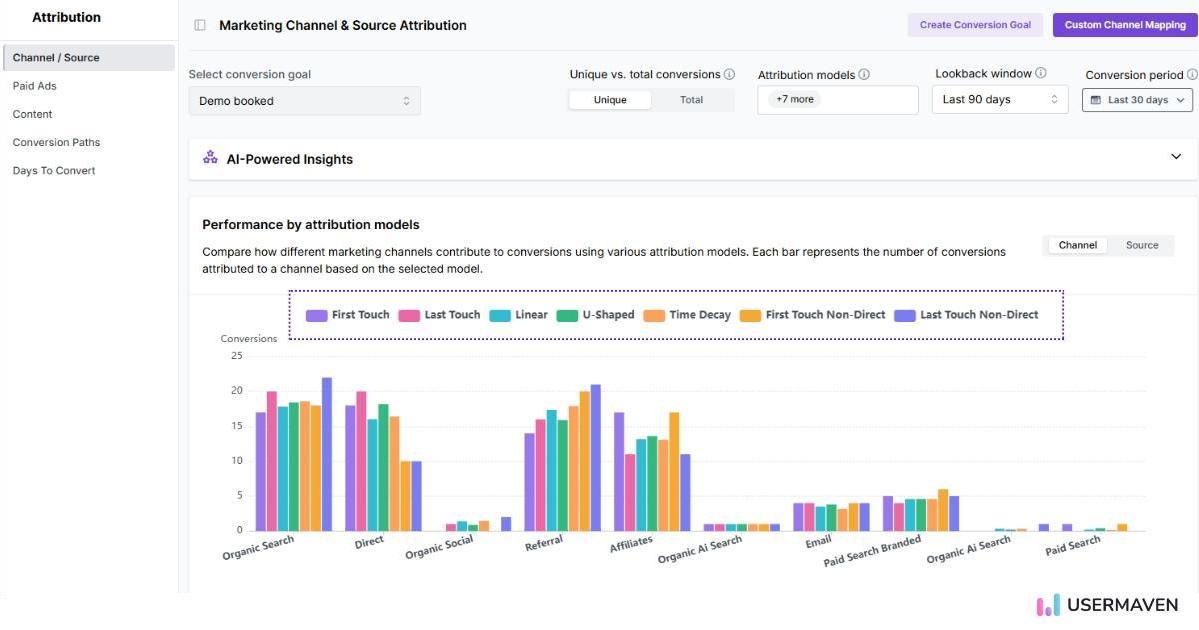
For Shopify brands, Usermaven works as revenue attribution software that connects Shopify events, paid social, organic search, email, and affiliate touchpoints across sessions and devices. The integration enables multi-touch attribution (MTA) built for ecommerce, so you can evaluate first-click, linear attribution, position-based, or data-driven models.
Example: A home décor brand finds that 40%+ of conversions involve 2–4 touches. Paid social tends to introduce shoppers; email and organic search nurture them; branded search closes the loop. With MTA, the brand reallocates spend toward the high-leverage introducers and nurturers, not just the last click, and increases net profit without raising budget.
Here’s how multi-touch attribution looks inside Usermaven, giving you a clear picture of how different channels work together to influence a single purchase.
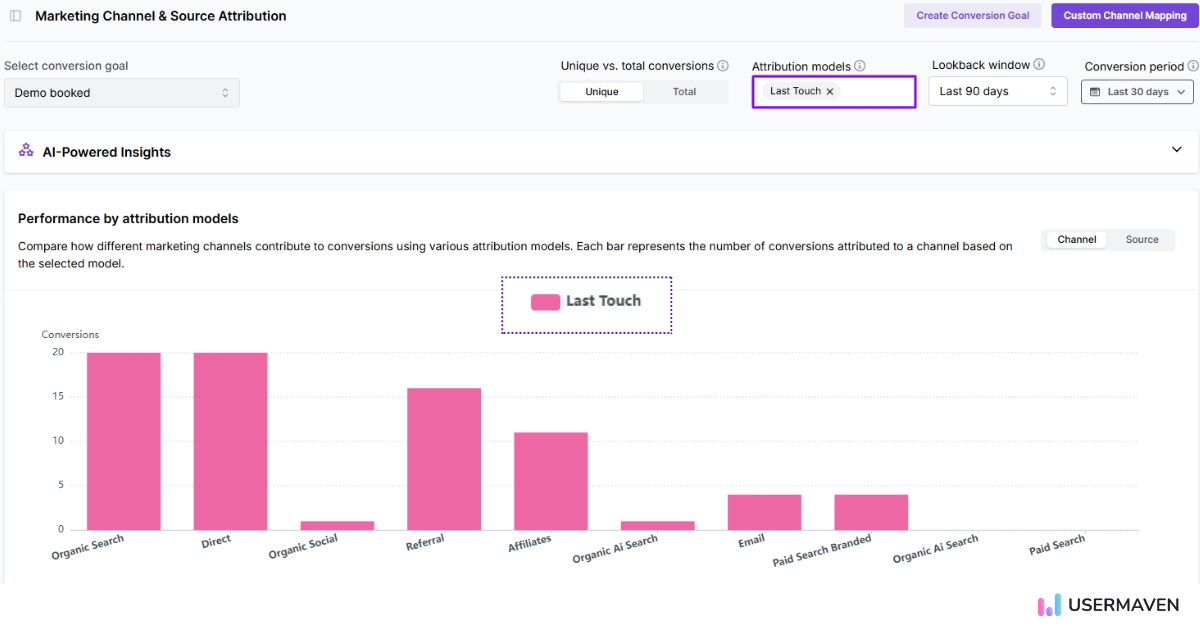
In contrast, here’s what a last-click attribution model shows, crediting the entire conversion to just one final touchpoint and hiding the rest of the journey.
Quick note: If you’re deciding whether Shopify’s built-in reporting is enough, our blog on Shopify analytics vs. Usermaven breaks down the practical differences
2. Uncover the highest-performing campaigns and ad channels
Usermaven captures UTMs from Facebook/Meta, Google Ads, TikTok, email, and affiliates. You’ll see revenue, orders, AOV, CAC, and ROAS by channel, campaign, ad set, and even creative (when your parameters carry that data).
What this looks like in practice
Paid social is strong for first-time purchases with lower AOV.
Organic search brings buyers with higher repeat purchase rates.
Email shows fewer first orders but excellent LTV and retention.
Instead of guessing, you’ll know the type of value each source delivers: acquisition, margin, or lifetime growth.
ROI takeaway: Shift from “spend more” to “spend smarter.” Trace every marketing dollar and scale what really pays back.
3. Optimize the customer journey and checkout funnel
With the integration live, Usermaven processes key Shopify events, such asproduct_viewed, product_added_to_cart, cart_viewed, checkout_started, and checkout_completed.
You get a full journey: landing → product detail → cart → checkout → purchase.
Find and fix the highest-impact drop-offs
Identify steps and screens with the steepest exits.
Compare funnels by traffic source, campaign, and device.
See which channels bring high-intent visitors who reach checkout at higher rates.
Example: A jewelry brand sees high product views from Instagram, but a drop between “add to cart” and “checkout started.” They test shorter PDP copy, display shipping upfront, and add Shop Pay messaging. Conversion rate rises from 2.8% to 4.6% in 30 days, lifting overall Shopify ROI without new ad spend.
ROI payoff: Small UX wins at the right step compound into big revenue gains.
4. Discover which products drive the highest long-term ROI
Top sellers aren’t always top profit drivers. With Usermaven, you can connect product/SKU outcomes to acquisition channels and cohorts to learn which items create the best LTV.
Example:
Product A sells the most via Google Ads but yields lower repeat rates.
Product B sells fewer units but buyers from organic search reorder 2.1× more often.
Product C underperforms in unit sales but crushes margin via influencer bundles.
ROI benefit: Put budget behind the product + channel pairs that compound margin and LTV, not just volume. This is how Shopify ROI tracking becomes a growth lever, not a report.
5. Retain and re-engage customers using cohort and attribution insights
Segment by first-touch channel, campaign, product purchased, and purchase frequency. Understand reorder windows, discount sensitivity, and the messages that reactivate lapsed buyers.
Example: Email may drive fewer first purchases than paid social, but its repeat order rate and AOV growth are superior. A skincare brand prioritizes email-led replenishment flows to cohorts proven to reorder within 28–35 days. Result: a sustained LTV lift and healthier blended ROAS.
ROI benefit: Retention spend multiplies lifetime value when it focuses on high-yield cohorts identified by attribution and journey data.
How to set up the Shopify Usermaven integration
Getting started with the Shopify Usermaven integration takes just a few minutes, no developer needed.
Here’s a quick overview:
Connect your Shopify store to Usermaven. Log in to your Usermaven account, navigate to ‘workspace setup’, and copy your unique tracking pixel.
Add your tracking pixel to Shopify. Paste your snippet inside your store’s theme code so Usermaven can begin collecting data automatically.
Enable key event tracking. Set up customer event tracking (like product views, add-to-cart, checkout started, and checkout completed) to power full-funnel attribution and ROI insights.
Once connected, Usermaven immediately begins capturing real-time data from your Shopify store. It helps you see which marketing efforts truly drive conversions, revenue, and repeat customers.
💡 Tip: For a detailed, step-by-step setup guide, including where to paste your tracking pixel and event snippets, visit the Shopify integration help doc.
Track every customer action that matters (for full-funnel visibility)
Once connected, the Shopify Usermaven integration automatically tracks every key event in a shopper’s journey. This allows brands to see not only who purchased but also how they got there.
Usermaven records events like:
Product viewed: See which items attract the most attention and how discovery leads to add-to-cart actions.
Product added to cart / removed from cart: Measure buying intent and identify drop-off points.
Checkout started: Track how many shoppers progress to purchase.
Checkout address & contact info submitted: Pinpoint friction before payment.
Checkout completed: Attribute final sales to the right campaigns.
Each of these events feeds into Usermaven’s multi-touch attribution, funnel analytics, and ROI dashboards, giving Shopify brands unmatched clarity at every step of the customer journey.
See Usermaven in action
Book a free demo and discover how powerful analytics can grow your business.
*No credit card required
Turn data into profit, not guesswork!
Shopify brands that track every click, view, and checkout gain a real edge. In this blog, we explored how the Shopify Usermaven integration helps brands see true marketing performance, improve attribution, and boost ROI through smarter, data-driven insights.
With all that insight, one thing becomes clear: data only matters when it’s understood. As a marketing attribution platform, Usermaven helps ecommerce brands connect Shopify events, customer journeys, marketing touchpoints, and revenue outcomes. It brings the full path to purchase into focus, so you can see what drives sales and grow revenue with confidence.
Ready to see it for yourself? Sign up now for your free trial with Usermaven and discover how better data leads to better profits.
FAQs
1. Can Usermaven help identify which traffic sources bring high-LTV customers?
Yes. Beyond tracking sales, Usermaven links every purchase back to its acquisition channel. This helps Shopify brands identify which marketing sources deliver customers with the highest lifetime value (LTV), not just first-time sales.
2. Does Usermaven integrate with Shopify apps and other ecommerce platforms?
Absolutely. Usermaven automatically captures UTM parameters and tracks campaigns from sources like Google Ads, Meta (Facebook/Instagram), and other marketing channels. It also integrates seamlessly with WooCommerce, giving store owners the same level of attribution accuracy and customer journey tracking across platforms.
3. How accurate is Usermaven’s revenue attribution compared to other Shopify analytics tools?
Usermaven uses server-side and client-side event tracking to maintain high revenue attribution accuracy, even when cookies are blocked or users switch devices. This makes it more reliable than most browser-based ecommerce analytics tools.
4. Is Usermaven GDPR and privacy compliant for Shopify stores?
Yes. Usermaven supports privacy-compliant attribution measurement and cookieless tracking approaches, helping Shopify merchants maintain attribution visibility while staying compliant with GDPR and other privacy regulations.
5. What is the attribution lookback window in Usermaven for Shopify stores?
Usermaven offers a 180-day attribution lookback window, which is much longer than Shopify’s default analytics or most third-party tools. This extended window helps Shopify brands accurately track conversions from long purchase cycles, like customers who discover a product today but buy weeks later.
Ruler Analytics pricing is based on monthly website traffic and the level of measurement a business needs. Current plans start at $400 per month for up to 10,000 visits and rise to $2,000 per month for more than 100,000 visits. The final cost can also depend on product, data, and integration requirements. Features such as […]
A shopper may discover a product through a Meta ad, return through Google Search, open an email, and complete the order by visiting the store directly. Every platform may claim credit for the same sale. Without reliable ecommerce attribution, teams cannot tell which interaction created demand, which one assisted the decision, and which one simply […]
An agency onboards a new ecommerce client and realizes the attribution tool built for their B2B SaaS clients does not handle Shopify data at all. Two months later, a different client asks for white-labeled reports, and the same platform cannot produce them either. Most attribution tools help marketers see performance. Agencies need tools that help […]