Ask three measurement models which channel drove last quarter’s pipeline and you might get three different answers. Attribution credits paid search, a marketing mix model points to LinkedIn, and a holdout test says retargeting barely moved the needle.
None of them is broken. Each model looks at marketing from a different angle, with different data and assumptions. If you understand how each one works, you can use the disagreements to make better budget decisions. Our guide to marketing measurement covers the basics of the discipline. This article goes a level deeper into the models themselves.

Key takeaways
- Marketing measurement models estimate how marketing activities contribute to outcomes like signups, pipeline, and revenue.
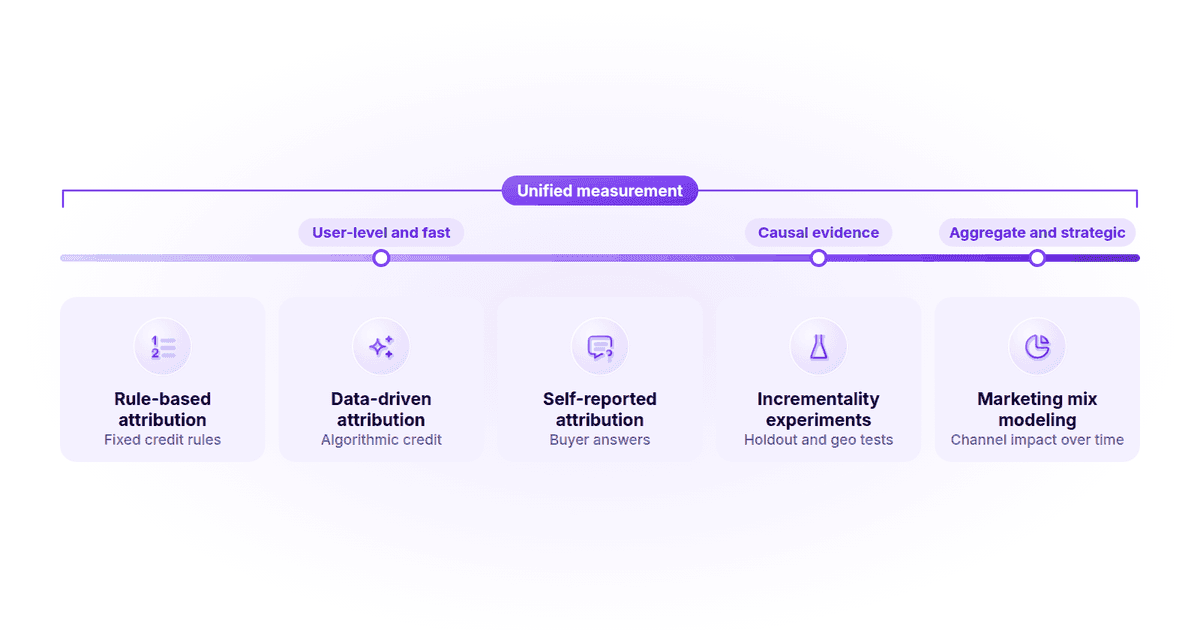
- The main models are rule-based attribution, data-driven attribution, marketing mix modeling (MMM), incrementality experiments, and self-reported attribution.
- Each model answers a different question. Attribution explains journeys, MMM explains channel impact at an aggregate level, and experiments estimate cause and effect.
- Unified measurement combines models, using experiment results to calibrate MMM and attribution for day-to-day optimization.
- The right mix depends on your decisions, data volume, sales cycle, and budget.
What are marketing measurement models?
Marketing measurement models are analytical methods for estimating how marketing activities affect business outcomes. They turn data about spend, touchpoints, and conversions into an answer to a practical question, such as which channels deserve more budget or whether a campaign created conversions that wouldn’t have happened anyway.
Models differ in three ways:
- Level of data. Some work with individual user journeys, while others use aggregated totals such as weekly spend and revenue.
- Type of answer. Some assign credit, some estimate contribution, and some measure causal lift.
- Assumptions. Every model makes assumptions, whether that’s a fixed credit rule, a statistical relationship, or a comparison against a control group.
Note that “measurement models” also has a separate academic meaning in survey research, where it describes how questionnaire items measure concepts like brand loyalty. This article covers the marketing performance meaning.
The main marketing measurement models at a glance
| Model | Level | How it works | Question it answers | Speed |
|---|---|---|---|---|
| Rule-based attribution | User journeys | Splits credit across touchpoints using a fixed rule | Which tracked touchpoints were part of converting journeys? | Real time |
| Data-driven attribution | User journeys | Uses an algorithm to assign credit based on observed paths | Which touchpoints are associated with higher conversion likelihood? | Real time, after enough data |
| Marketing mix modeling | Aggregated data | Statistical model of how spend and other factors relate to outcomes over time | How much does each channel contribute, and where are returns diminishing? | Weeks to set up, refreshed periodically |
| Incrementality experiments | Test and control groups | Compares outcomes between exposed and unexposed groups | Did this campaign cause extra conversions? | Weeks per test |
| Self-reported attribution | Individual responses | Asks buyers how they heard about you | Which channels do buyers remember and value? | Real time |
| Unified measurement | Combined | Uses each model’s strengths to check and calibrate the others | What’s the most reliable overall view? | Ongoing program |
1. Rule-based attribution models
Rule-based attribution assigns conversion credit to touchpoints using a fixed, predefined rule. It works at the user level, so it needs tracking that connects ad clicks, website visits, and form fills to the same person or account.
The most common rules are:
| Model | How credit is assigned | Good for |
|---|---|---|
| First-touch | 100% to the first interaction | Understanding which channels create awareness |
| Last-touch | 100% to the final interaction before conversion | Understanding which channels close |
| Linear | Equal credit to every touchpoint | Seeing every channel that played a part |
| Time decay | More credit to touchpoints closer to conversion | Shorter consideration cycles |
| U-shaped | Most credit to the first and last touches, the rest split across the middle | Journeys where discovery and conversion touches matter most |
| Custom | Weights you define for stages or channels | Teams with a clear view of their buying journey |
Rule-based models are transparent and easy to explain to stakeholders. Their weakness is that the rule is a choice, not a finding. Change the rule and the results change. In Usermaven’s attribution model disagreement benchmark, first-touch and last-touch models named a different top channel in 17.0% of the 94 SaaS workspaces studied.
That’s why comparing several models side by side is more useful than picking one and treating it as the truth. For a detailed walkthrough of each rule, see our guide to marketing attribution models.
2. Data-driven attribution
Data-driven attribution replaces the fixed rule with an algorithm. It looks at the paths of people who converted and people who didn’t, then estimates how much each touchpoint is associated with a higher chance of converting. Google Analytics 4 offers this approach as one of its attribution models and builds a separate model for each advertiser and key event.
The advantage is that credit reflects your actual data rather than an assumption. The trade-offs are that the logic is harder to inspect, and the model needs enough conversion volume to produce stable results. Many B2B SaaS companies with a few hundred demos a quarter may not have that volume. Our guide to data-driven attribution explains the requirements in more detail.
Both rule-based and data-driven attribution share the same core limit: they only see touchpoints that were tracked, and they measure association rather than proving cause. Ad blockers, cross-device journeys, and privacy restrictions also create gaps, which is why many teams invest in cookieless attribution methods. Our article on challenges with attribution models covers these gaps in more depth.
Maximize your ROI
with accurate attribution
3. Marketing mix modeling
Marketing mix modeling (MMM) is a statistical method that estimates how each marketing channel contributes to an outcome, such as revenue, using aggregated data over time. Instead of following individual users, it looks at patterns. When LinkedIn spend went up in certain weeks, did pipeline follow, after accounting for seasonality, pricing changes, and other factors?
How MMM works
Most modern MMMs build in three ideas:
- Adstock (carryover). Advertising doesn’t only work in the week it runs. Meta’s Robyn documentation describes adstock as reflecting “the theory that the effects of advertising can lag and decay following an initial exposure.”
- Saturation (diminishing returns). Each extra dollar in a channel eventually produces less than the one before. Robyn’s analyst guide uses the Hill function to model this curve for each channel.
- Control variables. Seasonality, promotions, pricing, and economic conditions are included so the model doesn’t credit marketing for changes it didn’t cause.
Many newer MMMs, including Google’s Meridian, use a Bayesian approach. That means the model starts with “priors,” which are informed starting assumptions about each channel, and updates them with your data.
What MMM needs
MMM is data-hungry. Robyn’s guide states that an MMM “will need a minimum of two years of historical weekly data” for robust results, and recommends roughly one independent variable for every 10 observations. You also need enough variation in spend. If you spent the same amount on every channel every week, the model has nothing to learn from.
MMM is a strong fit for budget planning, offline channels, and situations where user-level tracking is limited. It’s less useful for daily campaign decisions because it works at a channel level and refreshes slowly. Our comparison of multi-touch attribution vs marketing mix modeling covers when each fits, and our MMM readiness guide helps you check whether you have enough data.
4. Incrementality experiments
Incrementality experiments measure what a campaign caused by comparing a group that saw it with a similar group that didn’t. The difference in outcomes is the incremental lift. Because the groups are designed to be comparable, experiments come closest to proving cause and effect.
User-level holdout tests
In a holdout test, a random share of the target audience is held back from seeing ads. Google Ads’ Conversion Lift works this way. It “measures the incremental number of conversions, site visits, and any other action directly driven by your ad.” Google lists requirements such as at least 1,000 observed conversions and a minimum campaign budget of $5,000, and recommends running studies for more than 14 days.
Geo experiments
When user-level holdouts aren’t possible, you can test by region. You run or pause a campaign in some markets and compare them with similar markets where nothing changed. Meta’s open-source GeoLift package supports this, using synthetic control methods that create an artificial comparison market from a blend of untreated regions.
Strengths and limits
Experiments give the strongest evidence of cause, but they take time, need enough volume to detect a real difference, and have an opportunity cost because the control group doesn’t see your ads. Most teams run them for big decisions rather than continuously. Our incrementality testing guide covers test design, and you can learn how to calculate incrementality and incremental ROAS from the results.
5. Self-reported attribution
Self-reported attribution asks buyers directly how they found you, usually with a “How did you hear about us?” field on a demo or signup form. It’s simple, but it captures things other models miss, such as podcasts, word of mouth, communities, and private shares on Slack or messaging apps.
For B2B SaaS, it’s a valuable cross-check. If buyers keep mentioning a podcast that your attribution data never shows, that’s a signal worth investigating. The limits are recall bias and inconsistent answers, so treat it as one input rather than a complete picture. Our guide to self-reported attribution shows how to set it up.
6. Unified measurement and how models work together
Unified measurement, sometimes called triangulation, combines several models so that each one covers the others’ blind spots. In a 2025 survey of 3,000 measurement professionals, BCG found that 46% of marketers use marketing mix modeling, incrementality testing, and multi-touch attribution together, but “only the leading marketers integrate these approaches, so that each informs the other and amplifies value.”
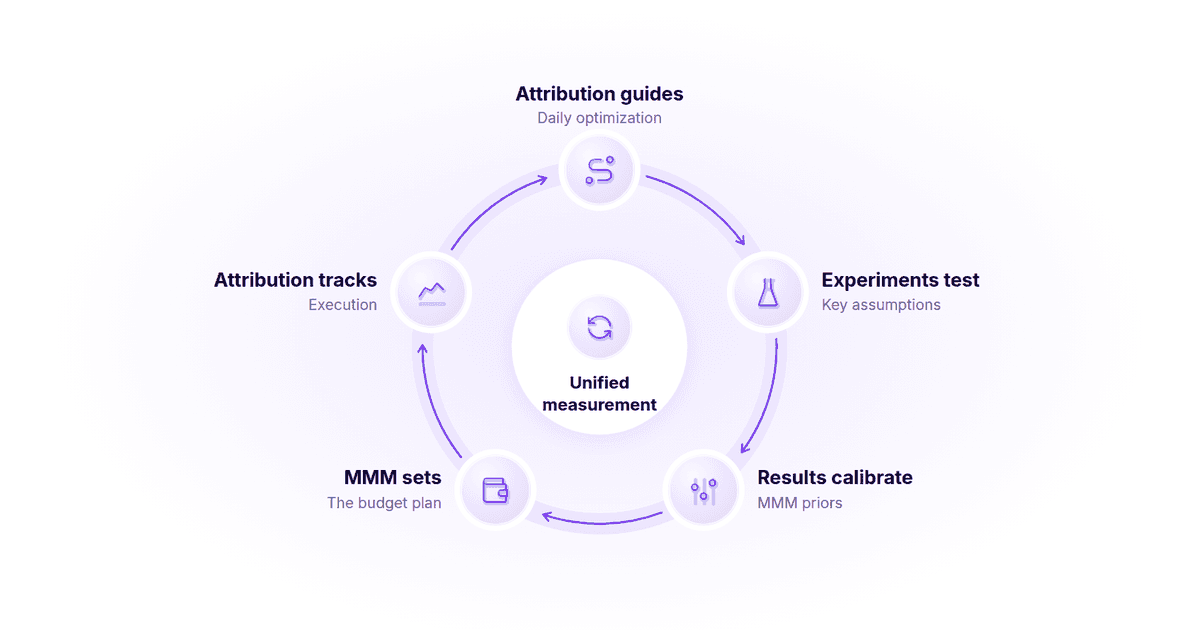
In practice, the models connect in a cycle:
- Attribution guides daily and weekly optimization. It shows which campaigns, ads, and journeys are associated with conversions and pipeline right now.
- Experiments test the biggest assumptions. When attribution says a channel is driving results, a holdout or geo test checks whether that’s causal.
- Experiment results calibrate MMM. Google’s Meridian documentation describes calibration as “the process of using experiment results and other domain knowledge to set channel-specific priors,” and provides a tool that turns incrementality experiments into calibrated ROI priors.
- MMM sets the budget plan. The calibrated model shows where returns are diminishing and how to split budget across channels.
- Attribution tracks execution. Once the new plan is live, attribution shows how campaigns perform day to day, and the cycle repeats.
When models disagree, don’t average them. Investigate why. Differences in conversion windows, audiences, and outcome definitions explain many gaps. Our guide to incrementality vs attribution includes a step-by-step reconciliation checklist, and our article on attribution discrepancies between tools explains common causes.
How to choose the right measurement model
Start with the decision you need to make, then check whether your data can support the model that answers it.
| If you need to… | Start with | Add when ready |
|---|---|---|
| Optimize campaigns and ads week to week | Multi-touch attribution | Experiments on your largest channels |
| Prove a channel creates new demand | Incrementality experiment | MMM calibrated with the results |
| Plan annual budget across many channels | Marketing mix modeling | Experiments to calibrate the model |
| Understand dark social and word of mouth | Self-reported attribution | Compare against attribution data |
| Connect marketing to pipeline and revenue | Multi-touch attribution with CRM data | Stage-based reporting and experiments |
What B2B SaaS teams should consider
B2B buying journeys bring a few extra challenges:
- Long sales cycles. Choose an attribution window long enough to capture early touches. A 30-day window can miss campaigns that started a six-month deal.
- Lower conversion volume. Fewer demos and deals make data-driven attribution, MMM, and user-level experiments harder to power. Rule-based multi-touch models and geo or on/off tests are often more practical.
- Multiple stakeholders. Several people from one account interact with your marketing, so account-level views matter.
- CRM outcomes. The conversion that matters is often an opportunity or closed-won deal, not a form fill. Your model needs CRM data to measure it.
Our guides to B2B marketing attribution and how to choose an attribution model go deeper on these points.
Common mistakes with measurement models
- Treating one model as the truth. Every model has blind spots. Use at least two views for important decisions.
- Confusing association with cause. Attribution shows which touchpoints were present, not what would have happened without them.
- Running MMM without enough data. Too little history or spend variation produces unstable results.
- Running tests that are too small. Underpowered experiments often show “no effect” even when one exists.
- Ignoring data quality. Missing UTMs, broken conversion tracking, and unmatched CRM records weaken every model.
- Averaging conflicting results. When models disagree, find out why before deciding.
How Usermaven supports your measurement models
Attribution is the foundation of most measurement programs because it’s the only model that shows, every day, which campaigns and journeys contribute to pipeline and revenue. Usermaven is an AI-powered marketing attribution platform built to make that foundation reliable for B2B SaaS teams.
- Compare every major attribution model. Usermaven’s multi-touch attribution includes first touch, last touch, linear, U-shaped, time decay, first and last non-direct, and custom models, so you can see where models agree and where they don’t. Lookback windows of up to 365 days fit long B2B sales cycles.
- Measure what matters to revenue. Full-funnel revenue attribution connects marketing touchpoints with HubSpot and Salesforce outcomes, and conversion goals can be marked by lead stage, such as MQL or SQL. Event Sources bring in conversions from tools like Stripe, Paddle, and webhooks.
- Keep your data trustworthy. The Measurement Trust Center scores data quality across collection, identity, integrations, delivery, and reliability, and flags issues before they affect your reports.
- Get answers faster. Maven AI lets you ask questions about your attribution data in plain English and shows which attribution model it used for each answer.
Usermaven also works alongside your MMM and incrementality tests. It provides the campaign-level, day-to-day detail those methods don’t capture, and gives you a consistent baseline to compare against when test results come in. Agencies use it the same way. See how Salt Marketing Group standardized attribution across more than 15 client accounts.

How strong is your
attribution game?
Take the quiz and see if you can truly connect every touchpoint.
Conclusion
No single marketing measurement model tells the whole story. Attribution shows how journeys unfold, MMM shows how channels contribute over time, experiments test what’s truly causal, and self-reported data fills in what tracking can’t see.
Start with reliable attribution connected to your CRM, add experiments for your biggest spend decisions, and bring in MMM when your data and budget support it. If you want to see how different attribution models describe your pipeline and revenue, book a Usermaven demo.
FAQs
What are the main types of marketing measurement models?
The main types are rule-based attribution, data-driven attribution, marketing mix modeling, incrementality experiments, and self-reported attribution. Unified measurement combines several of these into one system.
What is the difference between MMM and multi-touch attribution?
Multi-touch attribution uses user-level journey data to assign credit to individual touchpoints. MMM uses aggregated data over time to estimate how much each channel contributes to outcomes. MTA is better for daily optimization, while MMM is better for budget planning.
Which marketing measurement model is most accurate?
Incrementality experiments provide the strongest evidence of cause and effect, but they only answer the specific question tested. No model is accurate for every question, which is why many teams combine them.
How much data do you need for marketing mix modeling?
Meta’s Robyn documentation recommends a minimum of two years of historical weekly data. You also need enough variation in spend across channels for the model to estimate their effects.
What does calibrating an MMM mean?
Calibration means using experiment results to inform the model. For example, if a geo test shows a channel’s true lift, that result can be used to set the model’s starting assumptions for that channel, so its estimates line up with causal evidence.
Can small B2B SaaS companies use these models?
Yes, but start simple. Rule-based multi-touch attribution, self-reported attribution, and occasional on/off or geo tests are practical with limited volume. MMM usually makes sense later, once spend and history grow.
What is unified marketing measurement?
Unified marketing measurement combines attribution, MMM, and incrementality testing so each method checks and improves the others. Attribution handles daily optimization, experiments test causality, and MMM guides budget planning.

Written by
Imrana Essa
SaaS Marketing Lead
Imrana Essa is a marketing lead and content strategist with 8+ years of experience creating and leading content for B2B and SaaS brands. She specializes in marketing analytics, attribution, content strategy, and organic growth, translating complex marketing concepts into clear, actionable insights. Her work focuses on helping marketers understand performance, make data-informed decisions, and build strategies that contribute to sustainable growth.
All articles by Imrana →