Some are tiny and unconscious. Others are bold and deliberate. Together, they form a trail that says more about your customers than any survey ever could.
Clickstream data is that trail. It’s the difference between guessing what people want and actually seeing how they behave.
And tucked inside those digital footprints? Clues to intent, motivation, and the silent “why” behind the actions that define your customers’ journeys.
What is clickstream data
Clickstream data tracks every step, click, and path visitors take on your site, revealing the whole story behind each customer journey.
Think of it as a digital trail: an ongoing record of how people explore, decide, and interact. It’s a form of web analytics that shows you not just where someone went, but how they got there.
Every scroll, every pause, every quick backtrack adds another layer to the narrative. Assemble all those tiny moments, and you can see the journey unfold exactly as your visitors experienced it.
For instance, imagine someone shopping on an online store. They land on the homepage, search for sneakers, check out three different pairs, read the reviews, add one to their cart, then exit before checking out.
That entire sequence is a prime example of clickstream data in action. It’s the closest thing to standing behind a customer in a store and watching the choices they make in real time.
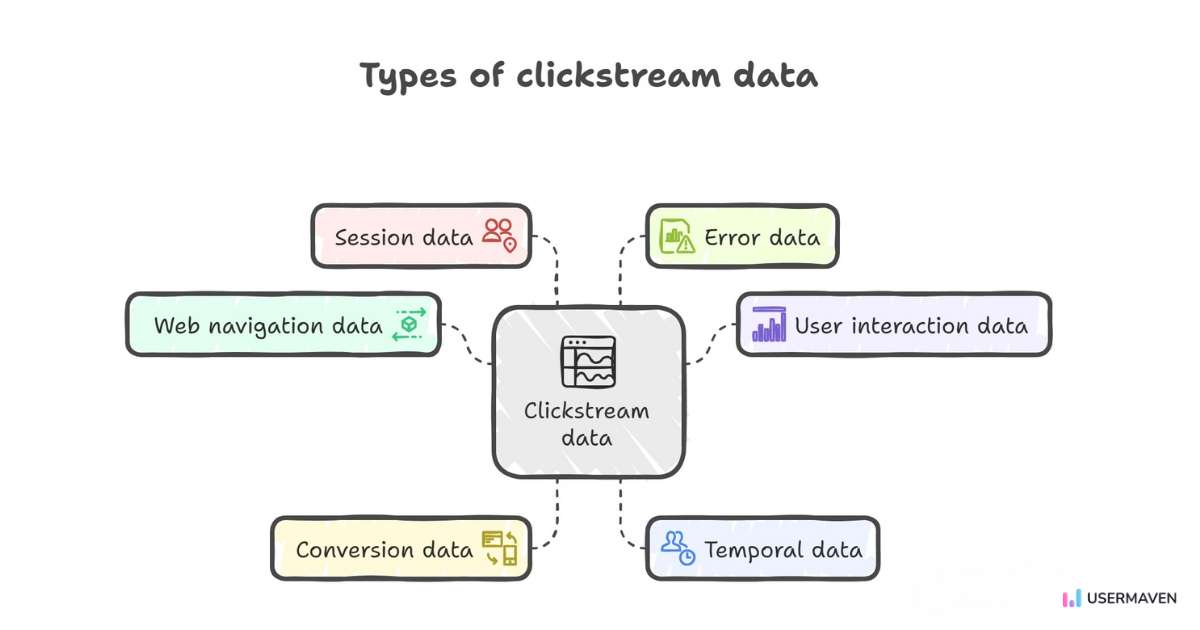
Types of clickstream data
Not all clicks tell the same story. Clickstream data comes in different forms, and each type offers a unique piece of the puzzle.
Here are the main types you’ll come across.
Web navigation data
This is the backbone of clickstream data. It shows the route a visitor takes across your site: where they start, what they explore, and where they decide to leave. Navigation data helps you see which pages pull people in and which ones push them away.
Examples
Referring URL: the source that brought the user to your site.
Visited pages: the stops made along the journey.
Click path: the sequence of clicks that formed the route.
This indicates how engaged your visitors truly are. It’s not just about clicks, it’s about how they interact with every part of a page. Understanding this layer helps you refine design, content placement, and calls-to-action.
Examples
Mouse movements: where the cursor hovers or pauses.
Here’s the payoff. Conversion data pinpoints the exact moments when visitors take the leap: from signing up to making a purchase. Tracking this helps you identify friction points and smooth out the path to “yes.”
Examples
Form submissions: completed sign-ups or inquiries.
Sign-ups: new accounts or newsletter opt-ins.
Transactions: purchases or payments made.
Temporal data
Timing changes everything. Temporal data shows when actions occur, helping you connect performance to factors such as speed, time of day, or seasonality. It’s invaluable for spotting patterns you’d miss otherwise.
Examples
Page load time: speed that can make or break engagement.
Timestamps: precise moments of activity.
Date and time of last login: frequency and recency of visits.
Session data
Sessions provide the broader context behind individual visits. By looking at how long someone stays, how much they explore, and what their journey looks like in one sitting, you can measure engagement on a deeper level.
Examples
Duration: total time a visitor spent with you.
Start and end times: the beginning and end of a session.
Every website has hiccups. Error data captures pain points such as pages that don’t load, broken links, and server failures. Fixing these issues quickly not only improves the experience but also protects conversions.
Examples
404 errors: missing or broken pages.
Network or server issues: failed responses or downtime.
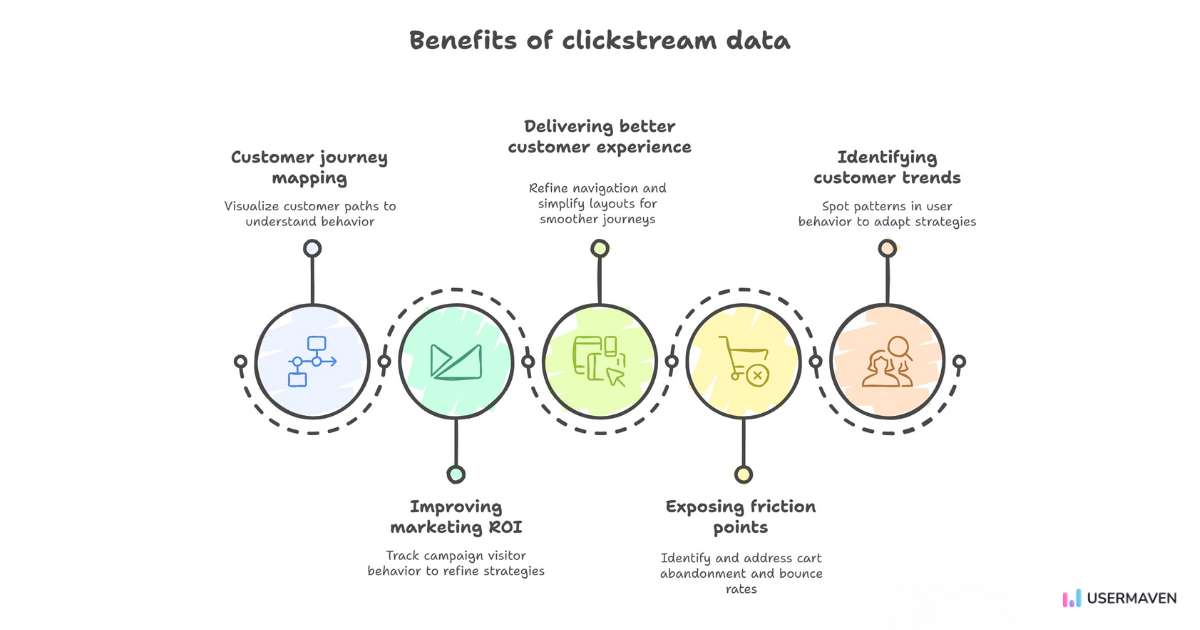
Benefits of clickstream data
Think of clickstream data as a window into your customer’s journey. It doesn’t just show you where people click; it reveals the story behind their choices.
When you zoom out and connect those stories, patterns start to emerge that can shape smarter decisions and stronger strategies.
Here are the biggest wins you get from it:
Customer journey mapping: See the full path your customers take, from the moment they land on your site to the moment they leave (or convert). Instead of guessing what’s working, you can actually visualize the journey and spot the detours.
Improving marketing campaign ROI: Not sure if your campaigns are driving the right traffic? Clickstream data gives you the receipts. By tracking how campaign visitors behave once they arrive, you can refine your approach to double down on what’s working and stop wasting budget where it’s not.
Delivering a better customer experience: By watching how users interact with your site, you can refine navigation, simplify layouts, and make the journey smoother. Happier users tend to stay longer, which usually translates to more conversions.
Exposing friction points: Are people abandoning carts, stalling on sign-up pages, or bouncing after one click? These friction points become clear in clickstream data, providing you with the opportunity to address them before they result in lost customers.
Identifying customer trends: Over time, patterns emerge. Mobile users may prefer one path, while desktop shoppers prefer another. Spotting these trends helps you adapt faster and stay aligned with customer behavior.
Harnessing clickstream data to drive growth
Collecting clickstream data is one thing. Using it to actually grow your business is where the magic happens. When you put these insights into action, you can shape smarter strategies, design better experiences, and ultimately guide more people toward saying “yes.”
Let’s look at three key areas where clickstream data makes a real impact.
Marketing strategy
Clickstream data takes the guesswork out of marketing. Instead of relying on broad assumptions, you can observe how different groups of visitors behave and tailor your campaigns accordingly.
Want to send messages that feel more relevant? Clickstream data enables you to personalize offers and recommendations based on what people actually engage with, rather than just what you think they might want. This allows for a data-driven marketing approach that speaks directly to your audience’s preferences.
And it’s not just about your customers. Clickstream data can also help you monitor the competition. By analyzing how visitors interact with your site compared to competitors, you get valuable insights into what works in your industry and how you can stay ahead of the curve.
Website optimization
Your website is your storefront. And if your visitors aren’t having a smooth, enjoyable experience, they’re not sticking around. Clickstream data reveals the friction points on your site that make users hesitate, bounce, or abandon their sessions altogether.
By analyzing the data, you can pinpoint where users drop off during key actions, such as signing up, making a purchase, or completing a form, and then make adjustments to encourage them to stay and engage.
Think about it like this: If people are bouncing after a few seconds, it’s a sign that something’s off. It could be anything from a confusing layout to slow page load times. In fact, 11% of users abandon carts due to slow website performance.
With clickstream data, you can identify precisely where drop-offs happen in the conversion funnel, allowing you to make tweaks that reduce bounce rates, boost click-through rates, and keep users engaged throughout their journey.
Ecommerce growth
For ecommerce, success hinges on the path to purchase. Clickstream data gives you a front-row seat to see which products attract attention, which get compared, and where customers hesitate before hitting “buy.”
Tracking user behavior throughout the journey allows you to pinpoint friction points, like cart abandonment or users stalling on specific product pages.
Want to refine your checkout flow or tweak a product page to drive more conversions? These insights give you the power to optimize key pages, nudging customers closer to completing their purchase.
By leveraging clickstream data to optimize your funnel and align it with buying patterns, you create a smoother, more intuitive shopping experience that drives higher conversions.
How to make clickstream data work for you
Clickstream data holds the key to unlocking real growth, but to achieve this, it’s essential to approach it strategically. If you’re just collecting numbers without a clear game plan, it’s easy to get lost in the sea of data. But when you know what to look for, it can transform the way you do business.
So, how do you make the most out of clickstream data? Let’s break it down.
Start with a clear purpose
Before diving into the data, ask yourself: What do I want to learn?
Whether you’re trying to understand behavior patterns, optimize your marketing spend, or see how users move through your funnel, your objectives will shape the way you analyze the data.
For example:
If you’re focused on user behavior, you’ll want to track which pages and actions keep people engaged.
If marketing performance is your goal, you’ll need to track how different channels and campaigns drive conversions.
To understand conversion paths, look at what’s driving people to make a purchase or sign up.
Clarifying your goals helps guide your analysis and ensures you’re asking the right questions.
Dig into the data and look for patterns
With your goals in mind, it’s time to delve into the data and see what it reveals. This is where you’ll find the hidden insights that reveal user behavior and potential opportunities for optimization.
Conversion funnels: Track the steps users take from landing on your site to completing a purchase.
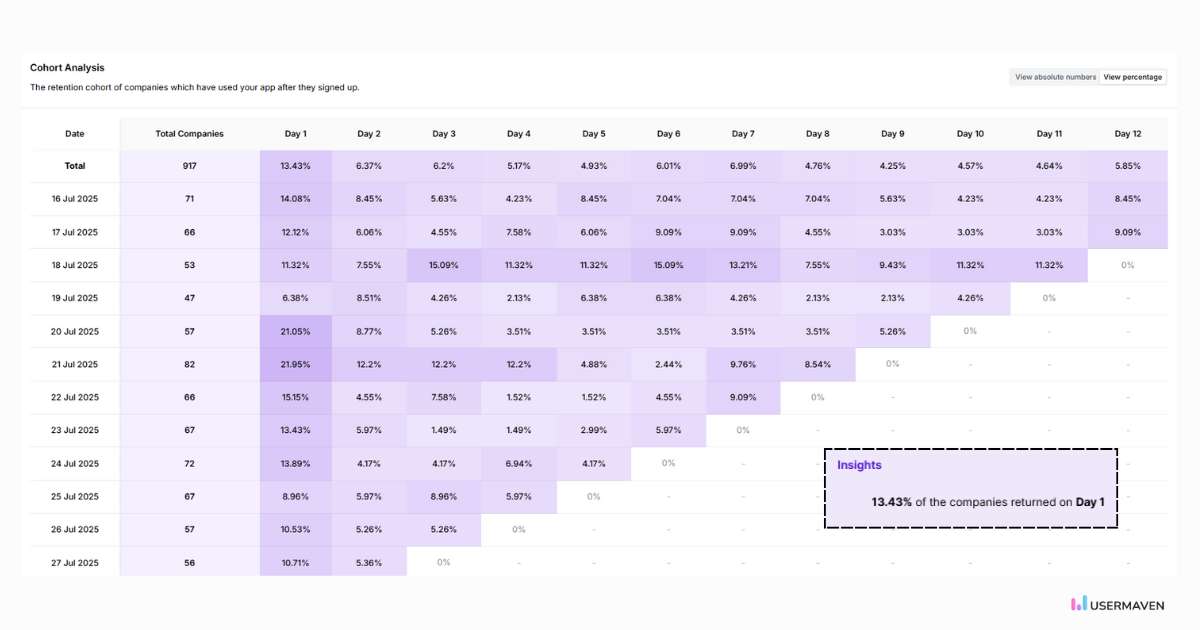
Cohort analysis: Group users with similar behaviors together to understand what different segments are doing on your site.
Trend spotting: Look for recurring behaviors or shifts in activity over time, such as frequent cart abandonment or a rise in mobile purchases.
Feature usage: Track how often specific features or tools on your site are used. Understanding feature adoption can guide decisions on where to improve, add, or emphasize certain features for better engagement.
When you analyze with intention, you’ll uncover trends and pain points that make the difference between just “tracking” and actually understanding your customers.
Make your data easy to use
Data’s only valuable if you can make sense of it quickly. So, how do you organize and present it in a way that’s clear and actionable? Here’s how:
User journey maps: These show exactly how visitors interact with your site. A map that tracks clicks, scrolls, and pauses can reveal where customers are getting stuck.
Real-time dashboards: Display your most important metrics in an easily digestible format, allowing you to monitor performance and make adjustments as needed.
Funnel visualizations: Use these to map out the user journey, showing where they’re dropping off and how to fix it.
When data is easy to understand, decisions become easier to make.
Leveraging clickstream data with Usermaven for smarter insights
Navigating through clickstream data can be overwhelming. There’s so much going on, and it’s easy to get caught up in the noise. But what if you could cut through that clutter and actually make sense of all that activity?
Usermaven helps you do just that. It simplifies the complexities of clickstream data, helping you understand how users interact with your website or app. Whether you’re looking to refine user journeys or make more informed decisions, Usermaven gives you the clarity you need to move forward with confidence.
Let’s take a closer look at how it works.
Automatic event tracking
Usermaven makes event tracking simple. You can track specific actions, such as clicks, form submissions, and video views, all without the need for complex setups.
By setting up custom events, you can gain a detailed understanding of specific actions that drive engagement and optimize those key touchpoints for improved results.
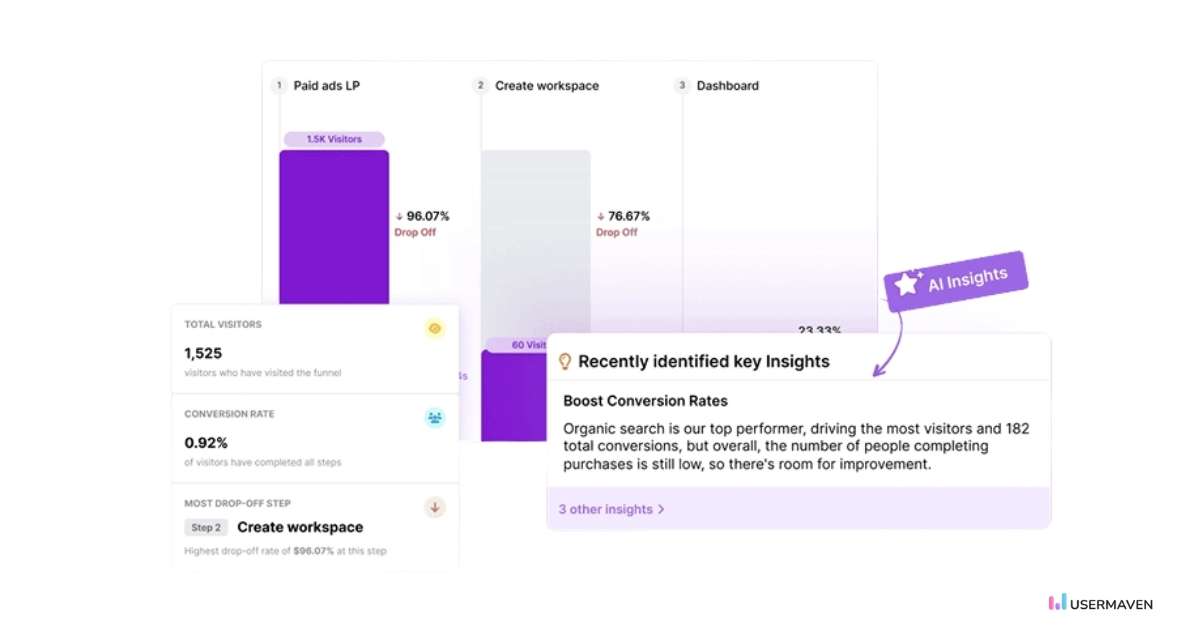
Funnel analysis
Funnels provide a step-by-step view of how users progress toward key actions, such as completing a purchase or signing up for a demo.
With Usermaven, you can build these funnels directly from clickstream data, enabling you to identify where drop-offs occur and where optimizations can have the greatest impact.
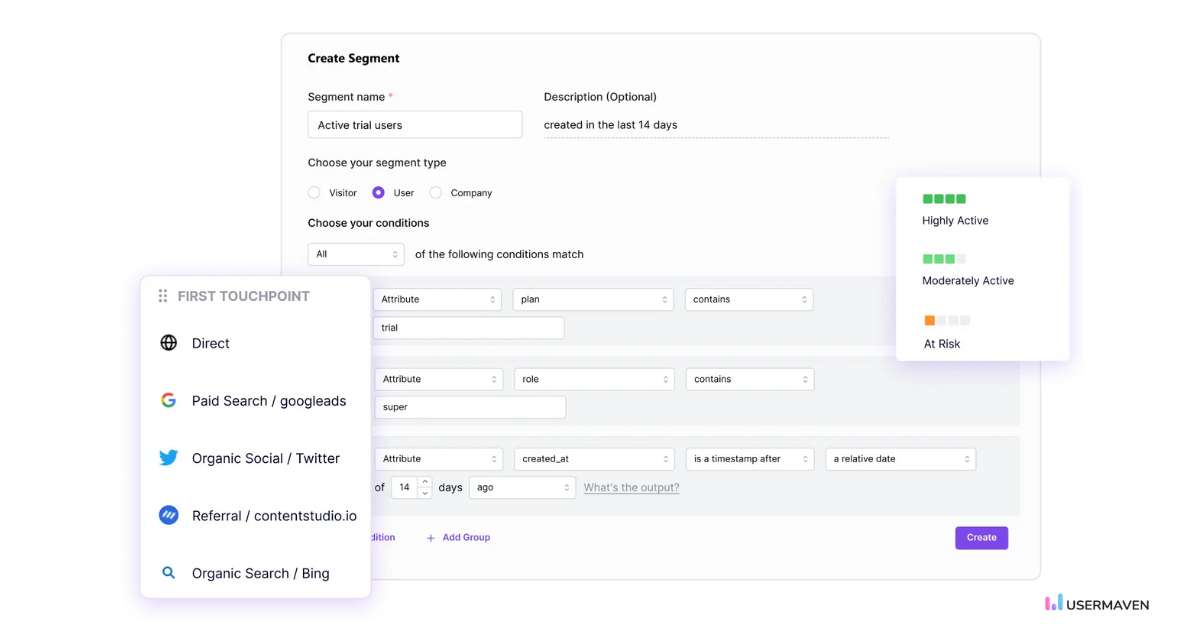
Advanced user segmentation
Usermaven’s segments help you break down your audience into segments based on their behavior.
Whether it’s users who click through to product pages or those who linger on your blog posts, you can identify patterns and create more targeted, personalized strategies for each group.
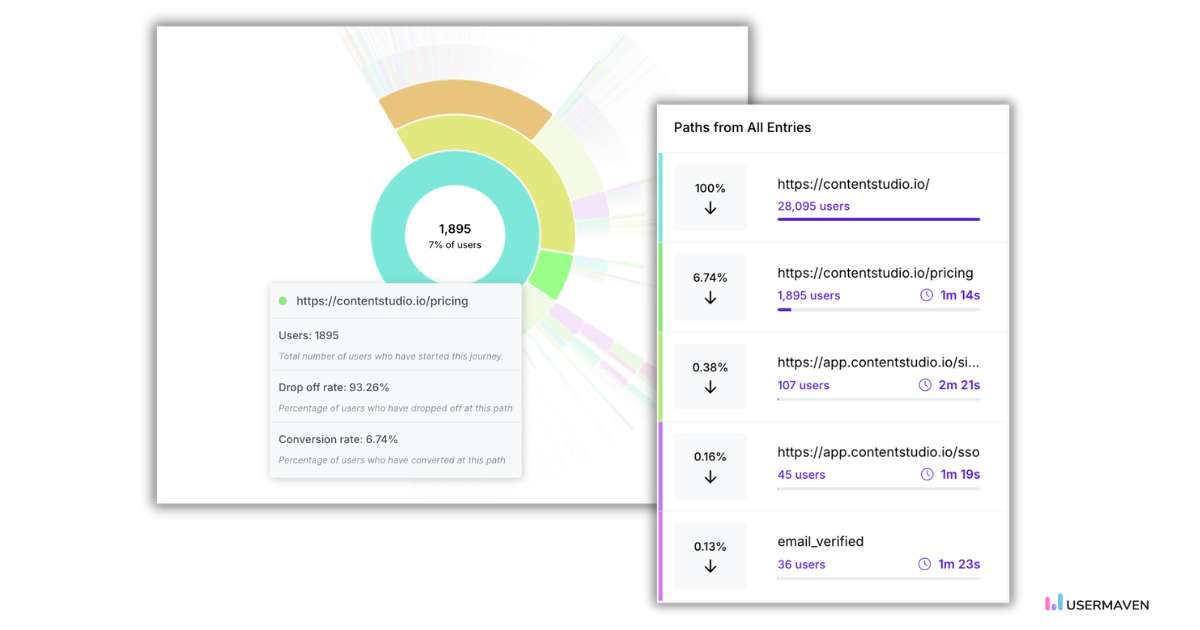
Journey visualization
Understanding your users’ journey is key to creating seamless experiences.
Usermaven’s user journey provides a clear visual representation of the entire customer path, helping you identify friction points that may hinder conversions and enabling you to optimize the user experience.
Behavioral insights & predictions
Usermaven doesn’t just tell you what happened; it helps you predict what might happen next.
With predictive analytics, you can understand future user behavior and adjust your strategy accordingly, staying one step ahead in crafting tailored experiences.
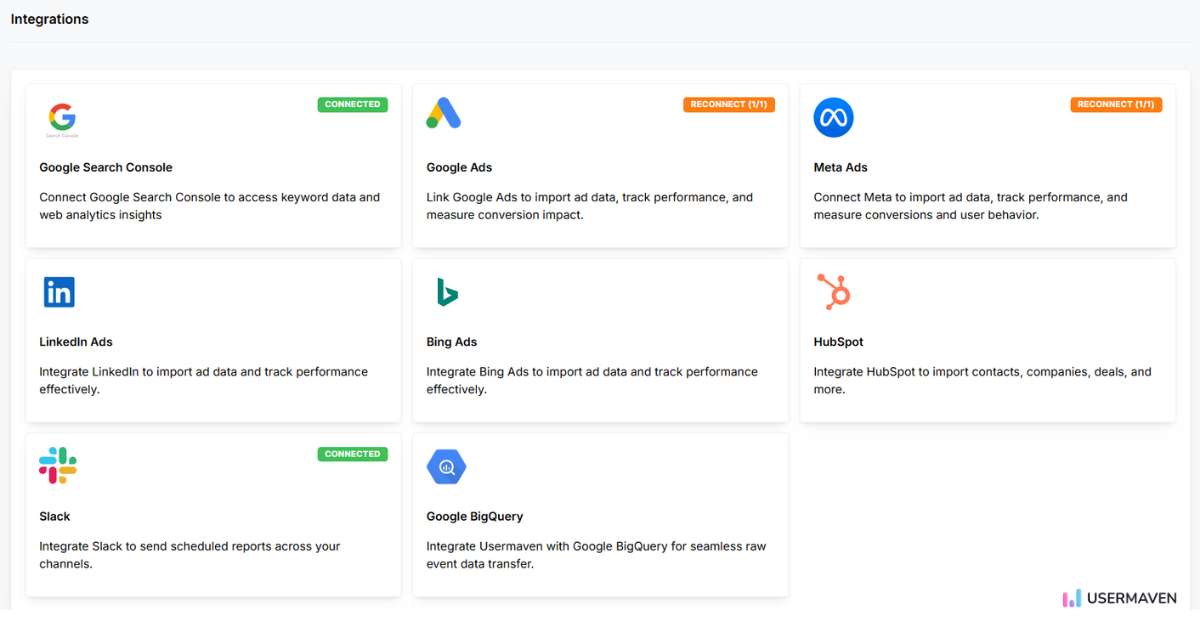
Seamless integration with existing tools
Usermaven integrates seamlessly with your existing tech stack, combining clickstream data with tools such as CRM, ads, and email marketing platforms.
These integrations provide a centralized view of all customer interactions, simplifying your workflow and making it easier to act on insights across platforms.
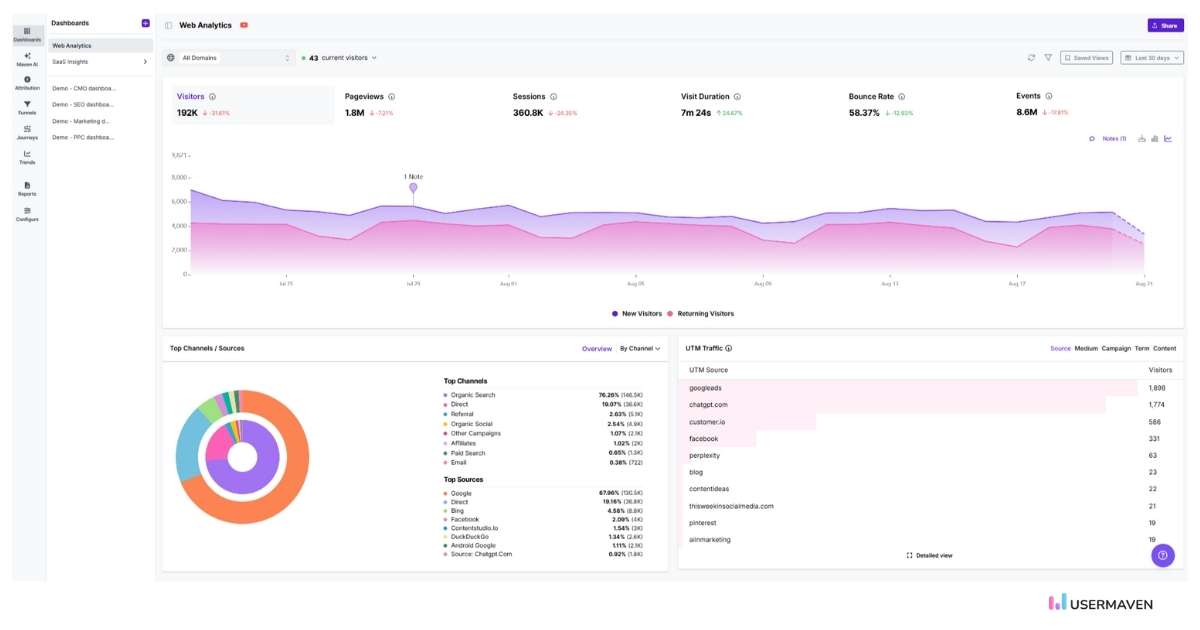
Actionable dashboards & reports
Instead of drowning in complex spreadsheets, Usermaven simplifies your clickstream data into clear, actionable reports.
These user-friendly dashboards provide the insights you need, without the overwhelm, so that you can make quicker, data-driven decisions.
Final thoughts
Clickstream data gives you a front-row seat to your customers’ behaviors, helping you see exactly where they engage, hesitate, or drop off. By understanding these behaviors, you can optimize user experiences and refine your marketing efforts.
With AI-powered analytics andattribution software like Usermaven, you can track and analyze clickstream data in real time, understand which channels drive conversions, and make data-driven decisions that improve performance.
Want to explore how it works? Book a demo today and take control of your customer journey!
Unlock insights that drive growth
*No credit card required
FAQs about clickstream data
1. What’s the difference between clickstream data and traditional web analytics?
Clickstream data is a form of web analytics that goes beyond traditional metrics. While web analytics tracks metrics such as page views and traffic, clickstream data captures every action a user takes on a site, from clicks to scrolls, providing a more granular view of user behavior and intent.
2. Can clickstream data help identify high-value customers?
Yes, by analyzing clickstream behavior, you can pinpoint customers who engage more deeply and are more likely to convert, helping focus efforts on high-value segments.
3. How does clickstream data help with reducing churn?
By analyzing where users drop off or lose interest, clickstream data reveals pain points, enabling you to refine your experience and retain customers longer.
4. Why is Usermaven the best tool for leveraging clickstream data?
Usermaven simplifies tracking and analyzing clickstream data, offering powerful features such as user journey mapping and real-time insights to optimize every stage of the customer journey, driving growth and engagement.
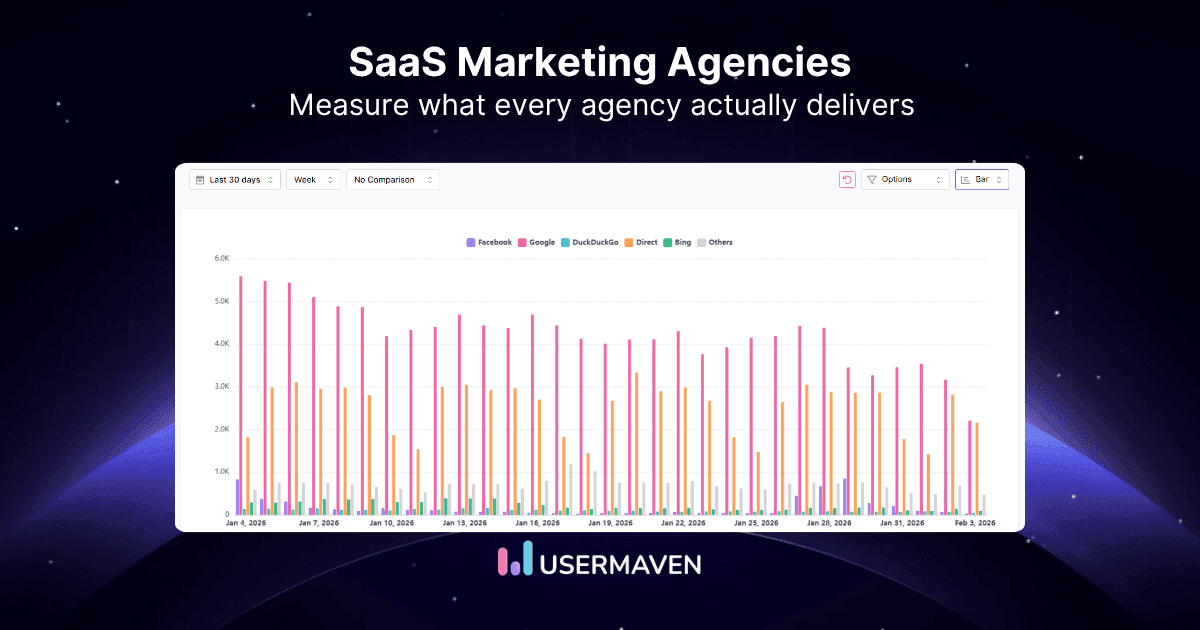
A typical SaaS buying journey has nothing to do with the classic seven touches. Today, the environment is so crowded that you need to build trust, stay visible across multiple channels, and show up everywhere your buyers are researching. Most SaaS teams do not have the resources or specialist depth to do all of this […]
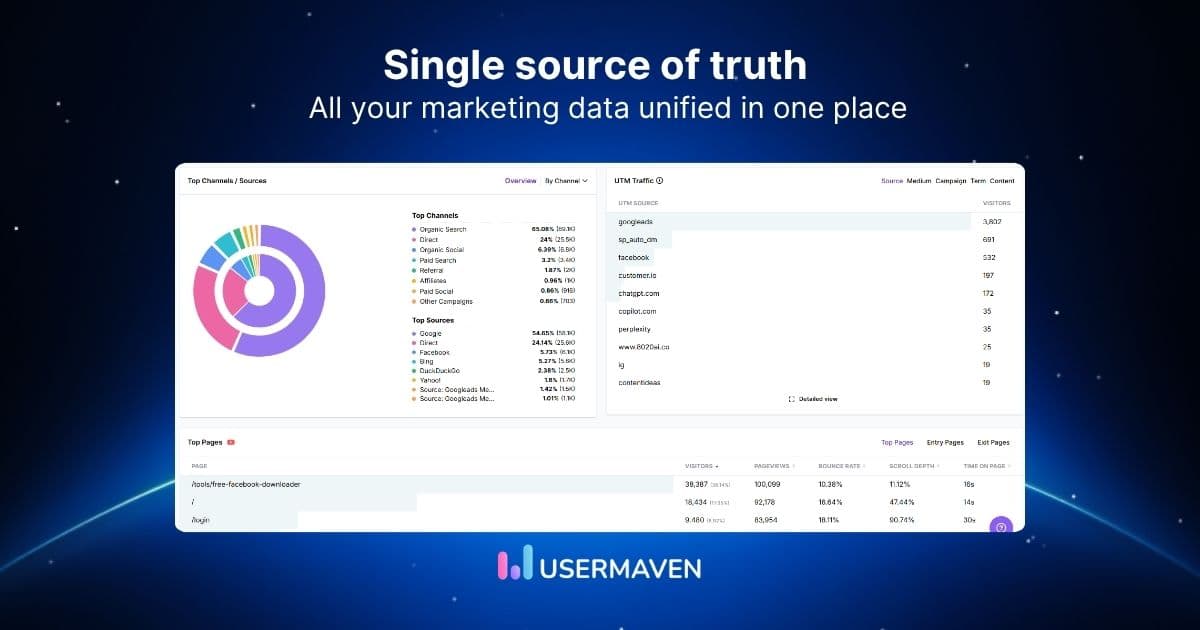
Monday morning. The marketing team opens five tools and still cannot agree on last week’s conversions. Google Ads, GA4, Meta Ads Manager, the CRM, and a revenue spreadsheet all show different numbers. The meeting ends with guesses, not decisions. A single source of truth is a shared, authoritative data layer where every important marketing and […]
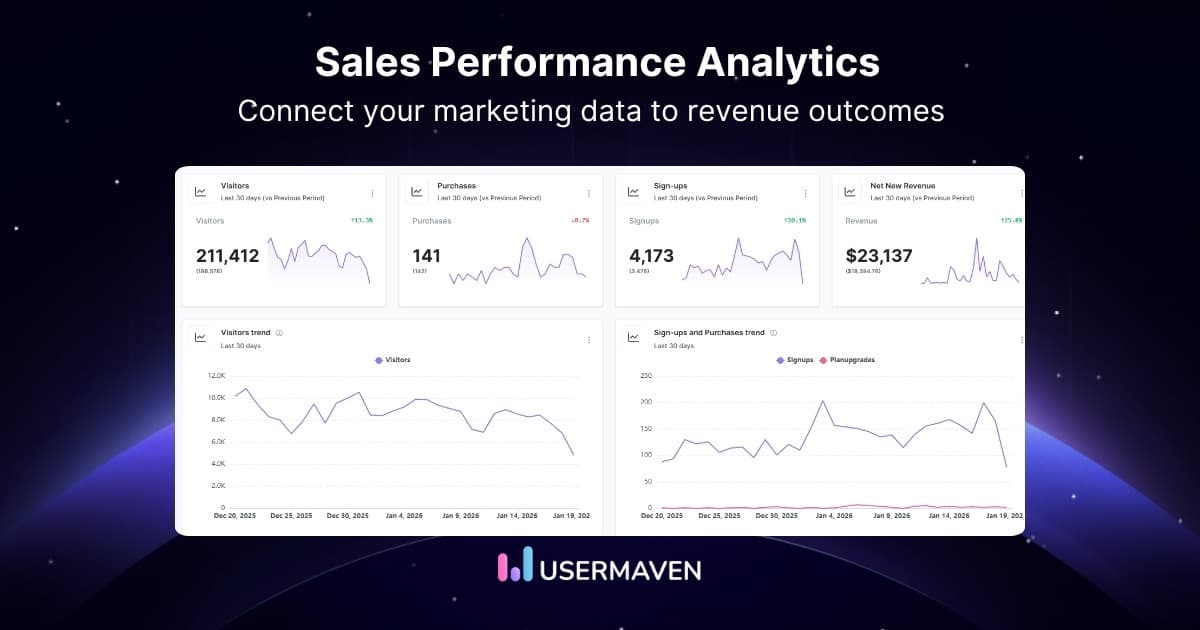
Sales teams in 2026 have more dashboards, more CRM data, and more reports than ever before. Most of them still cannot answer the question: which activities, channels, and behaviours are actually driving revenue? The problem is not a lack of data. It is a lack of the right measurement system to turn that data into […]