You might be thinking, why do some online stores skyrocket while others barely survive?
Well, running an e-commerce business today is as much about numbers as it is about products. The most successful brands don’t just launch campaigns and hope for the best. They track the right e-commerce KPIs and conversion metrics to measure performance, optimize strategies, and make better decisions.
But here’s the problem: with so many possible metrics out there, it’s easy to drown in data. What you really need is clarity on which e-commerce KPIs to track, how to benchmark them, and how to use them to boost revenue, loyalty, and efficiency.
In this guide, we’ll cover the main types of e-commerce KPIs, share practical examples, and explain how analytics tools can give your brand an edge.
What are e-commerce KPIs?
E-commerce KPIs (Key performance indicators) are measurable values that show how effectively your business is achieving key objectives. These goals can be boosting conversions, lowering acquisition costs, or keeping customers happy.
Think of KPIs like the dashboard of a car. You wouldn’t drive without checking your fuel gauge, speedometer, or engine light. In the same way, e-commerce KPIs give you real-time signals about sales, marketing, and customer performance so you know when to speed up, adjust, or fix issues before they stall growth.
Some KPIs are universal, like revenue or conversion rate, while others depend on your goals. For example, subscription stores often track churn rate, while fashion brands watch return rates closely.
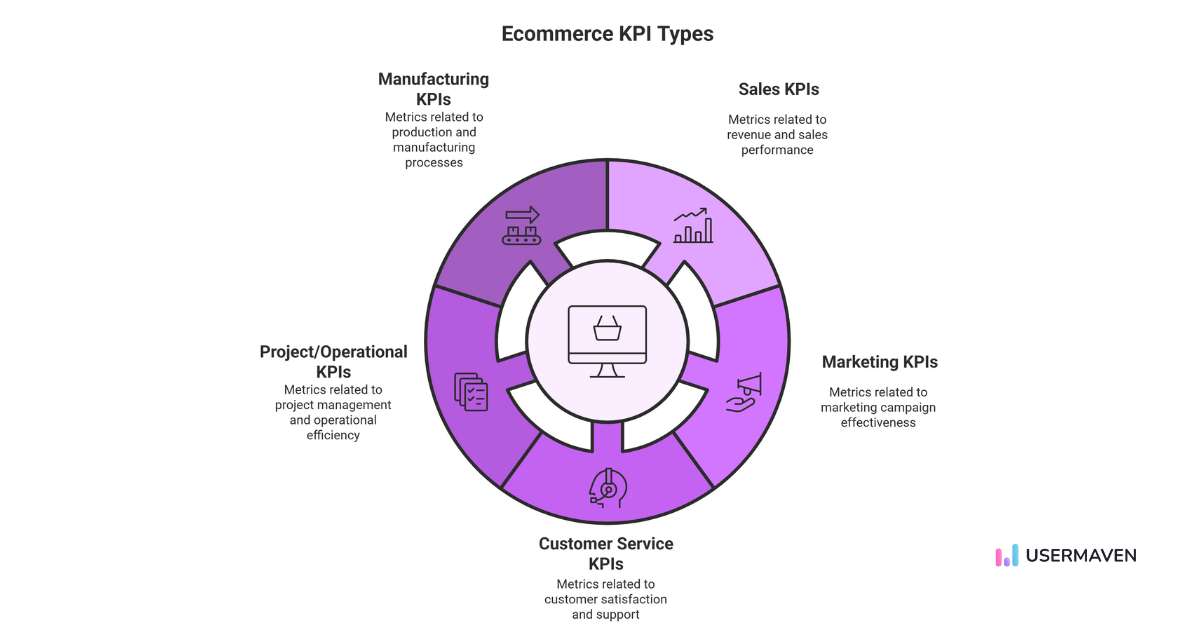
Types of e-commerce KPIs
To avoid getting lost in spreadsheets, it helps to group KPIs into categories. Here are the five major types of e-commerce KPIs to track:
Sales KPIs: Track transactions, revenue, and profitability.
Marketing KPIs: Measure traffic, engagement, and acquisition costs.
Customer service KPIs: Show satisfaction, retention, and support quality.
Project & operational KPIs: Evaluate timelines, processes, and team efficiency.
Manufacturing KPIs: Monitor production, supply chain, and inventory performance.
Each group gives you a different perspective, but together they form a complete picture.
Top e-commerce KPIs to track (with examples)
Here’s a detailed list of e-commerce KPIs every brand should monitor, broken down by category.
E-commerce sales KPIs
These tell you if your store is making money and how effectively it’s doing so.
Revenue: Total income from sales. The foundation of e-commerce performance.
Average order value (AOV): Total revenue ÷ number of orders. Useful for upselling and cross-selling strategies.
Conversion rate: % of visitors who make a purchase. A must-have in every e-commerce KPI dashboard.
Customer lifetime value (CLV): Predicted revenue from one customer over their entire relationship with your brand.
Sales growth rate: Measures the speed of revenue growth over time. Key for spotting momentum or slowdowns.
Number of transactions: Total purchases in a given period. Good for monitoring overall sales activity.
Customer acquisition cost (CAC): How much you spend to acquire each new customer. Should be lower than CLV.
Repeat purchase rate: % of customers who buy again. Shows loyalty and sales sustainability.
Refund and return rate: % of sales refunded or returned. High numbers can signal quality or satisfaction issues.
Let’s look at an example. Imagine your store brings in a CLV of $500 per customer, while your customer acquisition cost (CAC) sits at $80. On paper, that looks great; you’re spending far less to acquire customers than they spend over time. But now add another layer: your return rate is 25%. Suddenly, a quarter of those sales are coming back, eating into your profits.
This shows why tracking multiple KPIs together is so important, and revenue growth alone won’t tell the full story.
E-commerce marketing KPIs
These metrics show the impact of your e-commerce marketing analytics efforts.
Cost per click (z): Average cost paid for each click in paid campaigns.
Cost per acquisition (CPA): Average spend needed to acquire one paying customer.
Social media engagement rate: Likes, shares, comments, and clicks compared to impressions.
Organic search rankings: Positions of your key e-commerce keywords in search results.
Marketing ROItracking: Overall return compared to the total cost of all marketing activities.
Imagine you launch a new email campaign to 20,000 subscribers. Your open rate comes in at 30%, and 5% of those who clicked actually purchased. That single campaign adds $15,000 in sales at almost no extra cost.
At the same time, your paid ads are bringing in clicks at $3 each but converting poorly. Looking at these KPIs side by side tells you where to double down on email and where to rethink your spend.
E-commerce customer service KPIs
Your brand’s reputation, customer loyalty, and repeat revenue often depend on the quality of support you deliver. These KPIs help you measure and improve the digital customer experience.
Support ticket volume: Tracks how many issues are being raised; spikes may show product or process issues.
Escalation rate: % of issues that had to be passed to a higher-level agent or manager.
Refund and complaint rate: % of orders leading to refunds or official complaints.
Suppose your NPS score drops after a busy holiday season like the one driven by your Halloween email marketing templates. At the same time, your support ticket volume has doubled, and resolution times are longer than usual. This suggests that customers are frustrated with the slow support process, not the products themselves. By adding more temporary staff or improving self-service resources, you can bring scores back up and protect repeat purchase rates.
E-commerce project & operational KPIs
For e-commerce teams and agencies, these KPIs track efficiency and execution. They connect the day-to-day processes with customer outcomes and long-term growth.
Order fulfillment time: Average time from order placement to delivery.
Return rate: % of products returned. A high number may indicate product or fulfillment problems.
On-time delivery rate: Shows reliability in meeting promised delivery windows.
Campaign performance against deadlines: Tracks if seasonal promotions or launches stay on schedule.
Stockout rate: % of times products are unavailable when customers want to buy.
Backorder rate: % of orders delayed because of stock shortages.
Order accuracy rate: % of shipments delivered without errors or missing items.
Warehouse picking accuracy: Measures how often items are picked correctly from inventory.
Supply chain cost per order: Total logistics and handling costs divided by the number of orders.
Employee productivity rate: Tracks the efficiency of team members or fulfillment staff.
Let’s say you’re running a seasonal campaign. Traffic surges, but your stockout rate spikes and fulfillment times creep up. Looking at campaign data side by side with operational KPIs shows a clear pattern: marketing brought in demand faster than inventory could handle. AI Inventory planning tools like Prediko help solve this by forecasting demand and setting smarter reorder points, so your campaigns don’t outpace supply.
Without connecting these insights, you might assume the campaign underperformed when in reality the bottleneck was in operations.
Manufacturing KPIs for e-commerce
For product-based e-commerce brands, manufacturing KPIs play a big role in keeping operations smooth. These metrics ensure that what you promise online matches what you can deliver.
Production volume: Number of units produced in a set period.
Production downtime: Hours lost due to equipment failure or other delays.
Yield rate: % of products made without defects on the first attempt.
Manufacturing lead time: Time from order to finished product.
Cost per unit: Total manufacturing cost divided by number of units produced.
Capacity utilization: How effectively manufacturing resources are used.
Defect rate: % of products that don’t meet quality standards.
For example, if your defect rate climbs while your lead time increases, it’s a signal that production inefficiencies are affecting customer delivery timelines. Monitoring these KPIs alongside sales and inventory helps prevent bottlenecks and keep customers happy.
E-commerce KPI benchmarks: what’s ‘good’?
KPIs only matter if you know what success looks like. Industry benchmarks give you context, but keep in mind they vary by niche. Here’s a quick snapshot of what’s considered average vs. strong performance:
KPI
Typical benchmark
High performance target
Notes
Conversion Rate
~2:3% globally; up to 6.8% for some verticals
5%+
Varies by industry and device
Cart Abandonment Rate
~70% average
Under 60%
Luxury and jewelry see 80%+
ROAS (Return on Ad Spend)
~2.9× average
4:5×
Varies by margin; some platforms underperform
Repeat Purchase Rate
15:30% average
30:40%
Depends on product type and loyalty efforts
Return Rate
~16.9% average
Under 15%
Sub-10% reflects strong quality; over 20% needs attention
Remember: Use these figures as guideposts, not absolutes. Every industry, audience, and business model is different. What really matters is tracking your own progress and working to improve on your current baseline over time.
Why e-commerce analytics tools matter?
Manually tracking dozens of e-commerce KPI metrics in spreadsheets is painful and error-prone. That’s why most successful brands use analytics tools for e-commerce to:
Centralize data from sales, marketing, and support channels
Build customizable e-commerce KPI dashboards
Visualize KPI trees to connect the dots between efforts and outcomes
Benchmark performance against competitors
Make faster, data-driven decisions
Usermaven: The best analytics tool for e-commerce brands
Usermaven gives e-commerce brands a complete view of their performance, from sales and marketing to customer behavior. Each module is designed to deliver clarity and drive smarter growth:
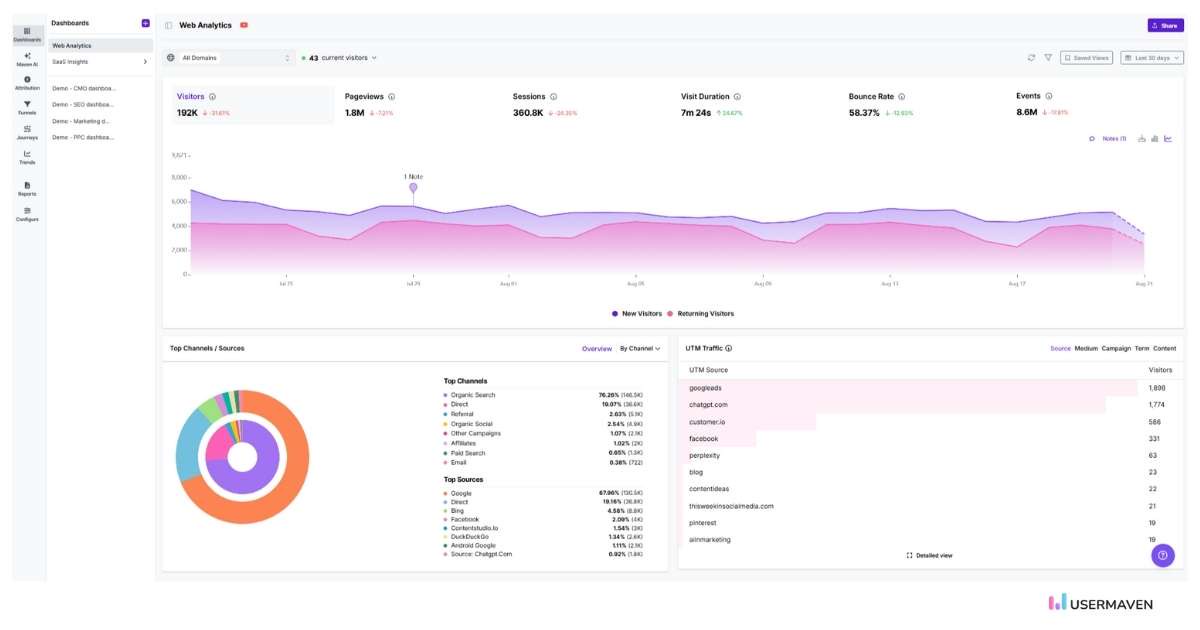
Dashboards
Track all your e-commerce KPIs in one customizable place. Build analytics dashboards for marketing, SEO, PPC, or executive reporting to keep your team aligned.
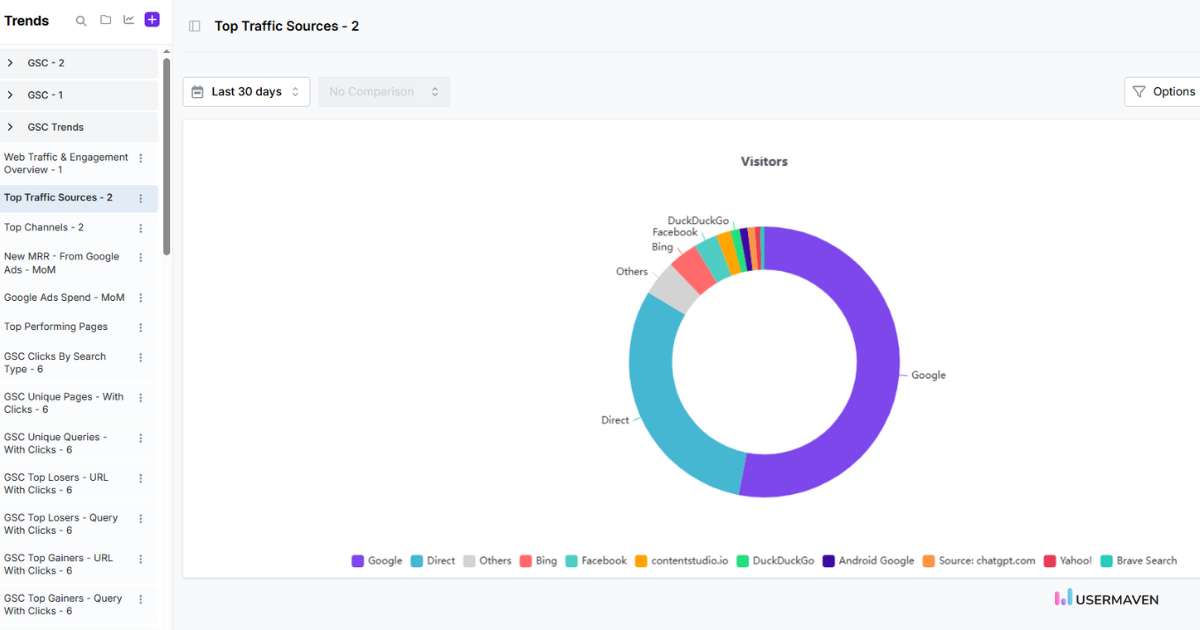
Trends
Monitor how trends and key metrics change over time. Spot growth patterns, seasonal shifts, and sudden performance dips before they impact revenue.
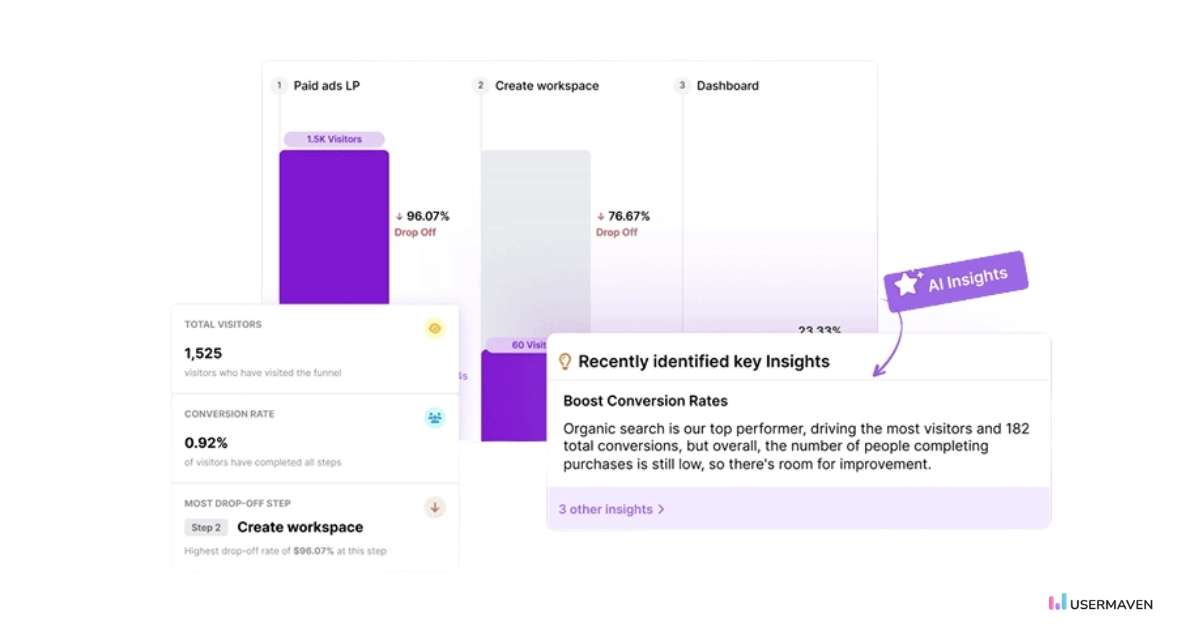
Funnels
Visualize the customer journey step by step through funnels. Identify where shoppers drop off and optimize your funnel to improve conversions.
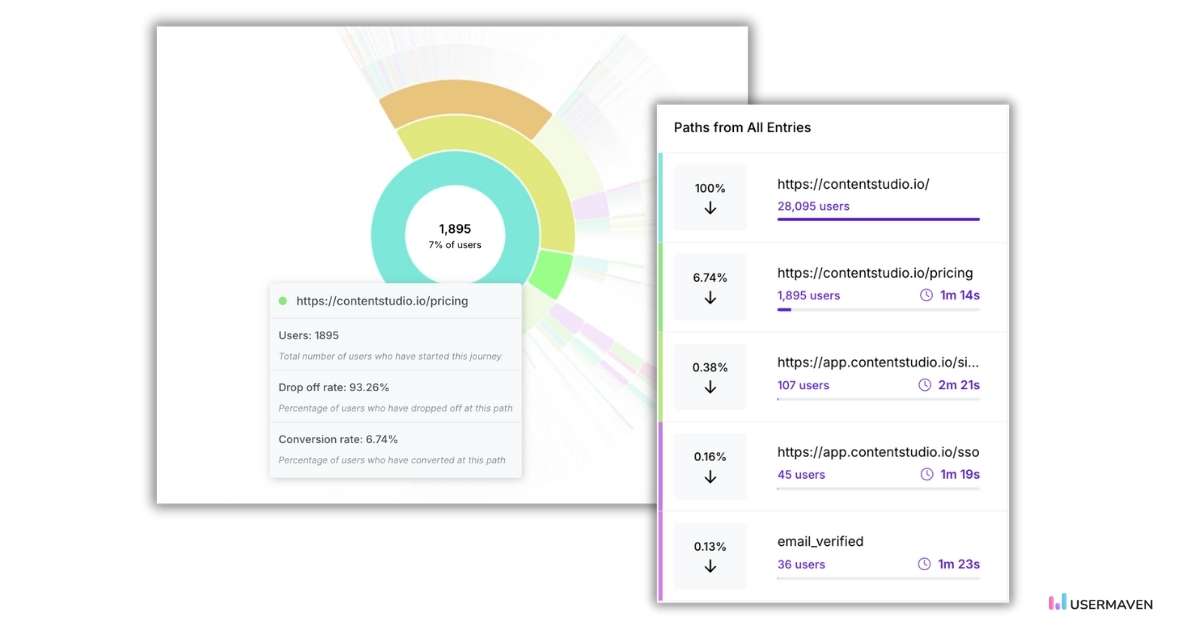
Journeys
See how users navigate your store in real time with user journeys. Discover friction points, unexpected paths, and opportunities to streamline the shopping experience.
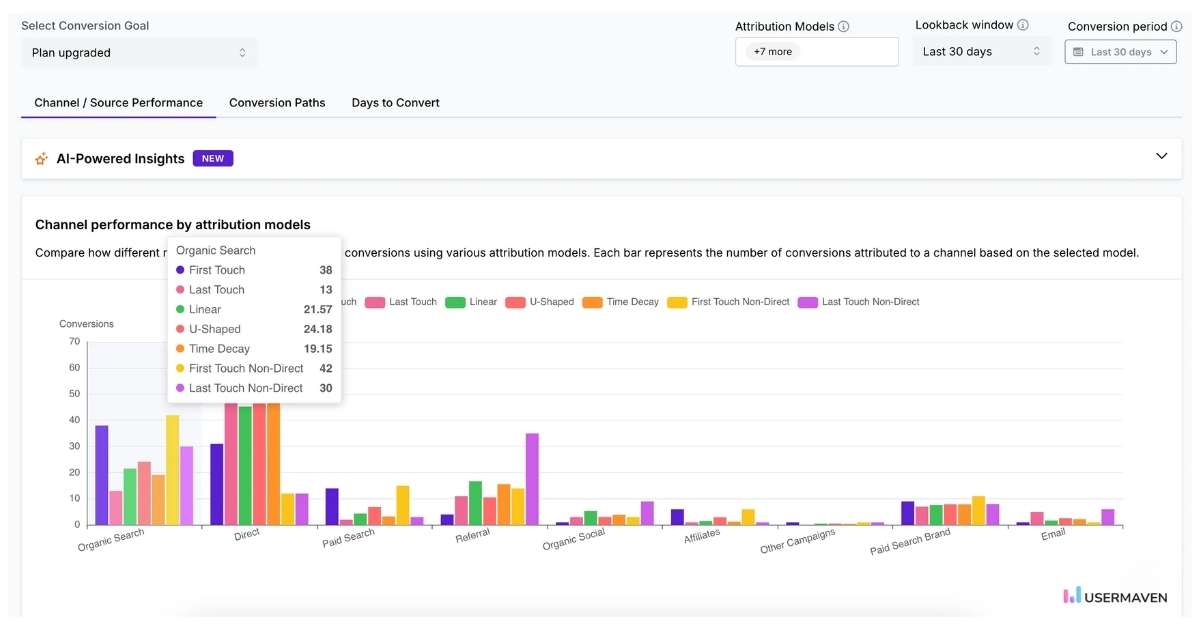
Attribution
Understand exactly which channels and campaigns drive sales with advanced attribution models. Move beyond last-click tracking to get a more accurate picture of your marketing performance.
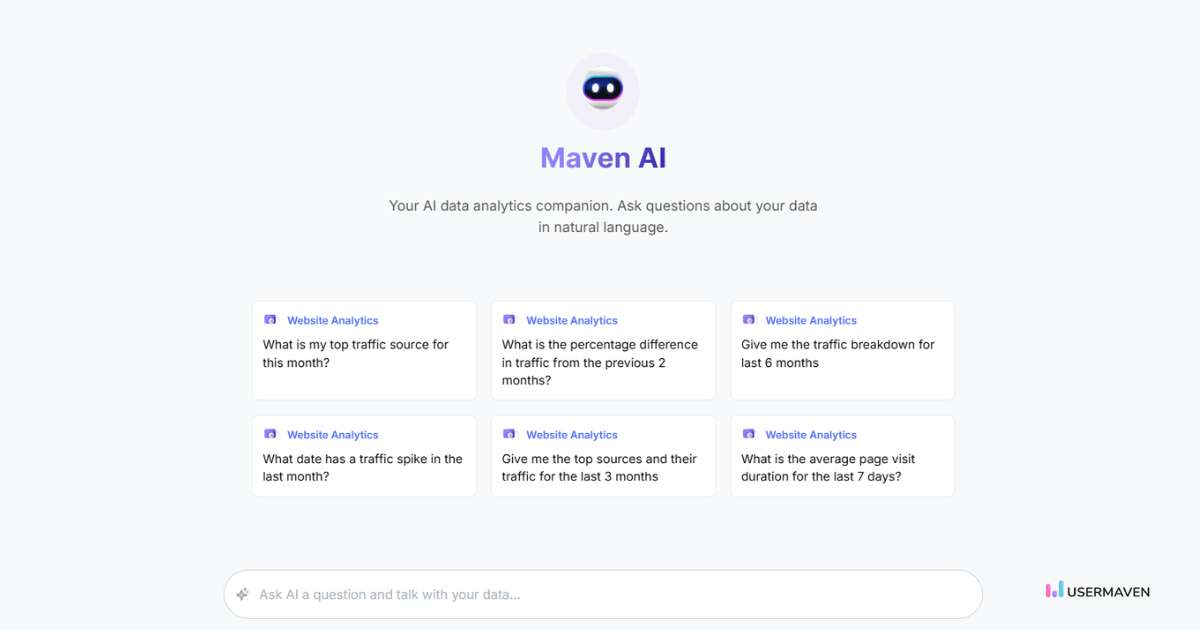
Maven AI
Use Maven AI to ask questions in plain language and get instant answers from your data. No complex queries, just clear and actionable insights that help you define conversion goals more effectively.
Retention & contacts
Manage customer data in the contacts hub, monitor retention trends, and build segments that drive loyalty and repeat purchases.
Together, these features make Usermaven a complete solution for e-commerce brands that want to grow smarter and faster.
The bottom line!
The e-commerce landscape is only getting more competitive. Brands that win are the ones that not only collect data but also know which e-commerce KPIs to track and act on.
By focusing on the right e-commerce KPIs and metrics across sales, marketing, customer service, and operations, you can spot opportunities, fix issues early, and drive sustainable growth.
So, build your KPI dashboard, align it with your goals, and equip your team with the right analytics tools. The numbers will tell the story; you just have to listen.
Drive business growth with AI-powered analytics
*No credit card required
Frequently asked questions
1. What are the basic KPIs of e-commerce?
The most common e-commerce KPIs include revenue, conversion rate, average order value (AOV), customer acquisition cost (CAC), customer lifetime value (CLV), cart abandonment rate, and return rate. These cover the basics of sales, marketing, and customer retention.
2. What are the 5 C’s of e-commerce?
The 5 C’s of e-commerce are Customers, Content, Convenience, Communication, and Conversion. Together, they highlight the need to attract the right audience, create useful content, make shopping simple, engage effectively, and drive sales.
3. What are the 4 Ps of KPI?
The 4 Ps of KPI usually stand for Perspective, Performance, Process, and People. They remind businesses to track KPIs that not only measure outcomes but also show how teams and processes contribute to success.
4. What are the 4 pillars of KPI?
The 4 pillars of KPI are Awareness, Consideration, Demand, and Advocacy.These pillars represent the key stages of the customer journey your KPIs should measure. They cover how people discover your brand, evaluate and purchase, and eventually build loyalty and advocacy.
5. How do you set realistic KPIs?
Start with your business goals, then pick a few metrics that directly measure progress toward those goals. Use historical data or industry benchmarks to set a baseline, and make sure each KPI follows the SMART rule: Specific, Measurable, Achievable, Relevant, and Time-bound.
6. How does Usermaven help with e-commerce KPIs?
Usermaven simplifies KPI tracking by bringing all e-commerce metrics into one platform. With dashboards, trends, funnels, attribution models, and retention tools, it helps brands monitor sales, marketing, and customer loyalty in real time. Plus, Maven AI makes it easy to ask data questions in plain language and quickly define conversion goals, making analytics more actionable.
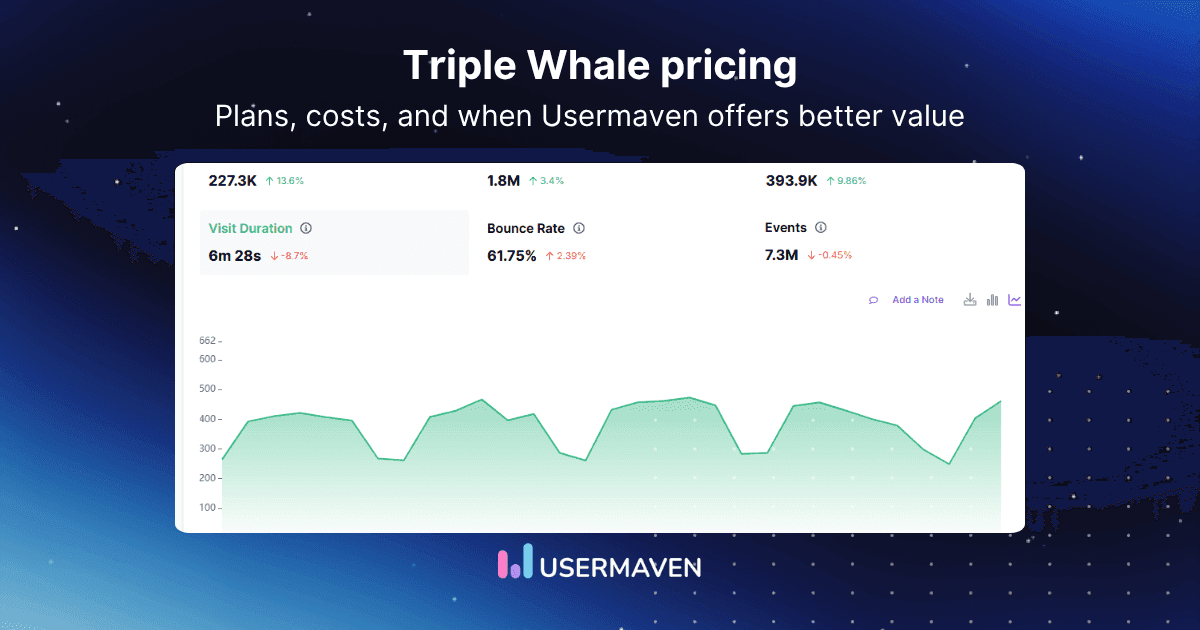
Triple Whale is a popular ecommerce analytics and attribution platform for Shopify and DTC brands. It helps teams track store performance, ad spend, attribution, and customer insights in one place. But its pricing isn’t a single flat monthly cost. Triple Whale pricing changes based on annual GMV, plan type, and the level of measurement a […]
A growing marketing team requests pricing from three attribution vendors. One quotes a number through an interactive calculator that jumps as they adjust a slider. Two others say to contact sales with no figure attached at all. Three conversations later, the team still does not know whether attribution software costs $80 or $8,000 per month […]
Marketers like to think of the buyer’s journey as linear: someone finds your website through Google, signs up for your newsletter, and buys your product. Except, in real life, it looks more like this: a new subscriber opens your welcome email while commuting to work, gets distracted, and forgets about your offer. A few days […]