You post on LinkedIn, engage with others, and maybe even run a few ads. But do you really know what’s working?
It’s easy to get caught up in likes and impressions, thinking they equal influence. Real influence shows up in your website traffic, engagement, and conversions, not just on your feed.
If you want to understand which posts, campaigns, or ads actually move the needle, you need data that connects the dots. So, let’s see how to analyze LinkedIn influence using actionable analytics and see what’s truly driving results.
Why analyzing LinkedIn influence matters more than ever
LinkedIn has evolved into a powerhouse for B2B lead generation, brand authority, and professional storytelling. But its native analytics only tell part of the story: impressions, clicks, engagement. They do not show what happens after someone lands on your website.
That’s why analyzing LinkedIn influence in terms of website user behavior and conversions is critical. When you measure LinkedIn website traffic, sessions, bounce rate, and attribution, you start to see which posts, ads, or content formats truly move the needle.
Three reasons to analyze your influence:
You want business outcomes, not vanity metrics. Engagement is useful, but it doesn’t prove impact. You need to see how LinkedIn traffic behaves on your site. Are visitors bouncing? Are they exploring? Are they converting?
You need to allocate time and spend where they matter. When you know which post types, themes, and campaigns drive the most qualified traffic and conversions. You stop spreading yourself thin and focus on what moves the needle.
You need proof. Whether you’re reporting to leadership or simply managing your own time, data gives you the credibility to say, “This is working. Here’s how we know.”
Grow smarter with privacy-first analytics
*No credit card required
The key metrics that define your LinkedIn influence
Not every metric deserves your attention. The real insights come from a few core indicators that connect engagement to conversions. Below are the important metrics you’ll find helpful inside Usermaven and LinkedIn analytics.
1) Visitors (from LinkedIn)
This is your starting point. Filter your traffic by source = LinkedIn to see how many people arrive from the platform. Track it weekly and monthly. Look for trends after new post formats, content themes, or campaigns.
Why it matters: If visitor volume isn’t growing, your distribution, creative, or audience targeting likely needs attention.
2) Sessions and pageviews
Sessions tell you how many visits occurred. Pageviews show how much content was consumed. Together, they paint a picture of depth.
What to look for:
Multiple pageviews per session suggest exploration and interest.
1–2 pageviews might be fine for landing pages, but not for educational content.
3) Visit duration
Longer session time usually signals relevance. If the average duration is low, the landing experience may not match what your post promised. Revisit your message match.
4) Bounce rate
A “bounce” is a session with no further interaction. Track this specifically for LinkedIn traffic.
What high bounce can mean:
The landing page doesn’t meet expectations
The audience targeting is off.
The content format isn’t aligned with intent.
5) New vs returning visitors
New visitors are great for reach. Returning visitors signal trust and intent. If your returning segment is growing from LinkedIn, you’re building a genuine audience.
6) Conversions
The metric that keeps you honest. Define conversions that matter: demo requests, sign-ups, trial starts, lead magnet downloads, purchases; whatever matches your funnel.
Tip: Use clear goals and consistent naming so you can filter them by source and campaign later.
7) ROAS (for ads)
For paid campaigns, you should measure Return on Ad Spend. ROAS ties revenue or value to ad spend so you can see which campaigns actually return profit.
Organic vs paid LinkedIn influence
One of the biggest blind spots many marketers have is not properly separating organic and paid LinkedIn performance. Both have their place in your strategy, but to optimize, you need to measure them side by side.
Organic influence
Organic influence comes through your free posts, articles, shares, and engagement. It builds awareness, trust, and brings visitors without direct cost. But organic alone has limitations: reach is capped, and attribution is often indirect.
Paid influence (Ads + sponsored content)
Paid campaigns let you push specific content, segment audiences, and scale reach. The trade-off is cost. But with the right tracking, paid campaigns can deliver predictable conversions and measurable returns.
Why you should compare them together
Holistic view: Many people see a post organically and later respond to a paid campaign (or vice versa).
Efficiency trade-offs: Organic may drive more awareness per dollar, but paid may bring more reliable conversions per dollar.
Optimization decisions: If a high-performing organic post can be boosted via paid, that’s a smart tactical move.
Attribution insights: By comparing them, you’ll know where to invest more in paid or amplify organic.
How to do it in Usermaven:
Filter source = LinkedIn to analyze organic. Connect LinkedIn Ads to bring in paid data. Then use attribution to compare which side drives more conversions.
How to analyze LinkedIn traffic performance using Usermaven
Now we’ll go step by step on how to make the most of Usermaven’s dashboards and analytics to measure LinkedIn traffic and interpret what’s working (and what isn’t).
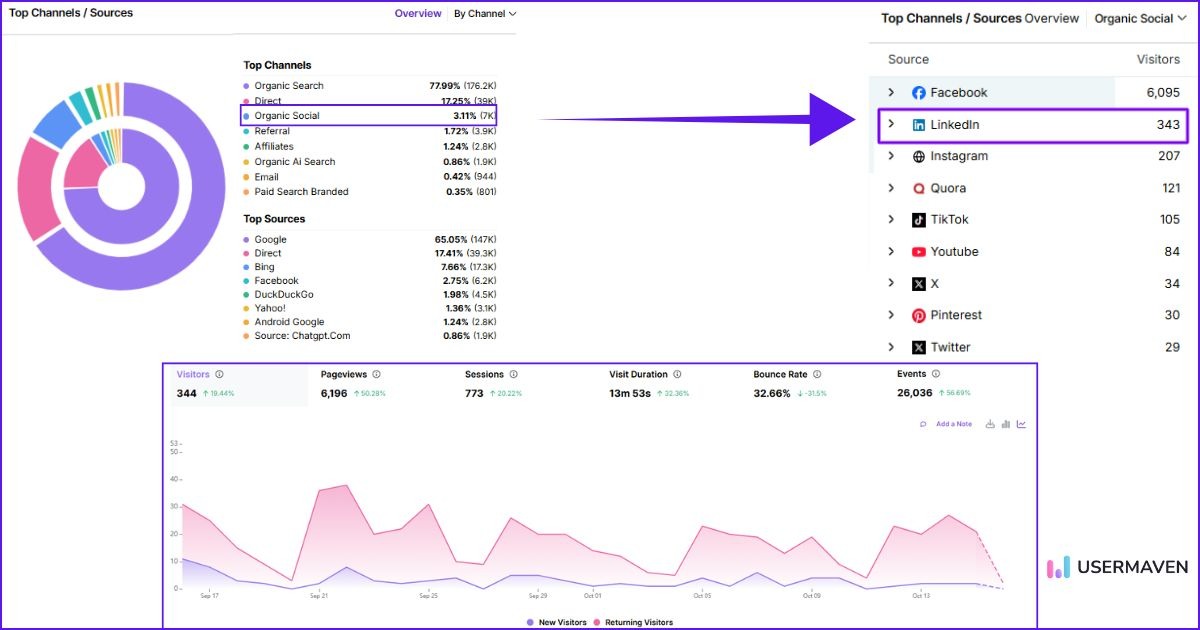
Step 1: Start with Top Channels / Sources
Open Top Channels / Sources in Usermaven. Choose Social, then select LinkedIn as your source. You’ll see a dedicated dashboard for LinkedIn traffic: visitors, sessions, pageviews, visit duration, bounce rate, and new vs returning.
What to scan first:
Is LinkedIn traffic growing week over week?
Is bounce rate trending down?
Are session durations increasing?
Which landing pages receive the most LinkedIn traffic?
Step 2: Segment LinkedIn traffic
Create a segment for LinkedIn visitors. Compare it to all traffic and to other social traffic. You’ll learn fast whether LinkedIn is sending higher-quality traffic.
Useful comparisons:
LinkedIn vs Twitter/X vs Facebook/Instagram
LinkedIn vs Paid Social (overall)
LinkedIn vs Paid Search (to set expectations)
Step 3: Map user journeys
Look at paths and funnels if you track them. Which pages do LinkedIn visitors view next? Where do they drop? Are there friction points you can simplify?
Quick wins:
Add a relevant call to action to the landing page.
Keep the message consistent between your LinkedIn post and the headline on your page.
Offer a short, helpful resource (checklist, template) aligned with your post topic.
Step 4: Compare content themes and formats
Track which topics and formats from LinkedIn bring the best on-site engagement. Do carousel posts drive longer sessions? Do “how-to” posts lead to more conversions? Create a small library of your top performers and iterate.
Step 5: Tie it to outcomes
End every review by asking, “What did we learn?” Then write one or two hypotheses to test next week. For example:
“Carousels on pain points → higher session duration. Try two new carousels with deeper tips.”
“Text-only posts drive traffic, but bounce is high. Test more specific landing pages.”
“Thought-leadership posts convert fewer visitors but more qualified. Test a product-driven CTA at the end.”
This is how you build a data-driven LinkedIn strategy, one small improvement at a time.
How to track LinkedIn ad performance and measure ROAS
If you run ads, you need clarity from click to conversion. Usermaven helps you get there with LinkedIn ads integration and accurate LinkedIn attribution. Here’s the clean setup that works.
Connect LinkedIn Ads to Usermaven (once)
The setup takes just a few clicks.
In Usermaven, go to Workspace Settings → Integrations.
Click Connect LinkedIn Ads. Log in with an account that has admin access to the ad account.
Select only the ad account(s) that send traffic to the website tracked in this workspace.
Confirm the connection and let the first sync run. When the status shows Synced, you’re set.
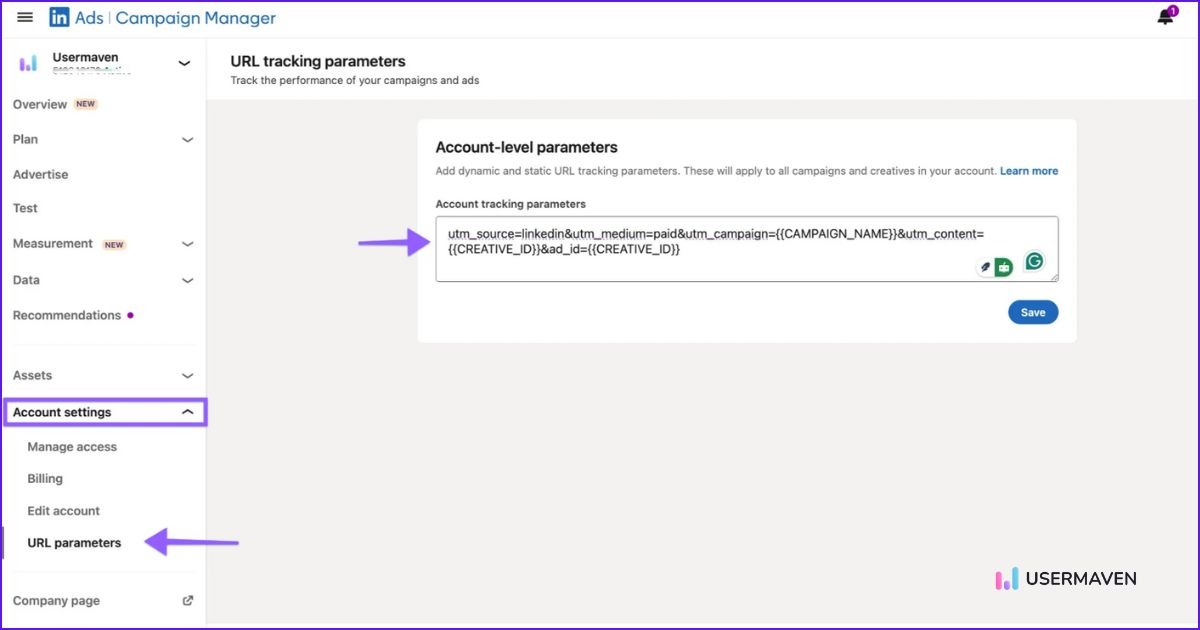
Add tracking parameters for accurate attribution
Before you start tracking performance, make sure your LinkedIn ads include proper UTM parameters. These short tags added to your URLs tell Usermaven exactly which campaign or ad brought the visitor to your site.
If you’re using LinkedIn’s dynamic fields, include identifiers like campaign name and creative ID so conversions can be traced back to the exact ad that drove them. This keeps your LinkedIn attribution clean and ensures your reports reflect reality, not guesswork.
💡 Pro tip: Don’t have UTM links ready? You can create them in seconds using Usermaven’s free UTM builder before launching your campaigns. It saves time and ensures every ad you run is trackable right from the start.
Start tracking performance and ROAS
Once your data starts syncing, you’ll be able to see everything in one place:
How much are you spending
Which ads are getting the most engagement
Which campaigns are driving conversions
What visitors from LinkedIn do once they land on your site
From there, Usermaven works as ad attribution software that connects LinkedIn spend, campaign data, conversions, and ROAS. It shows how much revenue or value each dollar of ad spend brings back.
This helps you answer the big questions:
Which campaigns deserve more budget?
Which ads look good on LinkedIn but don’t convert on-site?
Where can you improve landing pages or targeting for better results?
Turn insights into action
The best part of campaign tracking with Usermaven is how simple it becomes to act on your data. If a campaign has strong ROAS, scale it. If it’s underperforming, test new creative or audience segments. You can even identify high-performing organic posts and promote them as paid campaigns to reach a larger audience.
Tracking LinkedIn Ads performance through Usermaven helps you see the full picture, from the first ad click to the final conversion. It ensures your budget goes exactly where it makes the most impact.
Maximize your ROI
with accurate attribution
*No credit card required
How different teams use LinkedIn analysis to grow faster
Good analytics should help more than the marketing team. Here’s how different groups benefit when your LinkedIn analytics live alongside your website and conversion data in Usermaven.
Marketing & demand gen
Identify the topics and formats that drive qualified LinkedIn website traffic.
See which campaigns turn attention into pipeline.
Use LinkedIn attribution to prove impact and secure budget.
Sales & SDRs
Understand what content prospects saw before they converted.
Prioritize follow-ups that reference the right post or offer.
Share insight with marketing on what resonates in live conversations.
Product marketing
Spot the messaging that gets people to explore product pages.
Align in-product narratives with top-performing content themes.
Feed insights back into positioning and objection handling.
Content & social teams
Build a repeatable content system.
Track how carousels vs text vs video affect session depth and bounce.
Maintain a “top performers” library and iterate.
Founders & leadership
See LinkedIn’s contribution to revenue with clear LinkedIn attribution.
Compare LinkedIn to other channels fairly.
Fund what works with confidence.
Paid media
Run structured experiments.
Tie analyze LinkedIn ads outcomes to landing page quality and offers.
Keep a living playbook of creatives, audiences, and offers with the best ROAS.
Common mistakes to avoid when analyzing LinkedIn influence
Even the best analytics setup can fall apart if you make basic mistakes. Here are pitfalls to watch out for:
Relying solely on engagement metrics Likes, comments, and shares are helpful, but they don’t show what happens on your site.
Ignoring website behavior If you don’t track sessions, bounce, and duration, you miss how deep the interest is.
Comparing LinkedIn data to all traffic without segmenting LinkedIn visitors behave differently; compare them to other social or similar channels, not “all users.”
Letting attribution delay or sync issues go unnoticed Always ensure your data is up to date, and test UTMs after setting them.
Failing to act on insights Analytics isn’t a trophy. Use data to test, iterate, and improve continuously.
Avoid these, and you’ll get much closer to “what actually works” rather than being lost in numbers.
Why Usermaven is the smarter way to analyze LinkedIn influence
Let’s keep it simple. You need three things to understand your LinkedIn impact:
A clear view of traffic and on-site behavior (sessions, duration, bounce, return visits).
Clean campaign data for ads (spend, clicks, conversions) with dynamic parameters.
Reliable attribution that ties conversions to the right sources, campaigns, and creatives.
Usermaven brings all three together so you don’t have to juggle tabs or spreadsheets.
Unified LinkedIn view: Filter organic LinkedIn website traffic in one click. Pull in LinkedIn Ads automatically.
Behavior + attribution layer: Go beyond native LinkedIn analytics and see what users do after the click and which touchpoints get credit.
Actionable comparisons: Organic vs paid. Post types vs landing pages. Campaign vs campaign. Easy to slice and understand.
Confidence in ROAS: With UTMs and Creative ID in place, your LinkedIn campaign tracking and ROAS become clear enough to drive budget decisions.
Bringing it all together,
Analyzing your LinkedIn influence isn’t about vanity metrics; it’s about knowing what drives real results. By tracking traffic, engagement, and conversions, you turn LinkedIn into a reliable growth channel.
If you want clarity without the guesswork, Usermaven brings your LinkedIn traffic, ad data, conversion behavior, and attribution into one clear view. You can see which posts, campaigns, and creatives actually move the needle instead of relying on surface-level engagement.
Ready to see how it works? Book a demo today and discover how Usermaven can help you optimize your campaigns and grow with confidence.
Website analytics tool for modern marketers & agencies
*No credit card required
FAQ
1. How can I measure LinkedIn influence beyond engagement metrics?
Look at what happens after the click. Filter your analytics by source = LinkedIn and track sessions, pageviews, visit duration, bounce rate, and conversions. This shows whether your content is attracting the right people and moving them forward.
2. How often should you analyze your LinkedIn influence?
Weekly for active campaigns and content experiments. Monthly for strategic reviews and larger shifts. A light weekly rhythm helps you catch issues early and build momentum through small, consistent improvements.
3. What’s the best way to analyze LinkedIn influence for businesses?
Combine native LinkedIn analytics (great for reach and engagement) with website analytics (great for behavior and conversions). A simple but powerful analytics tool like Usermaven sits in the middle, connecting both views with attribution so you can make decisions based on outcomes, not guesses.
4. Can I track both organic and paid LinkedIn data in Usermaven?
Yes. Filter LinkedIn as a source to see organic traffic and behavior. Connect LinkedIn Ads to import campaign spend, clicks, and conversions. Then use attribution to compare organic vs paid contribution in one place.
5. How do I measure LinkedIn conversions using attribution?
Add UTMs and the Creative ID parameter to your LinkedIn ad URLs. Set them at the account level in Campaign Manager so every ad inherits them. In Usermaven, review attribution to see which sources, campaigns, and creatives earned credit for conversions. From there, optimize your budgets and offers based on real returns.
Ruler Analytics pricing is based on monthly website traffic and the level of measurement a business needs. Current plans start at $400 per month for up to 10,000 visits and rise to $2,000 per month for more than 100,000 visits. The final cost can also depend on product, data, and integration requirements. Features such as […]
A shopper may discover a product through a Meta ad, return through Google Search, open an email, and complete the order by visiting the store directly. Every platform may claim credit for the same sale. Without reliable ecommerce attribution, teams cannot tell which interaction created demand, which one assisted the decision, and which one simply […]
An agency onboards a new ecommerce client and realizes the attribution tool built for their B2B SaaS clients does not handle Shopify data at all. Two months later, a different client asks for white-labeled reports, and the same platform cannot produce them either. Most attribution tools help marketers see performance. Agencies need tools that help […]