Search performance data is one of the most valuable signals for growth. It tells you what people are searching for, how they find you, and which pages Google trusts.
Google Search Console gives you that data. But using it effectively is another story.
Most SEO teams open Search Console, scan a few charts, export a report, and move on. The data stays disconnected from traffic behavior, product usage, and conversions. As a result, decisions are often based on partial context.
A Google Search Console dashboard inside your analytics tool changes how SEO teams work. Instead of treating search data as a separate reporting task, it becomes part of everyday growth analysis.
Here, we’ll explain what a Google Search Console dashboard is, why the native interface falls short, and how Usermaven brings Search Console data into one unified analytics experience. We’ll also walk through real use cases that show how SEO and growth teams turn this data into action.
What is a Google Search Console dashboard?
A Google Search Console dashboard is a centralized view of your website’s organic search performance. It organizes raw Search Console data into clear website metrics, trends, and comparisons that are easier to understand and act on.
At a high level, a dashboard shows:
How many clicks and impressions your site gets from Google
The goal of a dashboard is not just reporting. It’s interpretation.
Instead of jumping between tabs for queries, pages, countries, and devices, a dashboard pulls everything together. This makes it easier to spot patterns, opportunities, and problems without manual filtering.
A well-built reporting dashboard also focuses on change. It highlights what is improving, what is declining, and where attention is needed. That’s something the native interface struggles with.
For marketing and SEO teams, a dashboard becomes the daily workspace for organic performance. It’s where planning, optimization, and validation happen.
Limitations of the native Google Search Console interface
Google Search Console is reliable and accurate, but it was never designed to be a full analytics tool.
While it provides essential SEO data, the way that data is structured and presented creates several practical limitations for modern marketing and growth teams.
Fragmented reporting across multiple views
Search performance data is spread across multiple reports. Queries, pages, countries, and devices all live in separate views. Understanding the full picture requires constant switching, which slows analysis and makes it easy to miss trends.
No business or conversion context
GSC stops at clicks and impressions. It doesn’t show engagement, signups, purchases, or revenue. This makes it hard for ecommerce brands and SaaS teams to measure the real business impact of SEO.
Poor prioritization of opportunities and risks
Search Console shows large data tables but offers little guidance on what to focus on. Important insights like declining pages or high-impression, low-CTR keywords require manual filtering and exports.
Limited collaboration across teams
The interface is designed mainly for SEO specialists. Product, growth, and leadership teams rarely use it, keeping SEO insights disconnected from broader business decisions.
Heavy reliance on exports and spreadsheets
To gain deeper insight, teams often export data into spreadsheets or BI tools. This adds friction, slows reporting, and increases the risk of outdated or inconsistent data.
Why marketers need a Google Search Console dashboard inside analytics
SEO does not operate in isolation anymore. Modern marketing teams care about outcomes, not just rankings.
When Search Console data lives inside your analytics platform, it becomes immediately more useful. You can connect search performance to real user behavior and business results.
A google search console dashboard inside analytics allows teams to answer questions like:
Which organic pages drive conversions?
Which keywords bring engaged users?
How does organic traffic move through funnels?
Where does SEO contribute to revenue or signups?
This integration changes how SEO is prioritized. Instead of focusing only on traffic growth, teams can focus on impact. Pages that rank well but don’t convert become optimization targets. Keywords that bring high-intent users become expansion opportunities.
It also improves communication. When SEO data lives alongside product and traffic analytics, it becomes accessible to non-SEO stakeholders. Growth teams, product teams, and leadership can all see how organic search supports overall goals.
In short, embedding Search Console into analytics turns SEO reporting into growth intelligence.
How Usermaven brings Google Search Console into one unified dashboard
Usermaven integrates Google Search Console directly into its analytics platform, giving teams a marketing attribution platform where Search Console insights flow into the same place they already track performance. Once connected, Search Console data becomes part of your everyday reporting and analysis workflow.
There’s no need for manual exports or data blending. Clicks, impressions, queries, pages, and positions sync automatically and update regularly.
Inside Usermaven, Search Console data sits next to:
This creates a single source of truth for SEO and growth.
Instead of switching tools, teams can analyze organic search performance in the same environment they use for product analytics and marketing insights. This saves time and reduces friction across teams.
Usermaven doesn’t just replicate the Search Console interface. It restructures the data to highlight trends, changes, and opportunities. This makes the Google Search Console dashboard more actionable and easier to use.
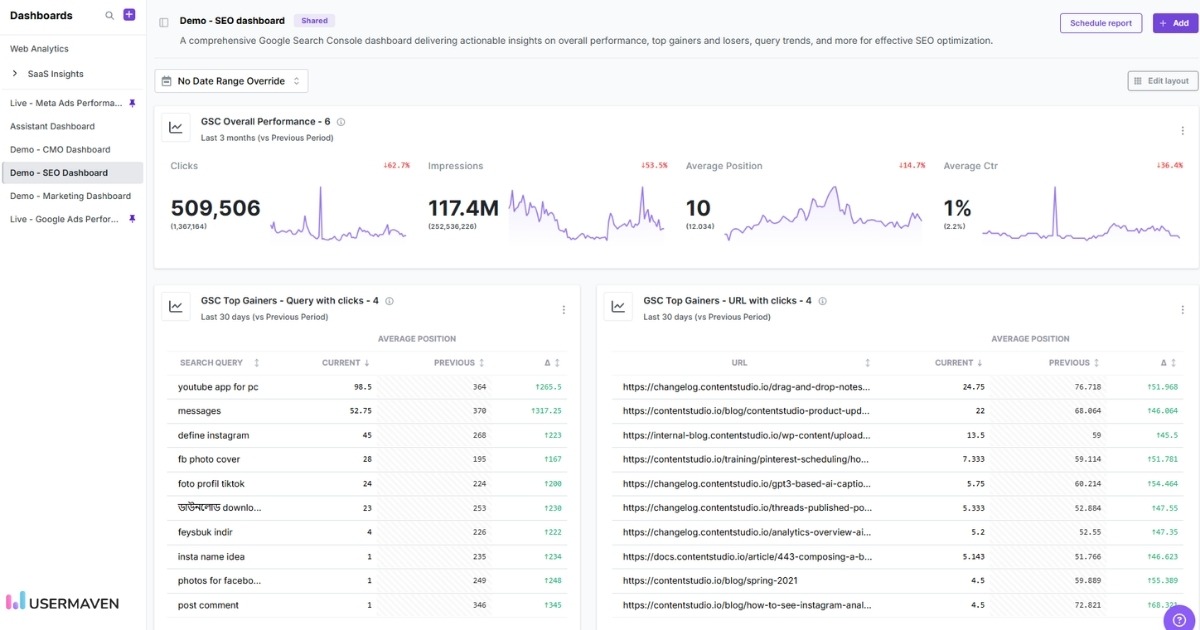
GSC overall performance inside Usermaven
The overall performance view is the starting point for most teams. It provides a clear snapshot of organic search health.
In Usermaven, this section shows:
Total clicks over time
Total impressions trends
Average CTR
Average position
Period-over-period comparisons
These metrics are presented as clean, readable charts rather than isolated numbers. This makes it easier to understand direction and movement, not just totals.
SEO teams and marketers often use this section to monitor the impact of content updates, technical changes, or site-wide SEO initiatives. Growth teams use it to understand how organic search is trending relative to other acquisition channels.
Because this dashboard lives inside Usermaven’s analytics interface, teams can quickly compare organic trends with other channels. This helps identify whether changes are SEO-specific or part of a broader traffic shift.
This section replaces the need to constantly check multiple Search Console reports just to understand overall performance.
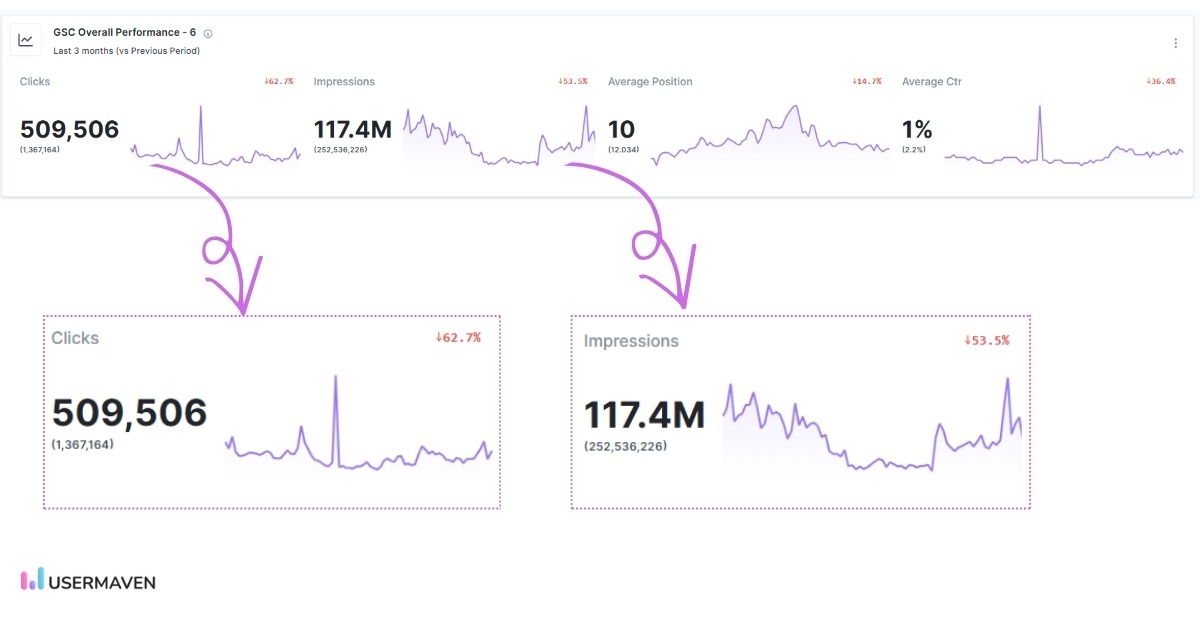
Total clicks and impressions
Clicks and impressions are foundational SEO metrics. But their value comes from how they’re interpreted.
In Usermaven, clicks and impressions are visualized as time-series data. You can see growth, plateaus, and declines clearly without manual comparisons.
This view helps teams understand:
Whether visibility is growing faster than traffic
If ranking improvements are translating into clicks
How seasonality affects search demand
For ecommerce brands, impression trends often signal demand shifts before clicks change. For SaaS teams, click trends often correlate with content effectiveness and SERP competitiveness.
Because this data lives inside analytics, teams can layer additional context on top. For example, a spike in impressions without a spike in clicks may indicate CTR issues. A drop in clicks alongside stable impressions may signal SERP changes.
This makes clicks and impressions more than vanity metrics. They become diagnostic tools.
Average position tracking
Average position is often misunderstood, but it still provides valuable directional insight when used correctly.
In Usermaven, average position is displayed alongside clicks, impressions, and CTR, making it easier to interpret ranking changes in context. This encourages teams to focus on trends rather than individual keyword movements.
Instead of obsessing over single-keyword rankings, teams can focus on:
Overall ranking trends
Page-level position changes
Keyword groups moving up or down
This helps answer practical questions. Are content updates improving rankings? Are competitors pushing you down the SERPs? Are new pages gaining traction?
More importantly, position data can be connected to clicks and conversions. A ranking improvement that doesn’t increase traffic may indicate poor search intent alignment. A ranking drop that doesn’t affect conversions may be less urgent.
Usermaven helps teams treat rankings as signals, not goals.
See Usermaven in action
Book a free demo and discover how powerful analytics can grow your business.
*No credit card required
Average CTR visibility
Average CTR is surfaced as a first-class metric in the overall performance view, making it easy to understand how effectively search visibility is turning into clicks.
In Usermaven, CTR is shown with:
A clear percentage value
Period-over-period comparison
A trend line that highlights changes over time
This allows teams to quickly spot whether CTR is improving, declining, or remaining flat as impressions change.
Because CTR is displayed alongside impressions and position, teams can interpret it more accurately. A declining CTR with stable rankings may point to SERP competition or outdated titles. A low CTR despite strong impressions can highlight immediate optimization opportunities.
By surfacing CTR directly in the main dashboard, Usermaven helps teams spot engagement gaps without digging through multiple reports.
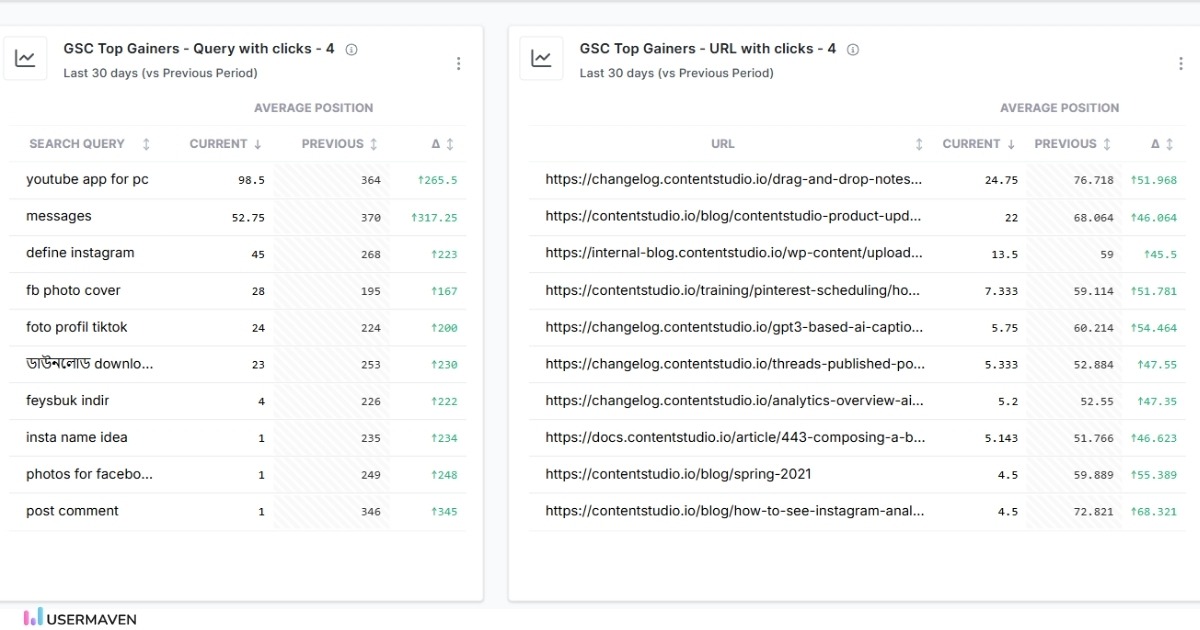
Top gainers: Keywords and URLs
The top gainers section highlights where organic search momentum is building.
Usermaven surfaces keywords and URLs that show positive movement over a selected period, based on changes in:
Clicks
Impressions
Average position
This makes it easy to identify what is currently working without manually sorting or exporting data.
SEO teams use this section to understand which pages and topics Google is increasingly rewarding. Growth teams often use it to spot patterns in content format, intent, or structure that are gaining traction.
By clearly surfacing gains, this view helps teams reinforce successful strategies rather than only reacting to problems.
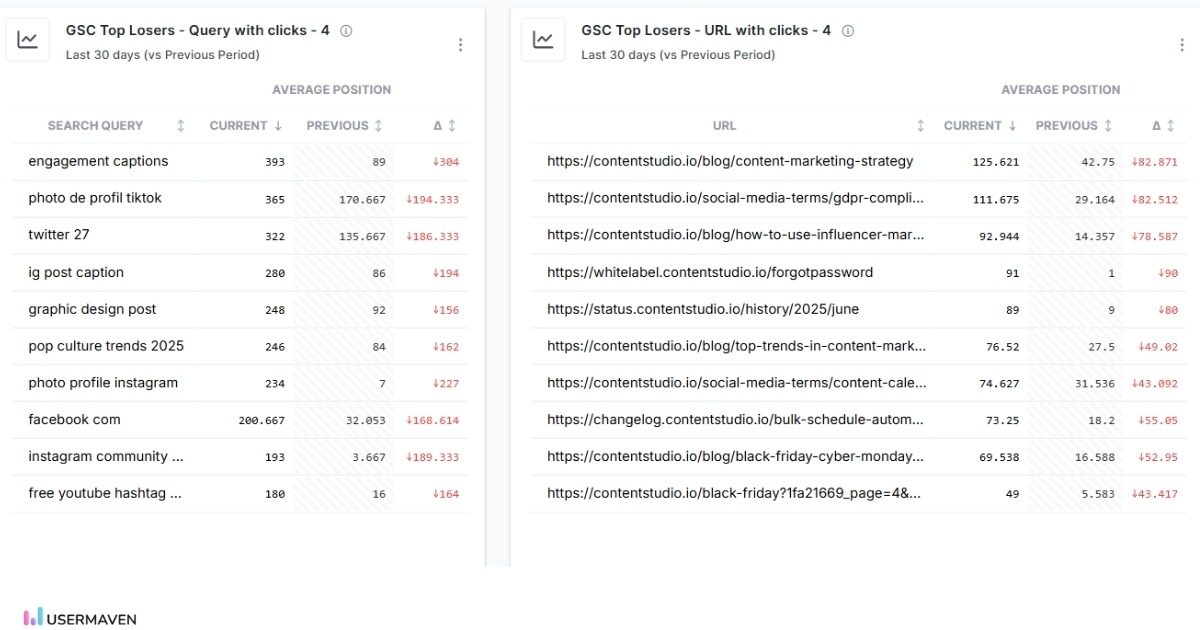
Top losers: Keywords and URLs
Organic search performance fluctuates, and declines are inevitable. The key is visibility and speed.
In Usermaven, the top losers section highlights keywords and URLs that are losing clicks, impressions, or position. This allows teams to identify issues early, without digging through large tables.
This view helps surface potential problems, such as:
Content decay
Ranking drops caused by competitors
Technical or indexation issues
Algorithm impact on specific pages
Because this data is visible early, teams can act before traffic loss becomes severe.
This section is especially useful for large sites with hundreds or thousands of pages. It brings focus to the areas that need attention now.
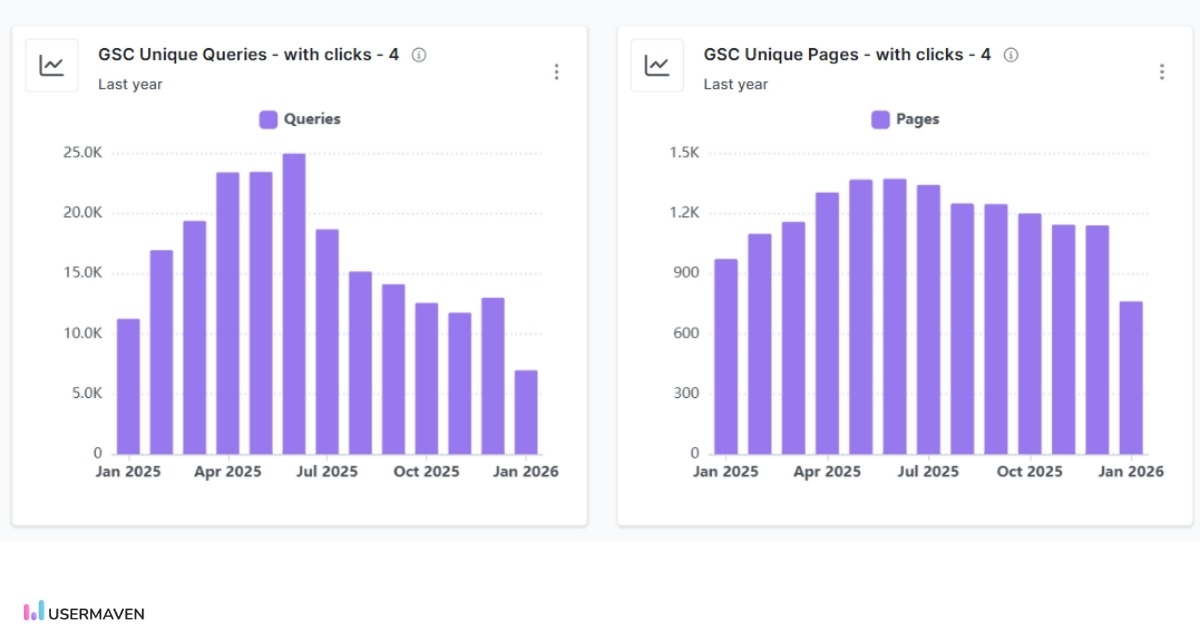
Unique pages and unique queries
SEO growth is not only about more traffic. It’s also about broader coverage.
The unique pages and the unique queries section show:
How many pages receive impressions How many distinct queries trigger your site
How these numbers change over time
This helps teams measure topical authority and content coverage.
For content-driven sites, growth in unique queries often signals improved relevance. For ecommerce brands, growth in unique pages can indicate better indexation and category visibility.
If these numbers stagnate or decline, it may point to crawl issues, content gaps, or competitive pressure.
Usermaven makes these trends visible without manual exports, helping teams track SEO health at a structural level.
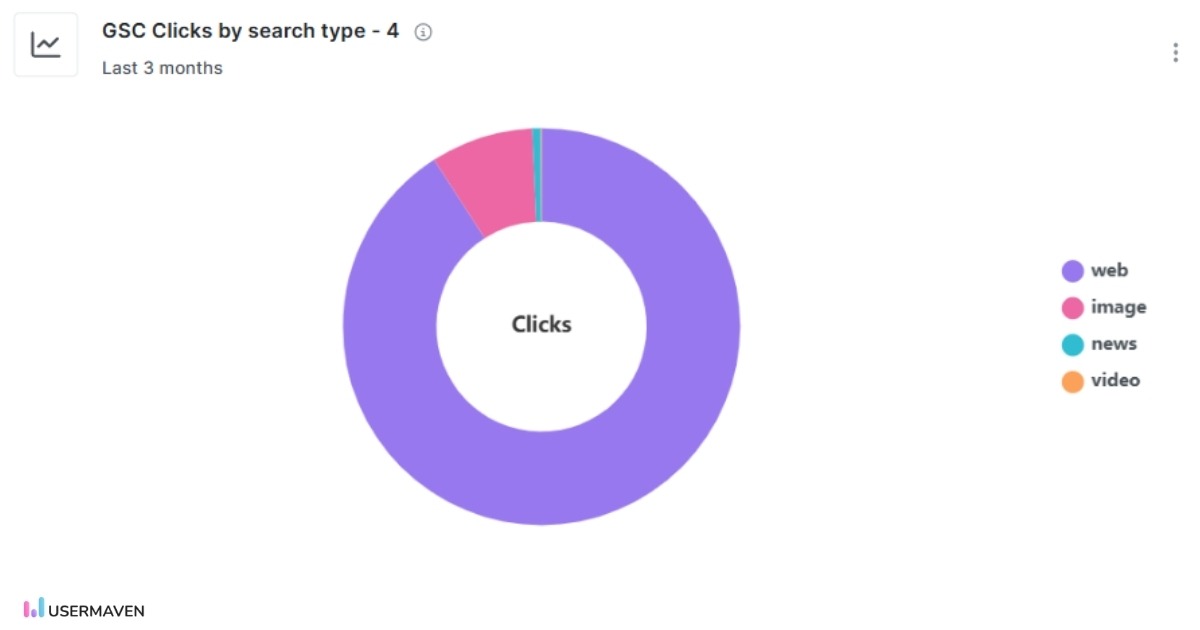
Clicks by search type
The clicks by search type view shows how organic clicks are distributed across different Google search surfaces.
In this section, Usermaven breaks down clicks by search type, such as:
Web search
Image search
News
Video
This view shows a simple visual breakdown of clicks by search surface, making it easy to see where organic traffic comes from at a glance.
It helps teams understand whether clicks mainly come from web search or from other surfaces like images or news, highlighting potential format-level optimization opportunities.
Usermaven surfaces this directly in the Google Search Console dashboard so teams can see how users discover their site, not just how much traffic they get.
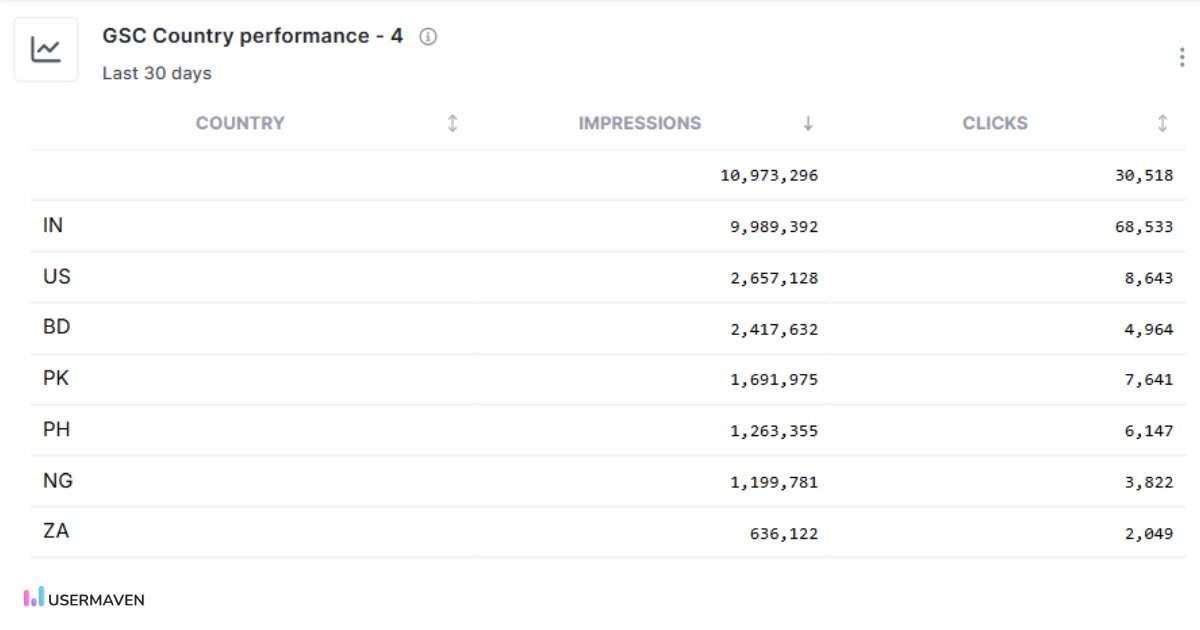
Country-wise performance
For businesses with international audiences, country-level insights are critical.
Usermaven breaks down Search Console data by country, showing:
Clicks and impressions per region
CTR differences across markets
Ranking trends by country
This allows teams to spot geographic opportunities and issues quickly.
For example, a page may perform well in one country but poorly in another. That insight can guide localization, content updates, or hreflang improvements.
Country-wise data also helps teams prioritize expansion markets based on real demand rather than assumptions.
Because this data sits inside analytics, it can be paired with regional conversion and revenue data for smarter decision-making.
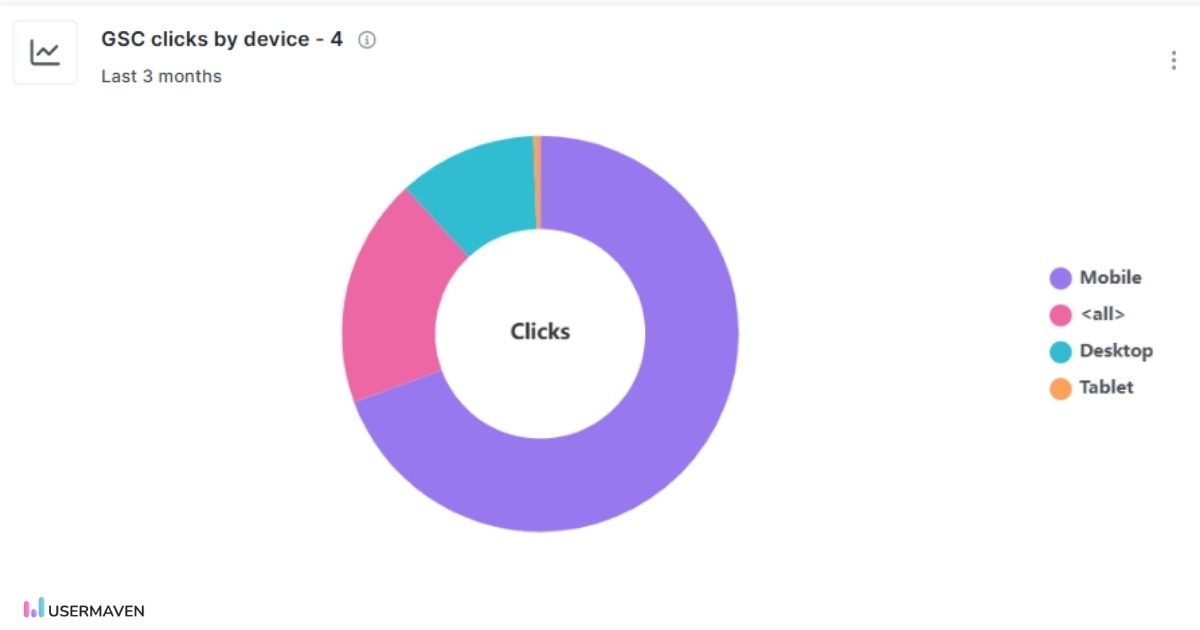
Clicks by device
Search behavior varies significantly by device.
Usermaven shows how clicks, impressions, CTR, and position differ across:
Desktop
Mobile
Tablet
This helps teams understand whether mobile SEO is underperforming or improving.
Common use cases include:
Diagnosing mobile-specific ranking drops
Prioritizing page speed improvements
Aligning UX changes with SEO performance
When device data is connected to engagement metrics, teams can see whether mobile users behave differently after landing on pages.
This turns device segmentation into a practical optimization tool.
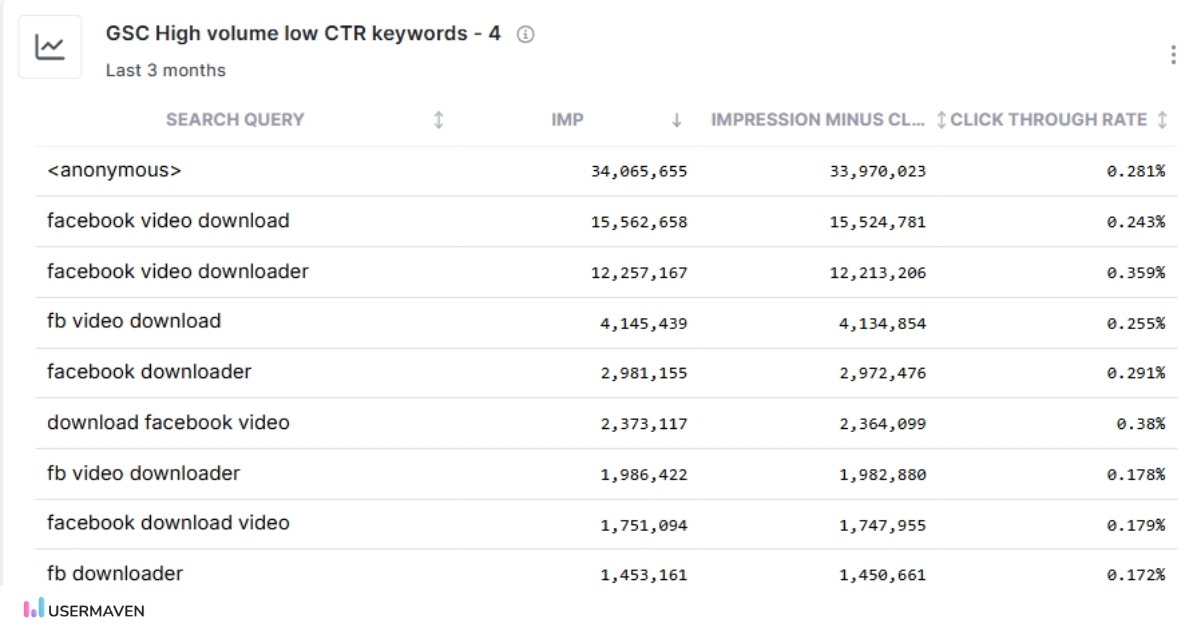
High-volume, low-CTR keywords
High-impression, low-CTR keywords represent some of the fastest SEO wins.
Usermaven surfaces these opportunities automatically by combining impression volume with CTR benchmarks.
This helps teams identify keywords where:
Rankings are already strong
Search demand is high
Click-through rate is below potential
Common actions include improving titles, meta descriptions, and rich snippet eligibility.
Because these keywords already rank, small improvements can lead to meaningful traffic gains without creating new content.
This section alone often justifies having a dedicated Google Search Console marketing dashboard.
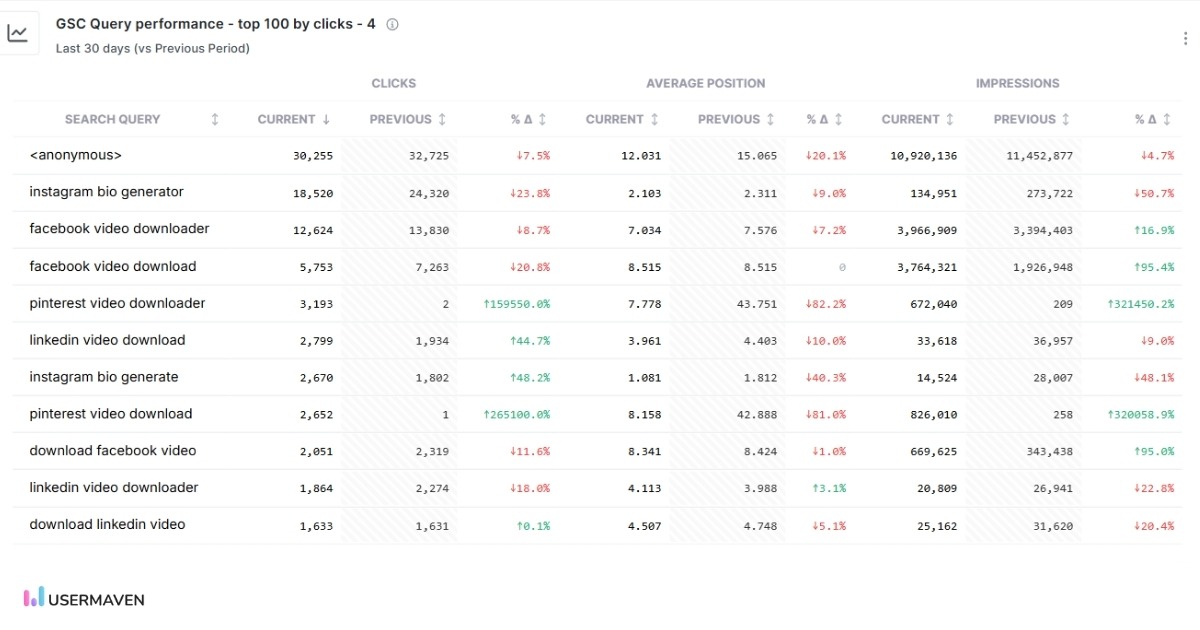
Query performance (top queries by clicks)
This section shows how individual search queries are performing based on clicks, with a direct comparison against the previous period.
Usermaven displays query-level data in a sortable table that includes:
Search query
Current and previous clicks
Click change percentage
Current and previous average position
Current and previous impressions
By showing current and previous values side by side, teams can quickly spot which queries are gaining or losing traction without exporting data or switching views.
Because this table lives inside the Google Search Console dashboard, teams can analyze keyword performance without exporting data or switching tools.
How GSC insights connect with product, traffic, and conversion data
This is where Usermaven delivers the most value.
Google Search Console data does not live in isolation inside Usermaven. It connects directly with product, traffic, and conversion analytics.
How organic search contributes across attribution paths
Because Usermaven includes attribution, SEO impact is not limited to last-click views. Teams can understand how organic search supports signups, purchases, or key actions across the user journey.
This helps SEO teams prioritize work based on real business impact. Product teams can see which features or use cases attract organic demand. Growth teams can align SEO strategy with acquisition and retention goals.
In summary,
Google Search Console gives you critical SEO data, but the native interface makes it hard to turn that data into decisions. A unified Google Search Console dashboard inside your analytics helps teams understand performance faster, connect insights across channels, and act with confidence.
To solve this gap, teams need more than standalone reports. They need a platform that connects search data with traffic, product, and conversion insights. Usermaven does exactly that. As a modern website analytics tool, Usermaven brings Google Search Console data together with behavioral analytics and attribution, helping teams clearly understand how SEO drives real growth.
So are you ready to move beyond basic Search Console reporting?
Start a free trial, book a demo, or talk to our team to see how Usermaven turns your search console data into action.
FAQs
1. What is an SEO dashboard?
An SEO dashboard is a single view that shows your key SEO metrics in one place. It helps you track search performance without switching between tools. It typically includes clicks, impressions, rankings, CTR, top pages, and keywords. More advanced dashboards also connect SEO data with traffic and conversions.
2. Why do teams need a Google Search Console dashboard inside analytics?
Google Search Console shows what happens in search, but not what happens after the click. When the dashboard lives inside analytics, search data connects with traffic behavior, funnels, and conversions. This helps teams understand not just visibility, but real business impact.
3. How does a GSC dashboard help SEO teams work faster?
A dashboard highlights trends, gains, and losses without manual filtering. Teams can quickly spot changes, focus on the right pages or queries, and spend less time reporting. This leads to faster decisions and more consistent optimization.
4. Is a Google Search Console dashboard useful for ecommerce brands?
Yes. Ecommerce teams can track search demand, category visibility, and page-level performance. When connected to analytics, they can also understand how organic traffic influences conversions and revenue.
5. Is this dashboard helpful for SaaS and product-led teams?
It is especially useful for SaaS teams. Search data can be connected with signups, feature usage, and onboarding flows. This helps teams understand which topics and use cases attract qualified users.
6. What is the 5-second rule for dashboards?
The 5 second rule means a dashboard should be easy to understand within five seconds. If it takes longer, it is too complex. A good dashboard highlights the most important metrics first. It uses clear visuals and minimal clutter so users can quickly see what is working and what needs attention.
Ruler Analytics pricing is based on monthly website traffic and the level of measurement a business needs. Current plans start at $400 per month for up to 10,000 visits and rise to $2,000 per month for more than 100,000 visits. The final cost can also depend on product, data, and integration requirements. Features such as […]
A shopper may discover a product through a Meta ad, return through Google Search, open an email, and complete the order by visiting the store directly. Every platform may claim credit for the same sale. Without reliable ecommerce attribution, teams cannot tell which interaction created demand, which one assisted the decision, and which one simply […]
An agency onboards a new ecommerce client and realizes the attribution tool built for their B2B SaaS clients does not handle Shopify data at all. Two months later, a different client asks for white-labeled reports, and the same platform cannot produce them either. Most attribution tools help marketers see performance. Agencies need tools that help […]