Most product teams collect plenty of data and still argue about what to build next. The gap is rarely the tool. It is the lack of a clear plan for which questions to answer, which metrics to trust and who acts on the results.
A product analytics strategy closes that gap by tying product analytics data to the decisions your team actually makes. This guide covers what it is, how to build one in six steps, what to include and how to fix the problems that usually stall it.
Key takeaways
- Start with decisions: A product analytics strategy begins with the product decisions you need to make, not with tools or dashboards.
- Keep metrics few: One north star metric plus a small set of input metrics keeps the whole team focused on the same outcomes.
- Write a tracking plan: A shared plan for events and properties stops naming drift and keeps your data trustworthy.
- Assign owners: Every metric needs one owner and a review rhythm, otherwise dashboards go unread.
- Choose usable tools: Pick a platform that product, growth and marketing teams can use without writing SQL.
- Review every quarter: Goals, metrics and events should change as your product and users change.
What is a product analytics strategy?
A product analytics strategy is a written plan for how your team collects, analyzes and acts on product usage data. It defines the business goals you are working toward, the metrics that show progress, the events you track, the tools you use and the people responsible.
It is not the same as a tool setup. Installing an analytics platform gives you data. A strategy tells you which data matters, why it matters and what you will do when the numbers move.
Think of it as the bridge between company goals and day-to-day product work. Without it, teams track everything, review very little and settle debates with opinions instead of evidence.
Why a product analytics strategy matters
Teams with a plan make faster and more confident decisions. When everyone agrees on the metrics, a drop in activation becomes a shared problem to solve instead of a dashboard debate.
A strategy also protects your budget and your users. You stop paying for tracking nobody reads, and you reduce the risk of collecting personal data you do not need.
Finally, it makes growth repeatable. You can see which changes move retention or revenue, then run the same process for every new feature or release.
How to build a product analytics strategy in six steps
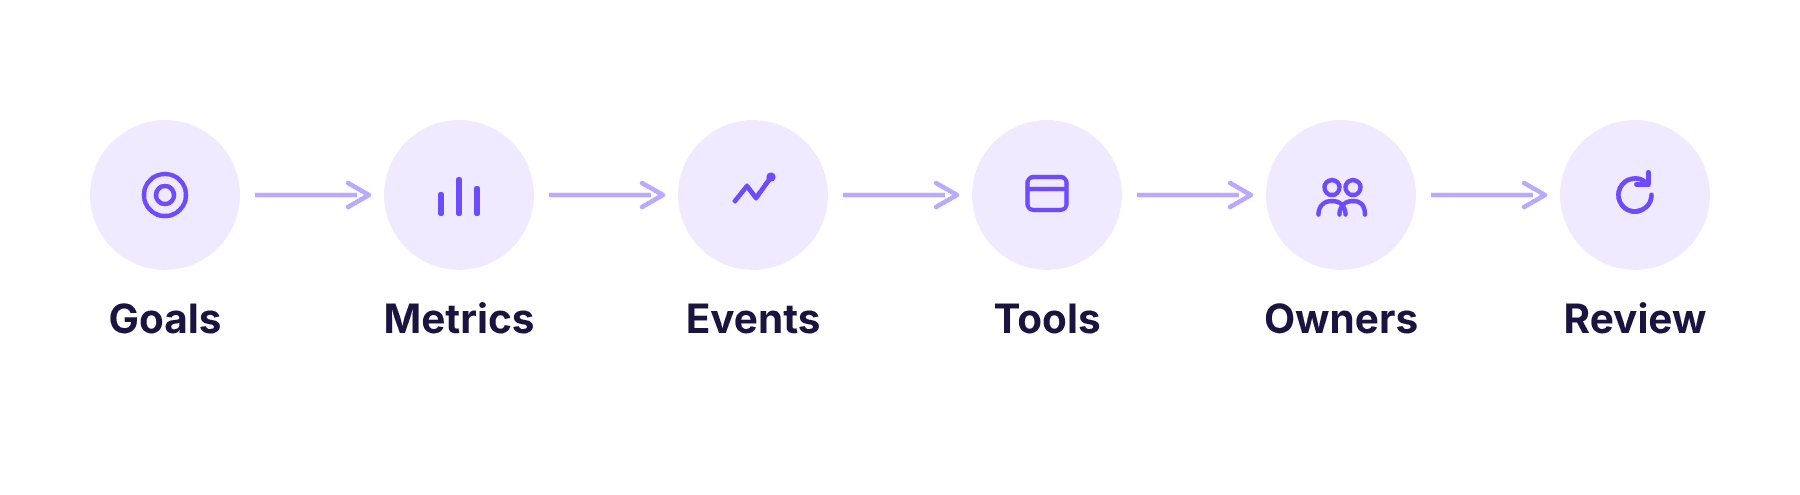
Use the six steps below as a checklist. They move from business goals down to the events you track, then back up to the review habits that keep the strategy alive.
Start with business goals
Write down the two or three outcomes your product must drive this year, such as higher activation, better retention or more expansion revenue. Each outcome should connect to a decision your team will make.
Then turn every goal into a question. “Why do trial users stop before inviting a teammate?” is far more useful than “improve onboarding”.
Choose a small set of metrics
Pick one north star metric that reflects the value users get, then a handful of input metrics your team can influence directly. Most teams group product metrics into a north star, input metrics and health metrics.
Avoid vanity metrics such as total signups or page views. They rise easily and rarely show whether users get value. Pair each success metric with a counter-metric so a gain in one area does not hide damage in another.
Map the user journey and events
List the key moments between signup and long-term value, such as account creation, the first key action and a teammate invitation. Each moment becomes one or more events in your tracking plan.
Use a consistent naming convention, such as object and action, and document every property. A shared sheet is enough, and well-planned event tracking lets you build funnels and cohorts later without re-instrumenting your product.
Pick tools that fit your team
Choose a platform that product, marketing and growth teams can all use without waiting on engineering. Look for event and funnel analysis, retention reports, segmentation, privacy controls and a simple setup.
Compare options by team skill rather than feature count to avoid shelfware. Many teams also weigh product and marketing analytics together, since connecting in-product behavior to acquisition channels removes the need to stitch two systems together.
Assign owners and a cadence
Give every metric one owner and set a review rhythm. Weekly reviews suit activation and adoption, monthly reviews suit retention and revenue, and a quarterly review suits the strategy itself.
Share results in a form people actually read. A short written summary with one recommended action beats a dashboard link nobody opens.
Review and refine
After each review, retire metrics that no longer drive decisions, add events for new features and update goals if priorities changed. A quarterly refresh is enough for most teams.
Core components of a product analytics strategy
Every strong strategy has the same building blocks. The table below is a hypothetical example for a B2B SaaS product, so adapt the goals, metrics and owners to your own.
| Goal | Metric | Key events | Owner |
|---|---|---|---|
| Improve activation | Share of new accounts reaching a first report in 7 days | signup_completed, report_created | Product manager |
| Increase retention | 90-day user retention | session_started, feature_used | Growth lead |
| Drive feature adoption | Active users using a new feature in 30 days | feature_used, teammate_invited | Product manager |
| Grow expansion revenue | Accounts adding seats | seat_added, plan_upgraded | Revenue operations |
Metrics and KPIs
A good strategy mixes leading and lagging indicators. Leading metrics such as activation tell you early whether a change works, while lagging metrics such as retention and revenue confirm the result.
Adoption metrics are a practical starting point for leading indicators because they show how many users reach value and how quickly.
Data collection framework
Decide what you collect, how you collect it and under what consent. Client-side events cover most product behavior, while server-side events suit billing and account changes.
Some teams also enrich product data with external market data. A web scraping API or residential proxy solutions can collect public competitive information, provided collection follows site terms and privacy law.
Event tracking methodology
Track fewer events with clearer meaning. Start with the actions that mark activation, adoption and retention, and add more only when a specific question needs them.
Version your tracking plan like code. When an event name or property changes, record when and why, so analysts can compare data before and after the change.
Team roles and collaboration
Product managers usually own goals and metric definitions, engineers own instrumentation, and analysts or growth leads own analysis. Marketing owns acquisition metrics that connect to product behavior.
Hold a short monthly review where each owner explains what moved, why and what happens next. Clear roles prevent the common situation where everyone sees the data and nobody acts.
Product analytics strategy examples
The two examples below are hypothetical illustrations of how the strategy works in practice. They are not customer results.
B2B SaaS onboarding
A project management app notices that many trial accounts never invite a teammate. Its strategy names “teammate invited within seven days” as the activation metric.
A funnel analysis shows most drop-off between the first project and the invitation, so the team adds an invite prompt after project creation and tracks the change.
Feature adoption review
A team ships a reporting feature and defines adoption as the share of active accounts creating a report within 30 days. The right feature adoption metrics show whether launch work paid off.
When they segment accounts by plan, adoption is low on the starter plan, so they improve in-app guidance for that group. In a real example, ShortHillsDesign used Usermaven to reduce churn by 37%, as described in its case study.
How Usermaven supports your product analytics strategy
Usermaven combines product analytics with marketing attribution, so teams can connect what users do in the product with how they arrived. That makes it easier to run the strategy above in one place.
Track behavior with trends and breakdowns
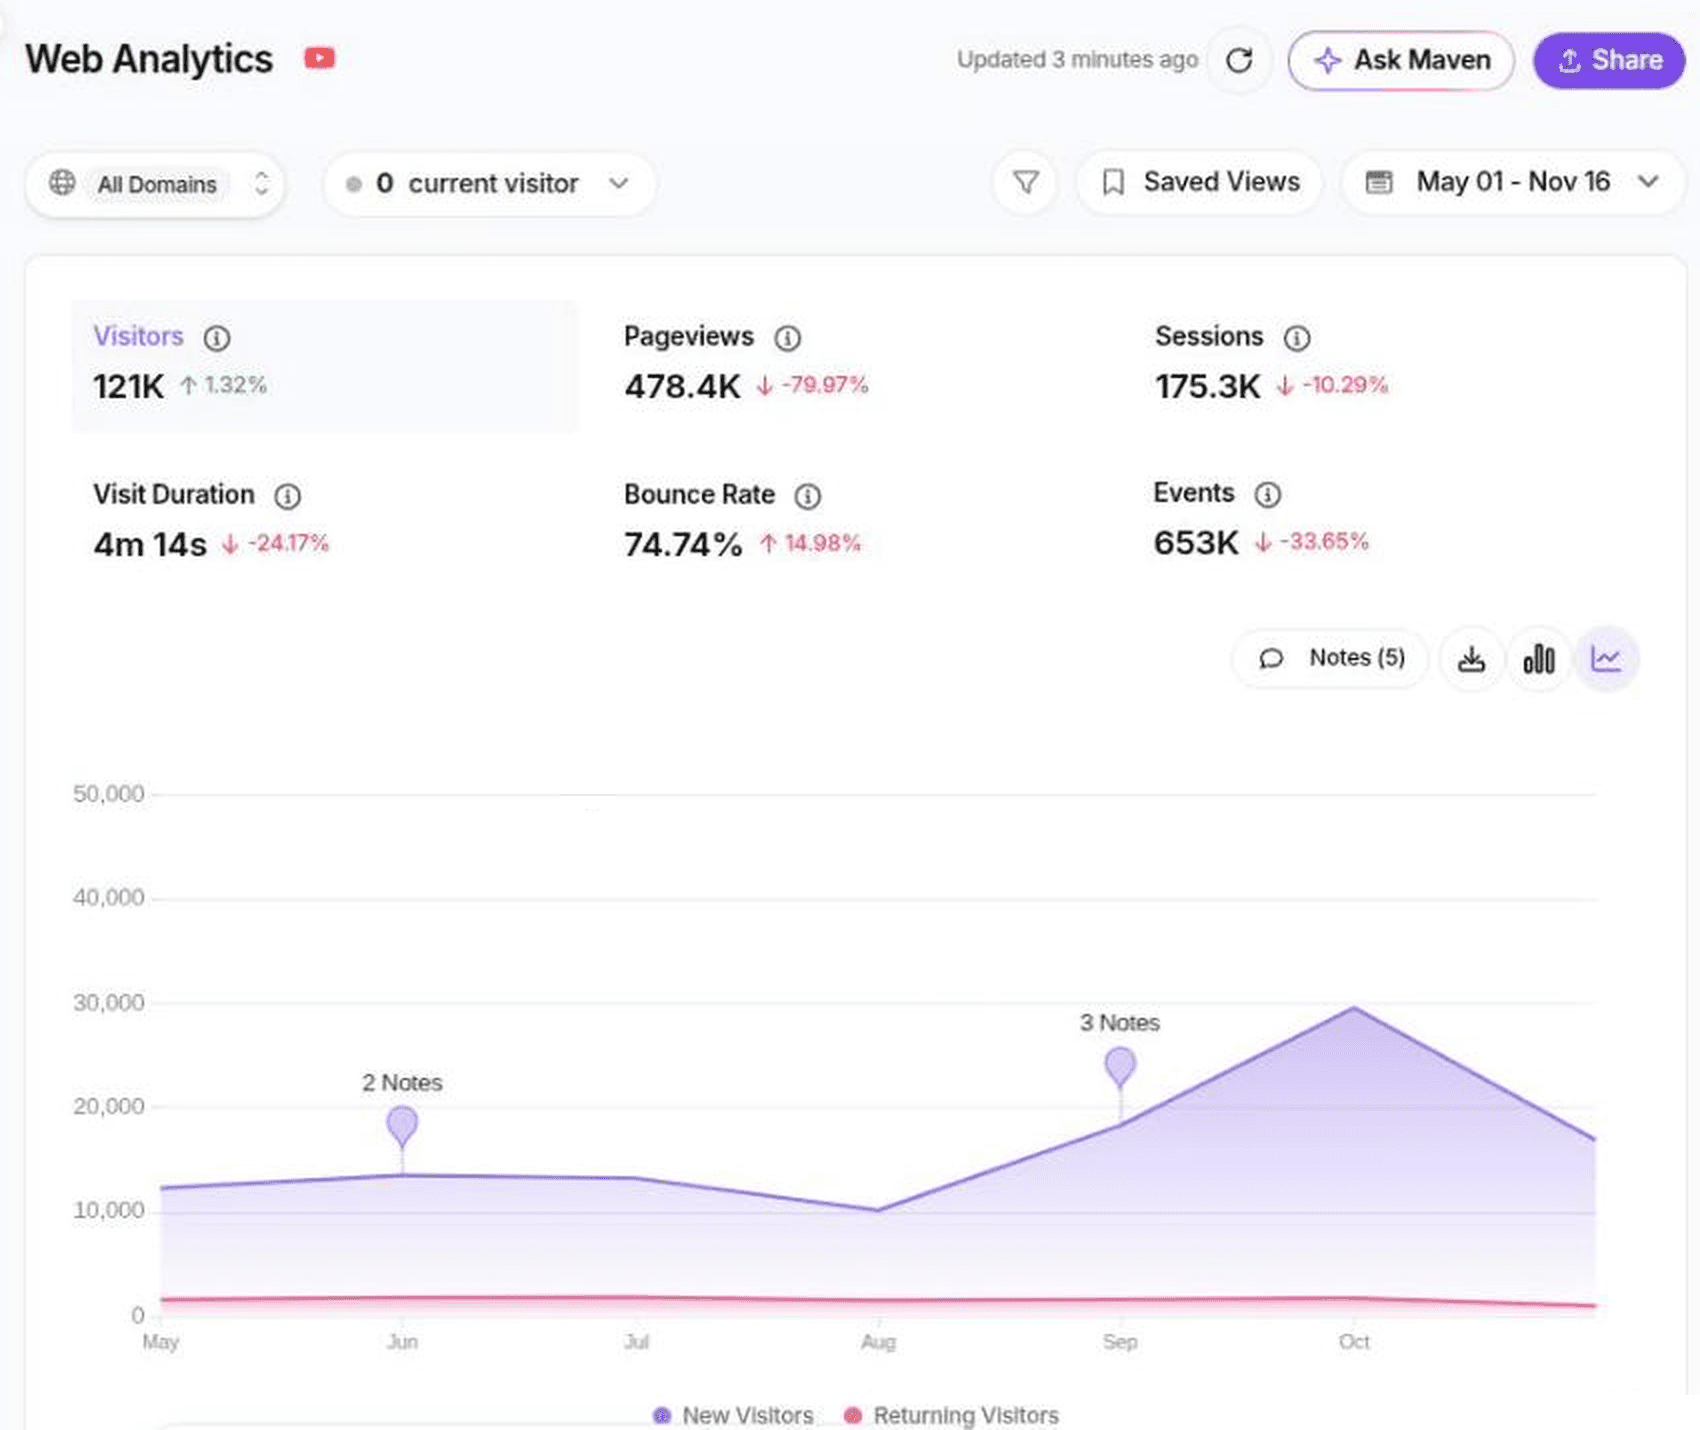
Usermaven Trends charts events over time in line, bar or table views, compares results with the previous period and breaks them down by channel, campaign or device.
Ask questions with Maven AI and Maven AI Agents
Maven AI answers plain-language questions about your data, so owners can check a metric without building a report first.
Maven AI Agents go a step further by running scheduled analyses in the background, which suits the recurring reviews in your strategy.
Build dashboards for every owner
Analytics dashboards give each owner one view of the metrics they are accountable for, from activation to retention.
Send scheduled reports and alerts
Scheduled reports and alerts deliver those metrics to email or Slack, so the team sees changes without opening a dashboard.
Product teams that want behavior data and attribution in one place can use analytics built for product teams to see which changes move activation and retention.
Common challenges and how to overcome them
Even well-planned strategies run into obstacles. The five problems below come up most often, along with practical ways to fix each one.
Data quality and validation issues
Inaccurate data leads to misleading insights. Validate events against your tracking plan on a schedule, and use SOP software to create and enforce standardized procedures for data entry and review.
Usermaven’s Measurement Trust Center gives your workspace a data-health score, which helps you spot tracking gaps early.
Overcoming team resistance
People ignore analytics when it feels hard to use. Start with one question per team, run short training sessions and share early wins.
Self-serve product analytics dashboards also help, because teammates can answer their own questions without waiting for an analyst.
Tackling technical implementation barriers
Start with a minimal tracking plan and expand it in stages, so engineering effort stays predictable. Test every event in a staging environment before release.
Automated collection also needs error handling. When a pipeline runs into an error code 520, retries and alerts keep gaps out of your data.
Working around resource constraints
Limited resources slow many strategies. Prioritize the metrics that matter most, choose cost-effective tools and leverage automation to streamline workflows so a small team covers more ground.
Addressing privacy concerns
Collect only what answers your questions, document consent and set clear retention limits. Anonymize or avoid personal data wherever a metric does not need it.
How to keep improving your strategy
A strategy is a loop, not a one-time document. Each review should lead to a decision, a change and a fresh measurement.
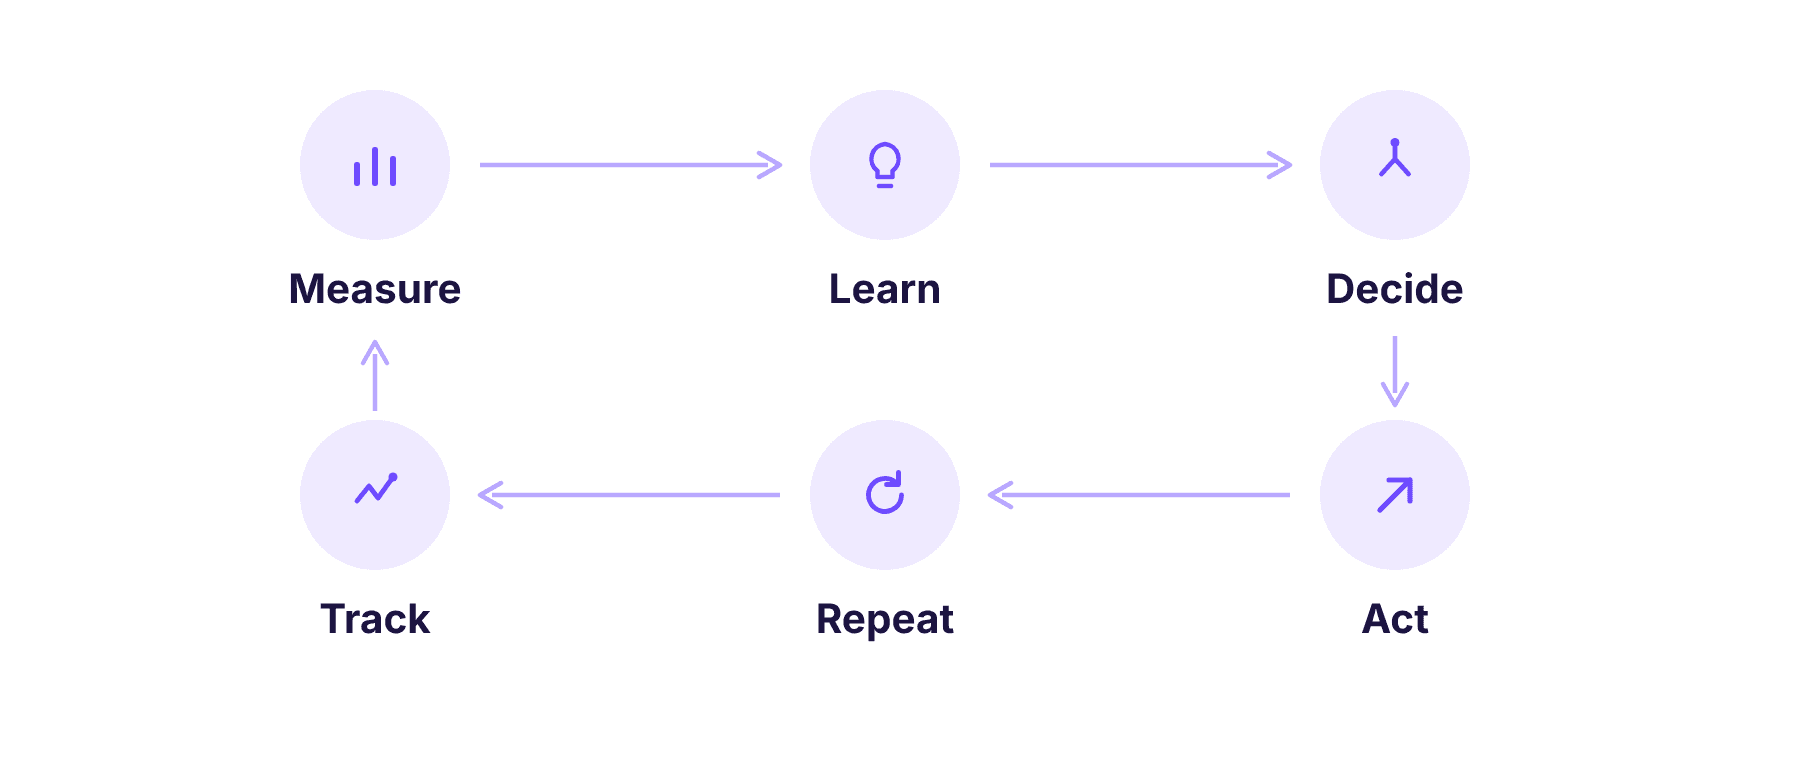
Monitor metrics regularly
Review your key metrics on the cadence you set, and look at the whole path as well as single numbers. Customer journey analytics shows where users stall between steps.
Adapt to evolving user needs
User behavior shifts as your product grows. Use cohort analysis to check whether newer users retain better than older ones, and update goals when the answer changes.
Use automation for efficiency
Automation keeps data collection and reporting from eating your team’s time. Connecting analytics platforms to other business apps is easier when you compare Zapier competitors and pick the tool that fits your stack.
Use feedback loops
Pair quantitative data with user feedback. Surveys and interviews explain why a metric moved, while analytics shows how many users are affected.
Conclusion
A product analytics strategy turns scattered data into decisions. Start with business goals, choose a few metrics, plan your events, pick usable tools, assign owners and review on a fixed rhythm.
If you want to turn this plan into working dashboards, book a demo to see how it fits your product and marketing data.
Power up your SaaS
with perfect product analytics
FAQs
What is a product analytics strategy?
It is a written plan for how a team collects, analyzes and acts on product usage data. It covers goals, metrics, tracked events, tools and owners.
How is it different from setting up an analytics tool?
A tool gives you data. A strategy decides which data matters, how it is named and tracked, and what actions the team takes when metrics change.
Which metrics should a product analytics strategy include?
Start with one north star metric and a few input metrics such as activation rate, feature adoption and retention. Add a counter-metric for each so improvements do not hide side effects.
How often should we review the strategy?
Review activation and adoption weekly, retention and revenue monthly, and the strategy itself every quarter or after a major product change.
Who should own a product analytics strategy?
Usually a product manager owns goals and metric definitions, with engineering owning instrumentation and analysts or growth leads owning analysis.
How can a small team start?
Pick one goal, three to five events and one weekly review. Expand the tracking plan only when a specific question needs more data.

Written by
Adeel Khan
Growth Marketing Expert
Adeel Khan is a full-stack SaaS marketer with 10+ years of experience in content marketing, paid advertising, analytics, and conversion rate optimization. He shares practical insights and strategies drawn from hands-on experience, helping B2B SaaS marketers improve performance and make better marketing decisions.
All articles by Adeel →