Your marketing reports might be giving 100% of the credit to a channel that did only part of the work.
That’s the problem with relying on a single touchpoint to explain a conversion. The channels that create awareness, build interest, and move buyers closer to a decision can disappear from the results.
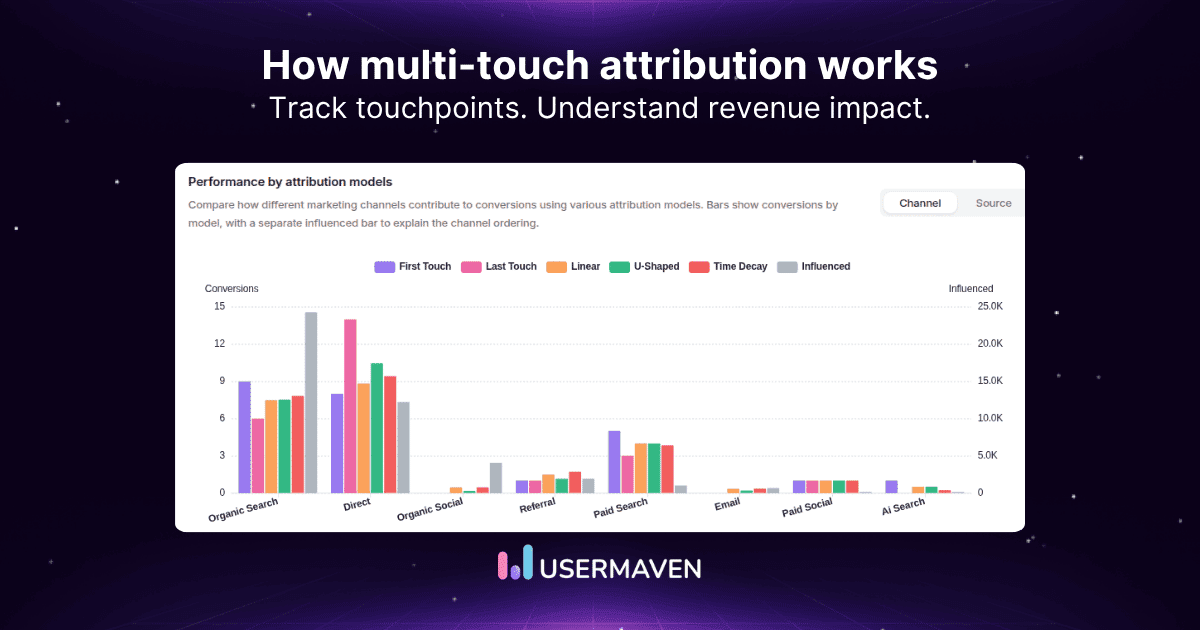
Multi-touch attribution changes how that credit is assigned. Instead of rewarding just one interaction, it distributes conversion credit across multiple touchpoints in the customer journey.
But how does MTA actually work? How does it connect interactions, calculate credit, and help you understand which marketing efforts contribute to revenue?
Let’s break down the process, step by step, with practical examples.
Maximize your ROI
with accurate attribution
Key takeaways
- Multi-touch attribution distributes conversion credit across multiple marketing interactions instead of assigning it to a single touchpoint.
- The process involves seven steps, from tracking customer interactions and connecting journeys to applying attribution models and analyzing revenue.
- Different attribution models produce different results. Linear, U-shaped, and time-decay models assign credit differently, even for the same conversion.
- Accurate attribution depends on reliable data, including campaign tracking, customer identifiers, conversion events, and appropriate lookback windows.
- Attribution helps marketers understand channel contributions, compare performance, and make informed budget decisions, but it does not prove incremental revenue.
Understanding multi-touch attribution
Multi-touch attribution (MTA) is a marketing measurement method that distributes conversion credit across multiple eligible interactions in a customer’s journey.
It works by connecting recorded interactions to a conversion and distributing credit according to an attribution model, rather than assigning 100% of the credit to a single interaction.
For example, a customer might interact with four marketing channels before purchasing. A linear attribution model would assign 25% of the conversion credit to each eligible touchpoint.
The exact distribution depends on the attribution model selected.
This is the main difference between single-touch and multi-touch attribution:
| Single-touch attribution | Multi-touch attribution |
| Assigns 100% of credit to one touchpoint | Distributes credit across multiple touchpoints |
| Focuses on the first or last interaction | Includes eligible interactions throughout the journey |
| Simple to implement and interpret | Requires more complete journey data |
| Useful for understanding acquisition or conversion endpoints | Useful for analyzing channel contributions and assisting interactions |
| Can overlook supporting touchpoints | Provides broader visibility into observed conversion paths |
MTA is particularly useful for businesses with longer buying cycles, multiple marketing channels, and several interactions before conversion.
For a broader explanation of attribution approaches, read our multi-touch attribution guide.
How does multi-touch attribution work? (Step-by-step)
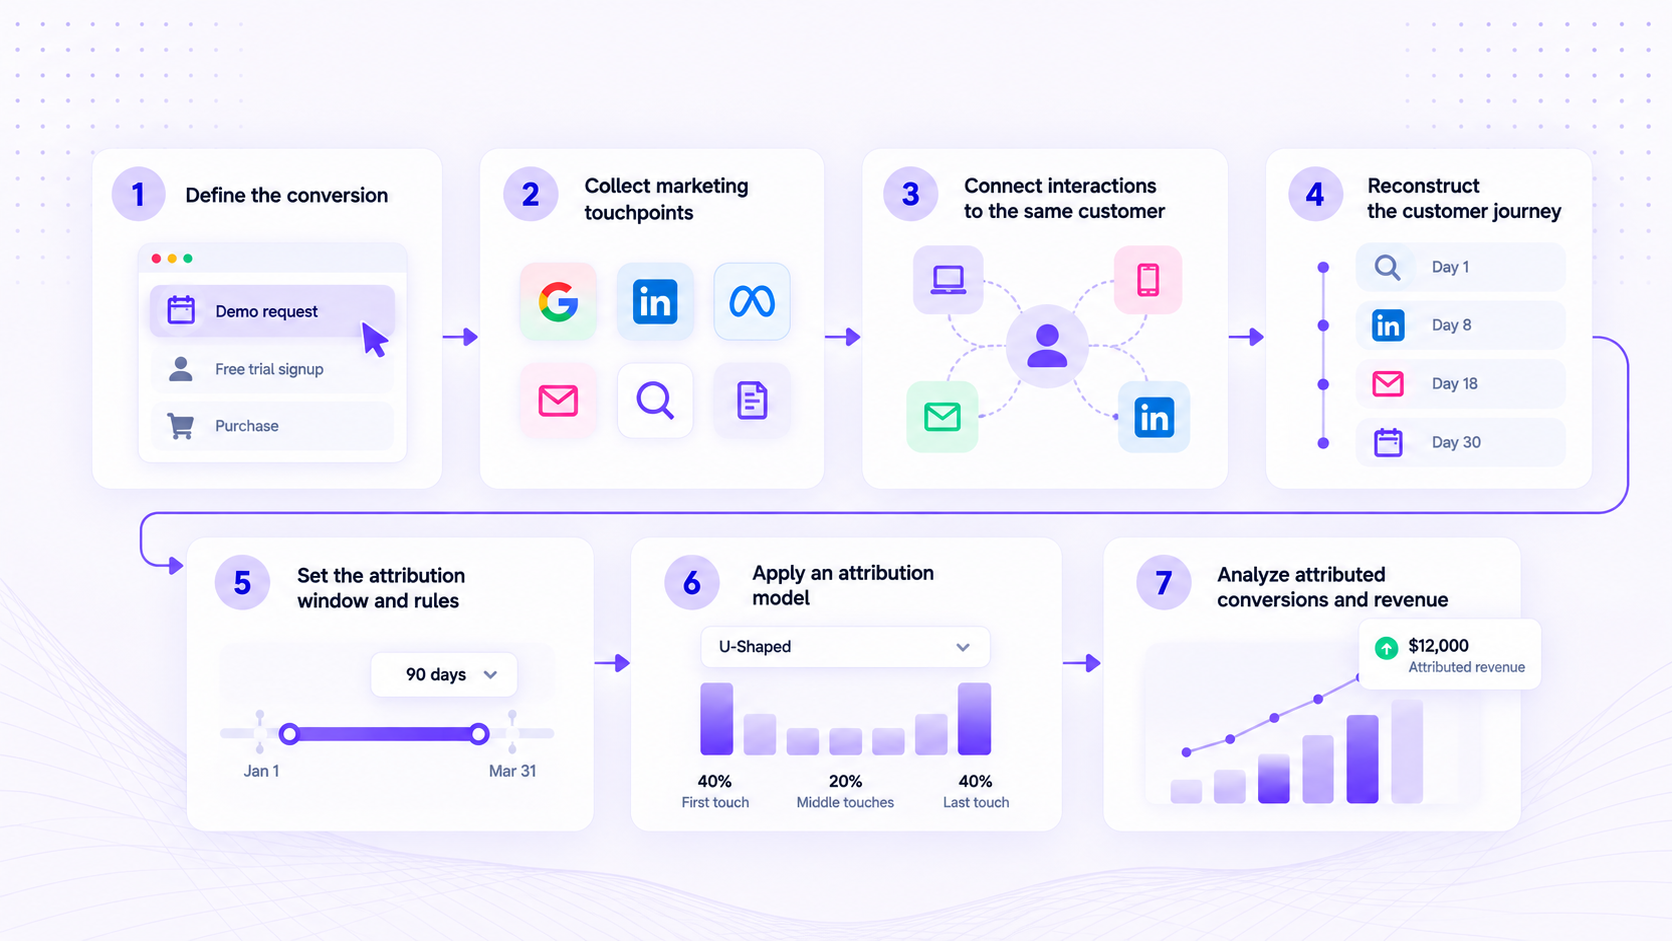
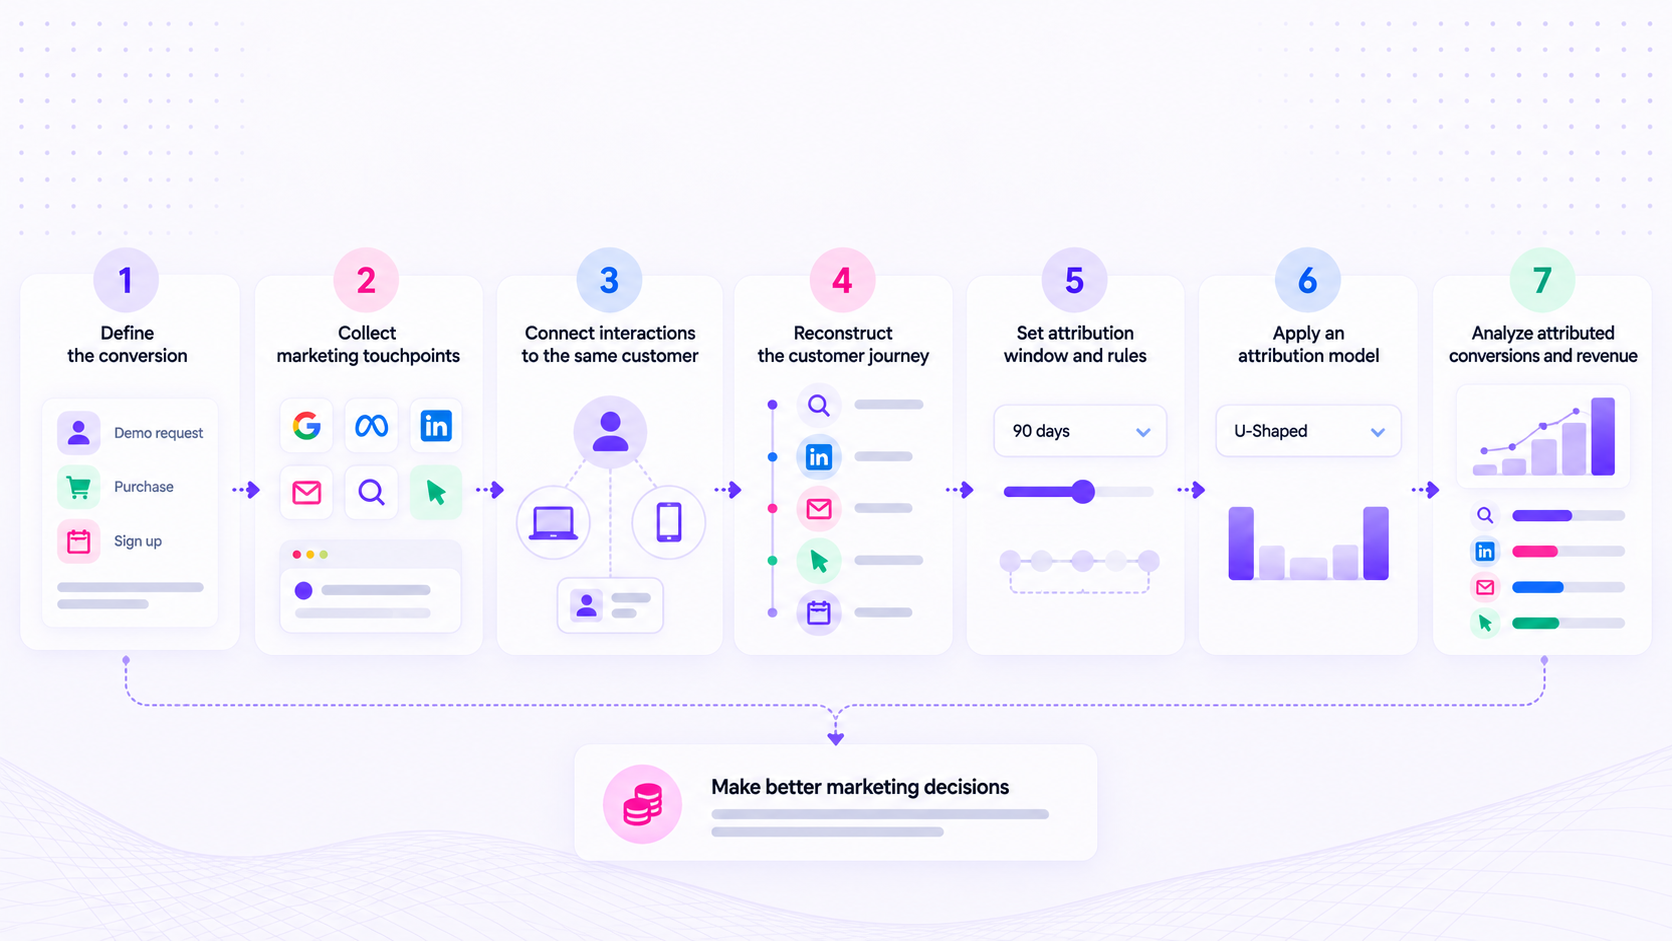
Multi-touch attribution works in seven steps:
- Define a conversion
- Collect marketing touchpoints
- Connect interactions to the same customer
- Reconstruct the customer journey
- Set attribution rules
- Apply an attribution model
- Analyze attributed conversions and revenue.
Each step determines how accurately marketing activity can be connected to business outcomes.
Step 1: Define the conversion you want to measure
Before assigning credit, you need to decide what counts as a conversion.
A conversion could be:
- A newsletter signup
- A free trial registration
- A demo request
- A qualified lead
- A sales opportunity
- A completed purchase
- A closed-won deal
The conversion you choose determines which interactions are relevant to the analysis.
For example, if you’re measuring demo requests, the journey ends when someone submits the demo form.
If you’re measuring closed-won revenue, the journey may extend through sales qualification, opportunity creation, and the final purchase.
Why it matters: The same marketing channel can receive different attribution credit depending on which conversion event you’re analyzing.
For revenue-focused businesses, connecting marketing interactions to pipeline and closed deals is often more valuable than measuring lead volume alone.
Step 2: Collect marketing touchpoint data
Once the conversion is defined, the next step is tracking interactions that happen before it.
These interactions are called marketing touchpoints.
They may include:
- Paid search and social ad clicks
- Organic search visits
- Referral traffic
- Email campaign clicks
- Blog and landing page visits
- Webinar registrations
- Product page visits
- Other identifiable marketing interactions
Attribution systems collect this information through website tracking, campaign parameters, integrations, event tracking, and other supported data sources.
UTM parameters are especially useful because they identify the campaign, source, and medium associated with incoming traffic.
For example:
?utm_source=linkedin&utm_medium=paid_social&utm_campaign=product_launch
These parameters help distinguish campaign-driven visits from other traffic.
However, UTMs alone aren’t enough. You also need reliable conversion events, timestamps, and identifiers to connect interactions across sessions.
Important: Not every marketing exposure can be captured. An ad impression, private conversation, or untracked interaction may influence a buyer without appearing in the attribution data.
Step 3: Connect interactions to the same customer
Collecting touchpoints is only useful when you can establish which interactions belong to the same person or account.
This process is often called identity resolution or identity stitching.
Consider a visitor who:
- Arrives through an organic search result.
- Returns through an email campaign.
- Signs up using a work email address.
- Later becomes a paying customer.
If the tracking system can reliably associate those interactions with the same identity, they can form a connected customer journey.
Depending on the system and available data, identity resolution may use first-party identifiers, authenticated user IDs, CRM contact IDs, or other permitted matching methods.
For B2B SaaS, account-level attribution can introduce additional complexity because several people from the same company may participate in a purchase.
A marketing manager might discover the product, a department head might evaluate it, and a finance stakeholder might approve the purchase.
Connecting those activities requires reliable account associations rather than assuming that all visitors from the same organization are automatically identifiable.
Why it matters: If interactions cannot be connected, the attribution model may assign credit using an incomplete journey.
Step 4: Reconstruct the customer journey
After connecting the interactions, the attribution system organizes them into a chronological conversion path.
A simplified journey might look like this:
Organic search → Paid social → Email → Demo request
Each touchpoint has associated information, such as:
- Channel and source
- Campaign
- Interaction timestamp
- Landing page
- Visitor or customer identifier
- Conversion event
This allows marketers to examine the sequence of interactions before a conversion.
It also helps answer questions such as:
- Which channels frequently introduce new visitors?
- Which touchpoints appear in the middle of successful journeys?
- What interactions typically happen before conversion?
- How long does it take someone to convert?
Tools with customer journey analytics can help visualize these paths and identify recurring interaction patterns.
Step 5: Set the attribution window and eligibility rules
Not every historical interaction should automatically receive credit for a conversion.
An attribution window, also called a lookback window, determines how far back the system considers interactions eligible for credit.
For example, imagine someone first visits your website on January 1 and converts on March 15.
With a 30-day lookback window, the January interaction falls outside the eligible period.
With a 90-day window, it may be included.
| Attribution window | What it considers |
| 7 days | Eligible interactions during the previous 7 days |
| 30 days | Eligible interactions during the previous 30 days |
| 90 days | Eligible interactions during the previous 90 days |
| 365 days | Eligible interactions during the previous 365 days |
The appropriate window depends on the buying cycle, available data, and business objectives.
A short purchasing journey may require only a few days of historical interactions.
A B2B SaaS buying process may span several months.
You also need rules for which interactions count. For example, should direct visits receive credit? Should repeated interactions with the same channel count separately? Should the conversion event itself be excluded from the list of preceding marketing touches?
These decisions can materially change the results.
Step 6: Apply a multi-touch attribution model
Once the eligible journey is established, an attribution model determines how credit is distributed.
Different models use different rules.
For example:
- Linear attribution: Every eligible touchpoint receives equal credit.
- U-shaped attribution: The first and last touchpoints receive greater weight.
- Time-decay attribution: Interactions closer to conversion receive progressively more credit.
- Custom attribution: Credit is distributed according to business-defined weights and rules.
The same customer journey can produce different attribution results under each model.
That’s why the model should reflect the business question you’re trying to answer rather than simply producing the most favorable channel performance.
We’ll calculate an example in the next section.
Step 7: Analyze attributed conversions and revenue
The final step is turning attribution credit into useful marketing insights.
Attribution reports aggregate the credit assigned to individual touchpoints across multiple conversions.
This allows you to analyze performance by channel, campaign, source, or other supported dimensions.
For example, you might discover that:
- Organic search frequently introduces customers who later convert through paid campaigns.
- Email contributes to many journeys without being the final interaction.
- Paid search receives substantial last-touch credit but less credit under a linear model.
- Some channels appear repeatedly in high-value customer journeys.
When conversion values are available, the same process can distribute attributed revenue rather than only conversion counts.
These insights help marketers investigate channel performance, evaluate assisting interactions, and make more informed budget decisions.
However, attribution credit should not be interpreted as proof that a channel caused the conversion.
Maximize your ROI
with accurate attribution
Multi-touch attribution example: From first interaction to revenue
Let’s walk through a practical example.
A B2B SaaS company acquires a customer worth $12,000 in annual contract value.
Before purchasing, the customer has four eligible marketing interactions.
| Day | Marketing touchpoint | Journey stage |
| Day 1 | Organic search | Discovery |
| Day 8 | LinkedIn ad | Consideration |
| Day 18 | Email campaign | Evaluation |
| Day 30 | Paid search | Final marketing interaction |
The customer subsequently purchases a $12,000 annual subscription.
For simplicity, assume all four interactions are tracked, eligible, and connected to the same customer.
Now let’s examine how different attribution models distribute the $12,000.
Linear attribution example
Linear attribution gives equal credit to all four interactions.
Each touchpoint receives:
$12,000 ÷ 4 = $3,000
| Channel | Credit | Attributed revenue |
| Organic search | 25% | $3,000 |
| LinkedIn ad | 25% | $3,000 |
| 25% | $3,000 | |
| Paid search | 25% | $3,000 |
| Total | 100% | $12,000 |
This model treats all eligible interactions equally, regardless of their position in the journey.
U-shaped attribution example
A common U-shaped model assigns:
- 40% to the first interaction
- 40% to the last interaction
- 20% shared across the middle interactions
In our example:
| Channel | Credit | Attributed revenue |
| Organic search | 40% | $4,800 |
| LinkedIn ad | 10% | $1,200 |
| 10% | $1,200 | |
| Paid search | 40% | $4,800 |
| Total | 100% | $12,000 |
Organic search and paid search receive the greatest credit because they occupy the first and last eligible positions.
Time-decay attribution example
Time-decay attribution gives greater weight to interactions closer to conversion.
To illustrate how time-decay attribution shifts credit toward later interactions, we’ll use simplified weights of 5%, 15%, 30%, and 50%.
| Channel | Credit | Attributed revenue |
| Organic search | 5% | $600 |
| LinkedIn ad | 15% | $1,800 |
| 30% | $3,600 | |
| Paid search | 50% | $6,000 |
| Total | 100% | $12,000 |
What does this example tell us?
The customer journey and the $12,000 contract value never changed.
Only the attribution model changed.
- Under linear attribution, organic search receives $3,000 in credit.
- Under U-shaped attribution, it receives $4,800.
- Under the illustrative time-decay model, it receives only $600.
This is why marketers should compare attribution models before deciding that a particular channel deserves more or less investment.
The model changes the distribution of credit. It doesn’t change the underlying revenue.
How is multi-touch attribution calculated?
MTA calculations depend on the model, but the underlying principle is straightforward.
First, each eligible touchpoint receives a percentage of conversion credit.
Then that percentage is multiplied by the conversion value.
The general formula is:
Attributed revenue = Conversion value × Touchpoint attribution weight
For example, if a touchpoint receives 30% credit for a $10,000 conversion:
Attributed revenue = $10,000 × 0.30 = $3,000
For a single conversion, the weights assigned to eligible touchpoints should add up to 100%.
If you’re calculating attributed conversion counts rather than revenue, the same weighting principle applies.
For example, a touchpoint receiving 25% credit for one conversion receives 0.25 attributed conversions.
How to calculate linear attribution
Linear attribution uses equal weights.
Touchpoint credit = 1 ÷ Number of eligible touchpoints
For five eligible touchpoints:
1 ÷ 5 = 20%
Each touchpoint receives 20% of the conversion credit.
How to calculate U-shaped attribution
In a common 40/20/40 U-shaped model:
- First touch = 40%
- Last touch = 40%
- Middle touches share 20%
If there are five eligible interactions, the three middle touchpoints each receive:
20% ÷ 3 = approximately 6.67%
Special rules are needed when a journey contains only one or two eligible touchpoints.
How to calculate time-decay attribution
Time-decay attribution assigns weights according to how recently interactions occurred.
A common exponential approach uses:
Raw weight = 2^(-d/h)
Where:
- d = Number of days between the touchpoint and conversion
- h = Half-life, in days
A touchpoint occurring one half-life earlier receives half the raw weight of an otherwise equivalent touchpoint occurring at conversion.
The raw weights are then normalized so their total equals 100%.
Normalized touchpoint credit = Touchpoint raw weight ÷ Sum of all raw weights
The specific time-decay formula and half-life depend on the attribution system.
For a detailed comparison of calculation rules and other approaches, explore our marketing attribution models guide.
How do different multi-touch attribution models assign credit?
There isn’t one universally correct way to distribute conversion credit.
Each attribution model emphasizes different parts of the customer journey.
| Model | How credit is assigned | Useful when |
| Linear | Equally across eligible touchpoints | You want a neutral baseline for comparing journey participation |
| U-shaped | More weight to first and last interactions | You want to emphasize discovery and the final marketing touch |
| Time-decay | More weight to recent interactions | You want to emphasize activity closer to conversion |
| W-shaped | More weight to selected milestones, often first touch, lead creation, and opportunity creation | Your sales process has reliably tracked funnel milestones |
| Custom weighted | According to defined business rules | Standard models don’t reflect the stages or assumptions you want to test |
First-click and last-click models are also useful for comparison, but they are single-touch models because they assign all credit to one interaction.
Some attribution systems also use data-driven or algorithmic approaches to estimate how credit should be distributed. Unlike rule-based models, these methods derive weights from observed data, although their results still depend on data quality and modeling assumptions.
If you’re exploring algorithmic approaches, read our guide to AI-driven marketing attribution.
What data do you need for multi-touch attribution?
A multi-touch attribution model is only as useful as the data entering it.
At minimum, you need reliable information about marketing interactions, customer identities, and conversion outcomes.
| Data requirement | Purpose |
| Campaign source and medium | Identify where visitors originate |
| UTM parameters and campaign IDs | Connect interactions to marketing campaigns |
| Interaction timestamps | Reconstruct the journey sequence |
| Visitor or user identifiers | Associate interactions with the same person |
| Conversion events | Define the outcome being measured |
| Conversion value | Calculate attributed revenue |
| CRM contact and opportunity data | Connect marketing activity to sales outcomes |
| Attribution window | Determine which historical interactions qualify |
For B2B companies, CRM data becomes particularly important when the objective is measuring pipeline or closed-won revenue.
Website analytics may capture the original interaction, but the commercial outcome might happen weeks later in a CRM.
Connecting those records helps marketers evaluate more than form submissions.
For example, a campaign that produces fewer leads may still contribute to more valuable opportunities.
Similarly, content attribution can reveal which articles and pages participate in converting journeys rather than judging content performance solely by pageviews.
What are the biggest challenges with multi-touch attribution?
Multi-touch attribution provides a broader view of recorded customer journeys, but it has important limitations.
Understanding these limitations is essential before using attribution results to make major spending decisions.
1. Missing or untracked touchpoints
Not every interaction leaves a measurable digital trail.
A buyer might hear about your company from a colleague, view an advertisement without clicking, or research your product on another device- the same kind of attribution crisis in LLM search results that researchers have found is making it harder to credit originating sources for traffic and influence.
If those interactions aren’t captured, they won’t appear in the attributed journey.
What helps: Improve first-party data collection, campaign tracking, and integration coverage while acknowledging that some influences will remain unobserved.
2. Cross-device and identity gaps
A person may discover your product on a phone, research it on a laptop, and convert on another device.
Without reliable identity continuity, those interactions may appear as separate journeys.
What helps: Use appropriate authenticated identifiers and consent-aware identity matching where available. Avoid assuming that every anonymous interaction can be reconstructed.
3. Inconsistent campaign tracking
Missing UTMs, inconsistent naming conventions, and incorrect channel classifications can distort attribution reports.
For example, the same campaign might appear under several source names if tracking parameters aren’t standardized.
What helps: Establish consistent campaign naming rules and regularly audit traffic classifications.
4. Attribution model bias
Every attribution model makes assumptions about which interactions deserve credit.
Linear attribution assumes equal weighting.
U-shaped attribution emphasizes the first and last touchpoints.
Time-decay attribution emphasizes recent activity.
None of these assumptions automatically proves how much a channel caused the conversion.
What helps: Compare multiple models and investigate why channel rankings change to avoid attribution bias.
5. Challenges with offline channel attribution
Phone calls, in-store visits, and offline interactions don’t naturally integrate with digital tracking, making it difficult to measure their impact.
What helps: Assign unique promo codes, phone numbers, or QR codes to offline campaigns using tools like The QR Code Generator (TQRCG). Then, import this data into your attribution tool to connect online and offline interactions. Using QR code tracking also helps attribute scans to specific campaigns, improving visibility into how offline touchpoints influence digital conversions.
6. Attribution is not incrementality
This is one of the most important distinctions.
Attribution assigns credit to observed interactions associated with a conversion.
Incrementality asks whether the conversion would have happened without a particular marketing activity.
A channel can receive substantial attribution credit without being responsible for an equivalent amount of additional revenue.
To investigate causal impact, teams may need controlled experiments, holdout tests, or other complementary measurement methods, such as the self-serve incrementality tests Google now offers advertisers for Search and Performance Max campaigns.
How multi-touch attribution works in Usermaven
Understanding the mechanics is one thing. Applying them across campaigns, customer journeys, and revenue data is where attribution becomes operationally useful.
Usermaven’s multi-touch attribution software brings attribution reporting together with website analytics, customer journeys, conversion tracking, and revenue analysis.
Here’s how the workflow connects to the process we’ve covered.
Track marketing interactions and conversions
Usermaven collects website activity and conversion events, allowing teams to analyze marketing touchpoints across tracked customer journeys.
Campaign data and supported integrations provide additional context for acquisition and performance reporting.
Teams can define conversion goals around important business actions, such as signups, demo requests, or purchases.
Maximize your ROI
with accurate attribution
Analyze conversion paths
Usermaven’s attribution reporting includes conversion path analysis, helping teams examine the sequences of interactions that occur before selected conversion goals.
This makes it easier to identify channels that frequently introduce visitors, participate in middle-stage journeys, or appear near conversion.
Combined with user journey analytics, teams can investigate how users navigate their websites and products.
Compare attribution models
Usermaven supports eight attribution models, including first-touch, last-touch, linear, U-shaped, time-decay, and custom attribution.
Custom attribution models allow businesses to define their own weighting rules for selected journey stages and channels.
Instead of accepting a single attribution perspective, teams can compare how different models distribute credit.
For example, you can investigate whether organic search receives more credit under first-touch attribution than under last-touch attribution.
Analyze longer customer journeys
Usermaven supports attribution lookback windows of up to 365 days.
This is particularly relevant for B2B SaaS companies and other businesses where customers may take months to evaluate a product.
Longer windows help retain eligible historical interactions, provided the underlying tracking and identity data is available.
Connect marketing activity to revenue
Usermaven helps teams analyze how marketing channels, campaigns, and touchpoints contribute to conversions, pipeline, and revenue.
With supported CRM and marketing integrations, teams can connect acquisition activity with downstream business outcomes.
This supports questions such as:
- Which channels contribute to high-value customers?
- Which campaigns assist revenue-generating journeys?
- How does attributed revenue change between models?
- Are channels generating leads that eventually become customers?
For businesses focused on sales outcomes, pipeline attribution provides a way to evaluate marketing activity beyond initial conversions.
Investigate attribution with Maven AI
Maven AI allows teams to explore marketing and product data conversationally.
Instead of manually investigating every report, marketers can ask questions about attribution, campaign performance, revenue, and customer journeys.
For example:
How does organic search’s attributed revenue change between first-touch, linear, and U-shaped models over the last 90 days?
Maven AI can help investigate these patterns and present relevant insights.
However, AI-assisted analysis still depends on the quality and completeness of the underlying data.
Want to understand how your marketing touchpoints contribute to revenue? Book a personalized Usermaven demo.
Final thoughts
Multi-touch attribution works by connecting marketing interactions to conversions and distributing credit according to a defined attribution model.
The real value isn’t in finding one channel to declare the winner. It’s in understanding how different interactions participate in the buying process and how those patterns change across customers, campaigns, and revenue outcomes.
With reliable tracking, meaningful conversion goals, and consistent model comparisons, MTA becomes a practical part of better marketing measurement.
Explore Usermaven’s multi-touch attribution capabilities to connect customer journeys with conversions, pipeline, and revenue.
Maximize your ROI
with accurate attribution
Frequently asked questions
1. How does multi-touch attribution work in simple terms?
Multi-touch attribution tracks eligible marketing interactions before a conversion and distributes credit among them using an attribution model. For example, a linear model assigns equal credit to every eligible touchpoint, while a U-shaped model gives greater weight to the first and last interactions.
2. How do you calculate multi-touch attribution?
Multi-touch attribution is calculated by assigning a percentage of conversion credit to each eligible touchpoint. For example, with four interactions and a linear attribution model, each receives 25% credit. For a $10,000 conversion, that equals $2,500 in attributed revenue per touchpoint. Other models use different weighting rules.
3. What is an example of multi-touch attribution?
Suppose a customer interacts with an organic search result, a paid ad, and an email campaign before purchasing. Under linear attribution, each interaction receives 33.33% of the conversion credit. Under a U-shaped model, the first and last interactions receive more credit than the middle interaction.
4. What is the difference between single-touch and multi-touch attribution?
Single-touch attribution assigns 100% of conversion credit to one interaction, typically the first or last. Multi-touch attribution distributes credit across several eligible interactions in the customer journey, providing a broader view of how marketing channels participate in conversions.
5. Can multi-touch attribution measure revenue and ROI?
Multi-touch attribution can distribute revenue credit across marketing touchpoints when conversion values or CRM revenue data are available. Combined with marketing spend, these results can support attributed ROAS and ROI analysis. However, attributed revenue does not prove incremental revenue or establish the causal return from a channel.

Written by
Adeel Khan
Growth Marketing Expert
Adeel Khan is a full-stack SaaS marketer with 10+ years of experience in content marketing, paid advertising, analytics, and conversion rate optimization. He shares practical insights and strategies drawn from hands-on experience, helping B2B SaaS marketers improve performance and make better marketing decisions.
All articles by Adeel →