If 2025 was the year of AI automation in Google Ads, 2026 is the year of precision.
Marketers are no longer satisfied with clicks. They want proof that every dollar drives real results and measurable ROI.
But precision doesn’t come from guessing or copying what competitors do; it starts with understanding where you actually stand. That’s what makes Google Ads benchmarks so powerful.
They act like a compass, showing you what “good” performance looks like in your industry and where your campaigns might be falling short.
Let’s break down how different industries are performing and what these benchmarks mean for creating more efficient, accountable ad strategies.
They act as reference points, allowing marketers to compare how their ads perform against others in their niche.
Why benchmarks matter
Benchmarks help you:
Spot strengths and weaknesses in your ad campaigns.
Understand how competitive your niche is.
Plan budgets and bidding strategies more efficiently.
Set realistic expectations for ad performance.
However, they’re not one-size-fits-all. Your actual performance depends on your audience, ad creatives, landing page experience, and attribution accuracy.
💡Insight: Benchmarks are averages, not goals. The real insight lies in your data. Tools like Usermaven help reveal how your actual campaigns stack up against these averages and where you can improve.
5 metrics that define Google Ads benchmarks
Let’s break down the five main metrics marketers track when analyzing benchmarks.
Click-through rate (CTR)
CTR measures how often users click your ad after seeing it. It shows how relevant your ad copy and visuals are to search intent.
A CTR above 3% is considered strong in most industries.
Display campaigns typically see lower CTRs (around 0.5–1.2%), while search ads can exceed 5% in high-intent niches.
Cost per click (CPC)
CPC reflects how much you pay for each click. It varies by competition, keyword demand, and quality score.
For example:
Ecommerce CPCs tend to hover between $0.90–$1.30.
Finance or B2B can reach $3–$6 per click due to high-value leads.
Conversion rate (CVR)
CVR shows how many users complete your desired action (e.g., purchase, sign-up, demo). High CVRs indicate that your landing page and offer align well with ad intent.
Cost per acquisition (CPA)
CPA tracks how much you spend to acquire one customer or lead. A good CPA depends on your business model. $20 might be excellent for ecommerce, while $150 could be fine for SaaS.
Return on ad spend (ROAS)
ROAS measures how much revenue you earn for every dollar spent on advertising. It’s one of the clearest indicators of campaign profitability.
Formula: ROAS = Revenue ÷ Ad Spend
A 4× ROAS means you earn $4 for every $1 spent. Ecommerce brands often aim for 3–5×, while subscription-based models prioritize LTV over immediate ROAS.
Pro Tip: Use Usermaven’s ad attribution software to see which campaigns actually drive conversions. Without it, ROAS can look great in one channel but be inflated by cross-channel overlaps.
Google Ads benchmarks by industry
Benchmarks vary widely by vertical. Let’s look at where each industry stands heading into 2026.
Average Click-Through Rate (CTR) by Industry
Industry
Average CTR (Search)
Average CTR (Display)
E-Commerce
4.10%
0.59%
Technology
2.09%
0.39%
Finance & insurance
2.91%
0.52%
Health & medical
3.27%
0.59%
Education
3.78%
0.53%
Consumer services
2.41%
0.51%
Real estate
3.71%
1.08%
B2B
3.00%
0.46%
Legal
2.93%
0.59%
Home goods
3.71%
0.49%
Industrial services
3.37%
0.50%
Travel & hospitality
4.68%
0.47%
Auto
4.00%
0.60%
Employment services
2.42%
0.46%
Advocacy
4.41%
0.59%
💡 Insight: Industries like travel, ecommerce, and auto see higher CTRs because their ads usually target high-intent searches. B2B and legal tend to have lower CTRs but attract more qualified leads per click.
Average Cost Per Click (CPC) by Industry
Industry
Average CPC (Search)
Average CPC (Display)
Legal
$6.75
$0.72
Consumer Services
$6.40
$0.81
Technology
$3.80
$0.51
Finance & Insurance
$3.44
$0.86
B2B
$3.33
$0.79
Home Goods
$2.94
$0.60
Health & Medical
$2.62
$0.63
Industrial Services
$2.56
$0.54
Education
$2.40
$0.47
Real Estate
$2.37
$0.75
Employment Services
$2.04
$0.78
Auto
$2.46
$0.58
Travel & Hospitality
$1.53
$0.44
E-Commerce
$1.16
$0.45
Advocacy
$1.43
$0.62
💡 Insight: Legal and consumer services have the highest CPCs because competition and lead values are high. On the other hand, ecommerce and advocacy campaigns enjoy more affordable clicks.
Average Conversion Rate (CVR) by Industry
Industry
Average CVR (Search)
Average CVR (Display)
Legal
6.98%
1.84%
Consumer services
5.00%
1.19%
Employment services
5.13%
1.57%
Finance & insurance
5.10%
1.19%
Auto
6.03%
1.19%
Education
3.39%
0.50%
Real estate
2.47%
0.80%
B2B
3.04%
0.80%
E-commerce
2.81%
0.59%
Health & medical
3.36%
0.82%
Technology
2.31%
0.86%
Home goods
2.81%
0.43%
Industrial services
3.37%
0.94%
Travel & hospitality
3.55%
0.51%
Advocacy
1.96%
1.00%
💡 Insight: Conversion rates tend to be higher in service-based industries where intent is stronger, like legal, finance, and employment. Ecommerce and technology typically have lower CVRs but benefit from larger volume and repeat customers.
Average Cost Per Acquisition (CPA) by Industry
Industry
Average CPA (Search)
Average CPA (Display)
B2B
$116.13
$130.36
Technology
$133.52
$103.60
Consumer services
$90.70
$60.48
Legal
$86.02
$39.52
Finance & insurance
$81.93
$56.76
Health & medical
$78.09
$72.58
Industrial services
$79.28
$51.58
Home goods
$88.80
$71.88
Real estate
$66.02
$41.14
Education
$45.56
$48.96
Employment services
$48.04
$59.47
E-commerce
$45.27
$65.80
Auto
$33.52
$23.68
Travel & hospitality
$45.28
$33.17
Advocacy
$96.55
$70.69
💡 Insight: B2B and tech brands pay more per conversion due to longer sales cycles. Auto and travel, on the other hand, have lower CPAs thanks to faster, more impulsive decision-making.
Average Return on Ad Spend (ROAS) by Industry
Industry
Average ROAS (Estimate)
E-commerce
4.8×
Travel & hospitality
5.2×
Finance & insurance
3.9×
Legal
3.4×
B2B
3.2×
Technology
3.0×
Health & medical
3.6×
Real estate
4.3×
Consumer services
4.0×
Education
3.7×
Employment services
4.2×
Industrial services
3.8×
Auto
4.5×
Home goods
4.0×
Advocacy
3.0×
💡 Insight: Ecommerce and travel continue to lead in ROAS due to shorter conversion paths and repeat purchase potential. Sectors with longer funnels, like B2B and tech, see lower but more sustained returns over time.
⚙️ Optimization tips
Use funnelsanalytics to identify where shoppers drop off post-click. Combining Google Ads data with behavioral insights can reveal which campaigns actually drive purchases instead of just traffic.
Track post-click actions like form submissions or appointment bookings. Linking ad data with on-site user behavior helps pinpoint which campaigns truly attract high-intent patients.
Emerging trends in Google Ads performance for 2026
Now’s a good time to look at what’s changing in Google Ads so you’re ready for the year ahead.
AI-powered campaigns dominate
‘Performance Max’ and ‘Demand Gen’ campaigns are taking center stage in 2026. These AI-driven formats automatically place your ads across search, YouTube, and Discover, helping you reach wider audiences with minimal manual setup.
But with all this automation, marketers are losing control over which channels, keywords, or audiences perform best. Usermaven pulls your Google Ads data into one dashboard alongside your web and product analytics, giving you a clear, connected view of what AI campaigns are really delivering.
Tip: Use Usermaven’s campaign tracking and funnel reports to see how visitors from your campaigns behave after the click. This helps you spot which AI-driven campaigns bring real conversions and which only generate top-of-funnel traffic.
Attribution is getting harder
GA4 often falls short in showing the entire customer journey. Many marketers now rely on first-party data tracking to regain visibility into which ads truly drive results.
Usermaven’smulti-touch attribution works on giving you that missing clarity. It connects customer journey touchpoints from the first click to the final sale (last click) and lets you compare different attribution models. This helps you see not just which ad got the conversion, but which one influenced it.
Tip: Try different attribution models in Usermaven’s comparison view to test multiple models side by side. You’ll often discover campaigns that drive early engagement or assist conversions that traditional reports overlook.
Creative quality is driving bigger performance gaps
AI bidding has made campaign setup easier, but creative quality now separates good ads from great ones. Brands using UGC-style videos, storytelling, and personalized visuals see stronger engagement than those relying on stock content.
Usermaven helps you analyze performance by creative type and landing page. You can easily see which visuals lead to conversions and which fall flat.
Micro-moment and location-based targeting are growing
People act quickly when they see something relevant nearby or at the right time.“Near me” and time-sensitive searches are driving strong results, especially on mobile. Advertisers who catch users at the right moment are seeing better engagement and conversions.
Usermaven’s behavioral analytics can help you spot these high-intent moments by showing when and where users convert most. You can then use those insights to fine-tune your targeting and budget timing.
Tip: Use your conversion timing data to schedule ads around peak engagement hours. It’s an easy way to lower CPC while keeping performance high.
Cross-channel measurement and value-based bidding are rising
Marketers are moving away from last-click attribution. Instead, they’re measuring customer lifetime value (LTV) and optimizing for long-term ROI, not just immediate conversions.
With Usermaven’s multi-touch attribution and LTV tracking, you can see the entire path a user takes across different campaigns and channels. This helps you understand which clicks drive not only conversions but also high-value, repeat customers.
Tip: Use LTV data in Usermaven to identify your most profitable customer segments, then increase bids for audiences that bring long-term growth.
How to interpret Google Ads benchmarks wisely
Benchmarks are useful, but only when you know how to read them the right way. Here’s how to make sure you’re getting real insights instead of surface-level comparisons.
1. Don’t compare across industries
A 2% CTR in B2B can outperform a 4% CTR in travel. Always compare within your niche.
2. Look at trends, not one-off numbers
If your CPC increased 20% from last year but conversions doubled, that’s still progress.
3. Use your own data to find the truth
Benchmarks are reference points, not goals. With Usermaven, you can overlay benchmark data with your actual performance to see whether your campaigns truly outperform industry standards.
4. Track the full funnel, not just clicks
A high CTR means little if users don’t convert. Analyze how traffic behaves after the click to understand true campaign performance.
5. Consider seasonality and audience intent
Benchmarks can shift during holidays or sale periods. Always compare your results to similar time frames and audience types.
How Usermaven helps you go beyond benchmarks
Benchmarks give you the “what.” Usermaven gives you the “why.”
Here’s how it elevates your Google Ads strategy:
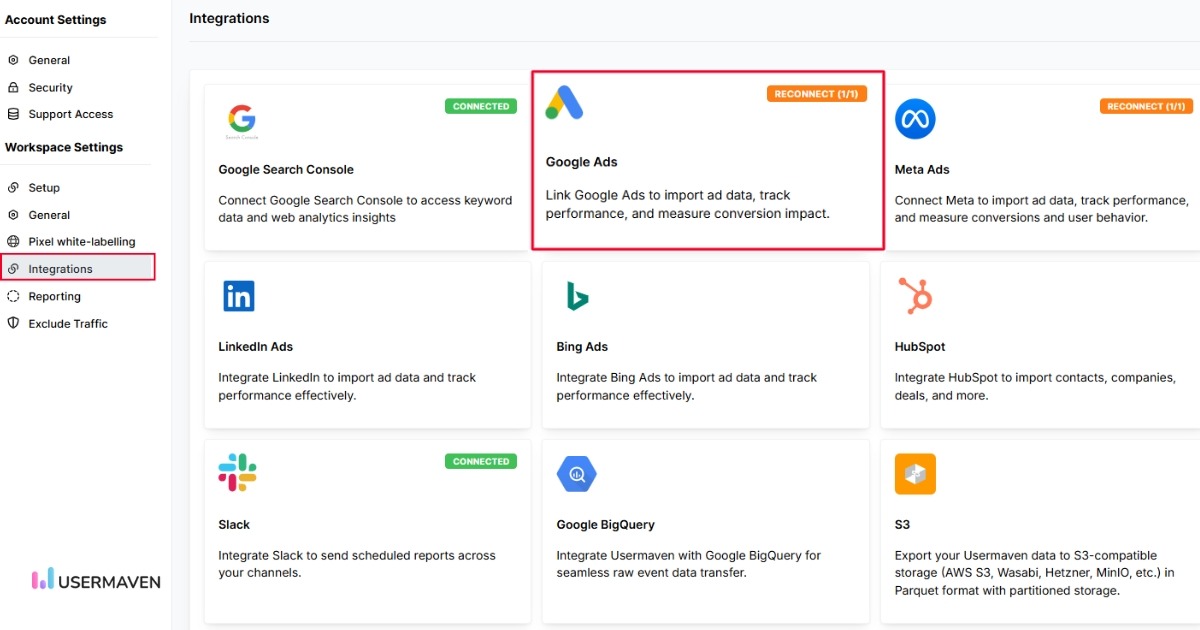
Easy Google Ads integration
Connecting your Google Ads account to Usermaven takes only a few clicks. Once synced, your ad data flows automatically into your dashboard alongside your product and web analytics.
With this easy connection, you can improve ad performance with conversion syncs, ensuring every lead and purchase is tracked accurately. This setup lets you view ad performance, conversions, and revenue in one place without juggling spreadsheets.
Unified ad tracking across the customer journey
Usermaven combines data from Google Ads, your website, and your product activity into one timeline. You can finally follow every customer journey from the first ad click to the final purchase or signup, no matter how many touchpoints it takes.
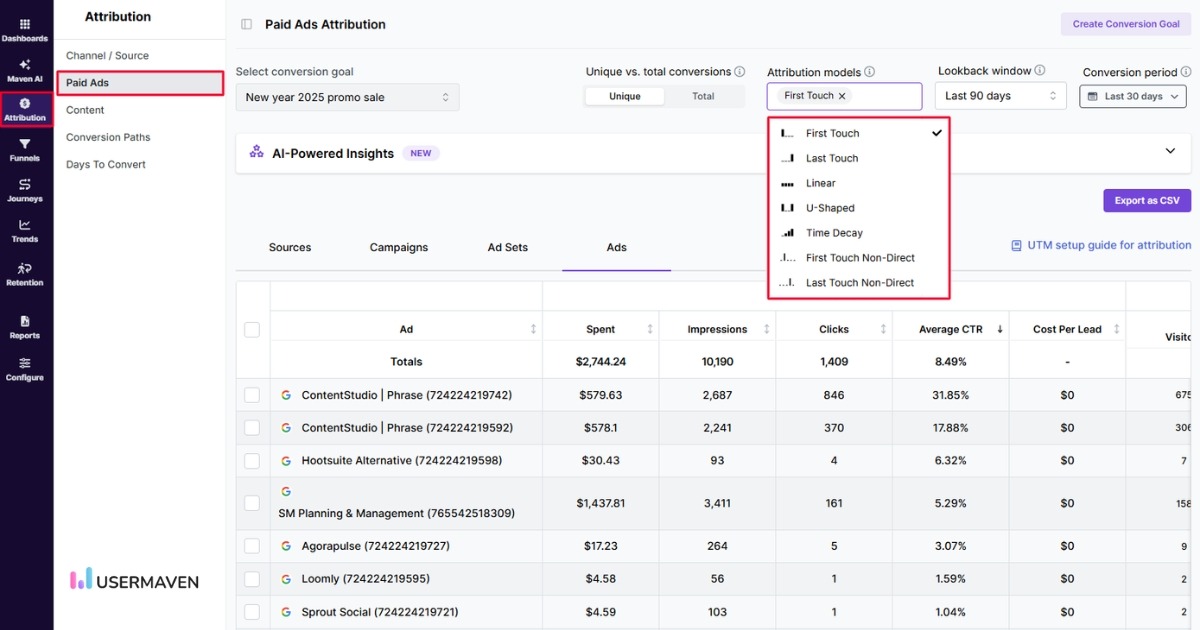
Multi-touch attribution that tells the real story
Most reports stop at “who got the last click.” Usermaven digs deeper. It connects all interactions and lets you switch between first touch, last touch, linear, u-shaped, and time decay models, even non-direct versions that ignore direct visits. This shows you which ads spark awareness, which assist conversions, and which close the deal so you can invest where it truly counts.
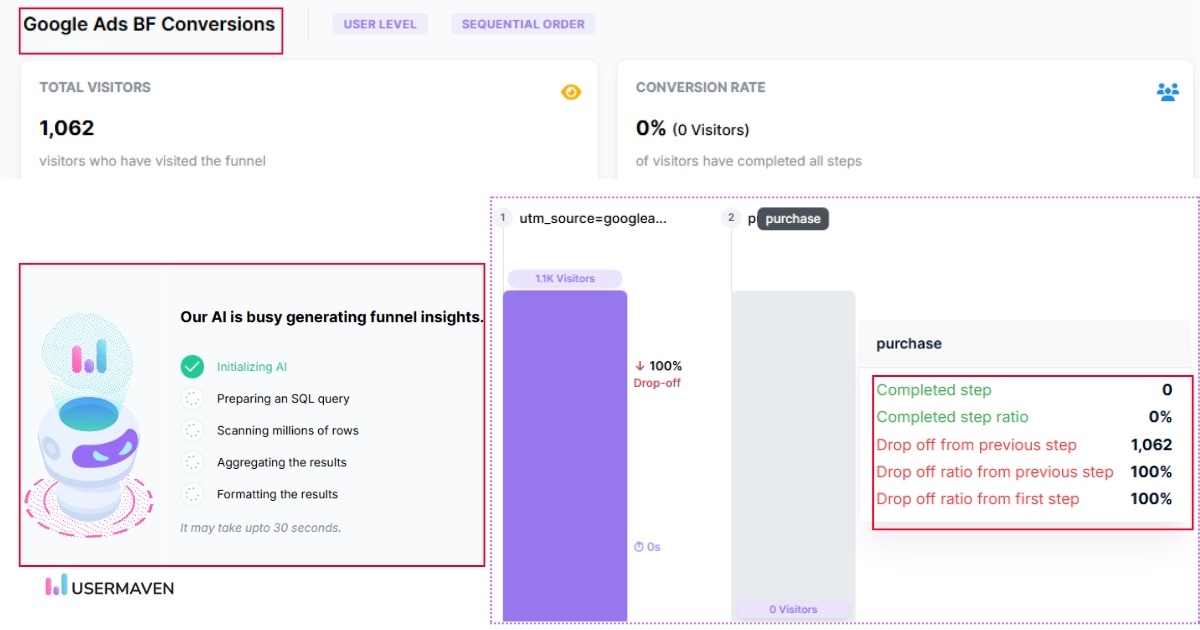
Funnel analysis that finds drop-offs fast
Usermaven visualizes how people move through your ad funnel. You can spot where users lose interest, which landing and exit pages perform best, and how changes in your messaging affect results. It’s like having a roadmap to fix weak spots and boost your ROAS.
LTV and revenue insights for smarter scaling
Not all conversions are equal. Usermaven helps you look beyond the first purchase by tracking customer lifetime value. You’ll see which campaigns bring loyal, high-value customers versus one-time buyers, helping you scale campaigns that drive lasting growth.
Smarter decisions, backed by real data
Usermaven replaces guesswork with clarity. Instead of depending on Google’s limited reports, you get a connected view of your marketing ecosystem. You’ll know exactly which ads create awareness, which drive conversions, and which nurture repeat buyers, all backed by accurate, first-party data.
How to improve your Google Ads performance in 2026
Here’s how to make the most of these benchmarks and your analytics data:
Focus on high-intent keywords: They deliver better ROAS even at higher CPCs.
A/B test creatives regularly: Refresh ad visuals to fight fatigue.
Optimize landing pages: Faster pages mean higher conversion rates.
Use audience segmentation: Align messaging by lifecycle stage.
Leverage attribution insights: Identify which campaigns actually drive conversions using Usermaven.
Track beyond the click: Analyze the full customer journey for smarter re-marketing and retention.
Use negative keywords smartly: Block irrelevant searches so your ads only show to people who actually matter.
Review data trends often: Don’t chase single-day results. Watch week-over-week patterns to make smarter optimization choices.
To sum it up, benchmarks can guide you, but they shouldn’t define you. Real success comes from understanding your own data, how people interact with your ads, and where your true ROI comes from.
In 2026, the most successful marketers won’t just follow averages. They’ll dig deeper, using first-party analytics and attribution insights to make smarter, faster decisions.
That’s where Usermaven becomes your advantage. As a powerful marketing attribution tool, it helps you see the full story behind every click.
Ready to see your Google Ads performance from a whole new angle?
Book a demo with Usermaven and discover how real data clarity can help you outperform every benchmark in your industry.
FAQs
1. How often should I review my Google Ads benchmarks?
Benchmarks change as competition, costs, and consumer behavior evolve. Reviewing them quarterly helps you stay aligned with industry shifts and adjust your strategy before performance dips.
2. What’s the difference between a good benchmark and a performance goal?
Benchmarks show average performance across an industry, while goals are based on your own past data and growth potential. A good strategy uses both benchmarks for context and your own analytics for direction.
3. How can small businesses compete with larger brands in Google Ads?
Smaller brands can compete by focusing on niche keywords, hyper-local targeting, and audience segmentation. Tracking and optimizing campaigns with a tool like Usermaven helps identify which smaller wins lead to bigger returns.
4. Why do my results differ from published Google Ads benchmarks?
Benchmarks represent broad averages, but your campaigns depend on factors like location, audience intent, and creative quality. Using first-party analytics helps you understand why your performance looks different.
5. Are there specific benchmarks for Performance Max or Demand Gen campaigns?
Yes, but they vary more widely than traditional campaigns because AI distributes ads across multiple networks. The best approach is to measure success using your own funnel and attribution data instead of relying only on averages.
Triple Whale is a popular ecommerce analytics and attribution platform for Shopify and DTC brands. It helps teams track store performance, ad spend, attribution, and customer insights in one place. But its pricing isn’t a single flat monthly cost. Triple Whale pricing changes based on annual GMV, plan type, and the level of measurement a […]
A growing marketing team requests pricing from three attribution vendors. One quotes a number through an interactive calculator that jumps as they adjust a slider. Two others say to contact sales with no figure attached at all. Three conversations later, the team still does not know whether attribution software costs $80 or $8,000 per month […]
Marketers like to think of the buyer’s journey as linear: someone finds your website through Google, signs up for your newsletter, and buys your product. Except, in real life, it looks more like this: a new subscriber opens your welcome email while commuting to work, gets distracted, and forgets about your offer. A few days […]